EX-99.3
Published on June 3, 2025
Exhibit 99.3 June 3, 2025 Blue Owl Technology Finance Corp. (“OTF”) Overview of Intention to List on the New York Stock Exchange Highly Confidential. Trade Secret.
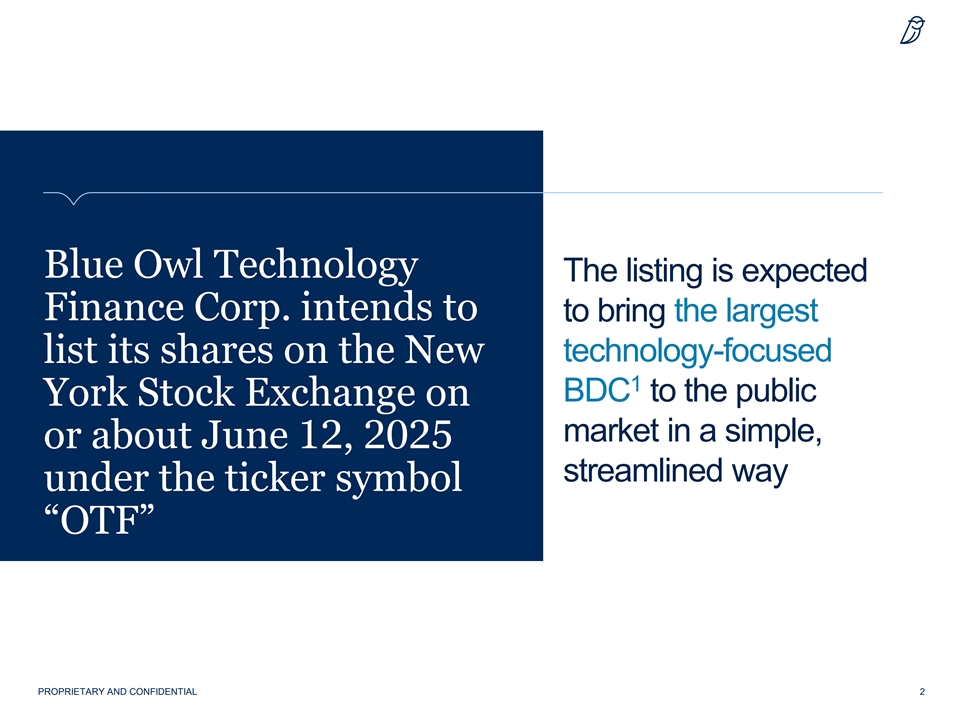
Blue Owl Technology The listing is expected Finance Corp. intends to to bring the largest technology-focused list its shares on the New 1 BDC to the public York Stock Exchange on market in a simple, or about June 12, 2025 streamlined way under the ticker symbol “OTF” PROPRIETARY AND CONFIDENTIAL 2
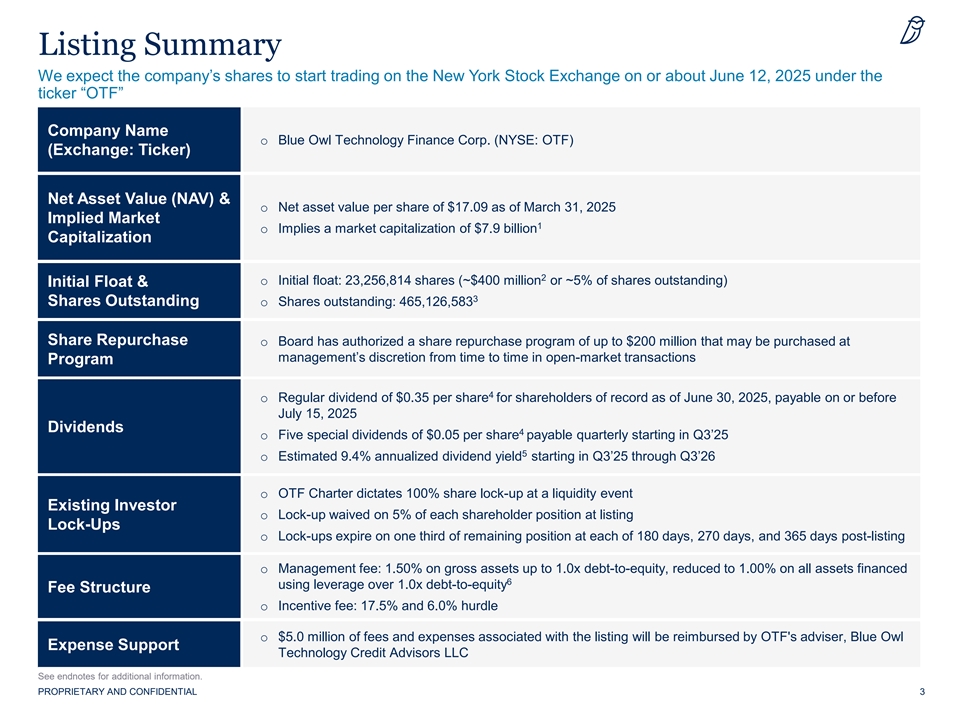
Listing Summary We expect the company’s shares to start trading on the New York Stock Exchange on or about June 12, 2025 under the ticker “OTF” Company Name o Blue Owl Technology Finance Corp. (NYSE: OTF) (Exchange: Ticker) Net Asset Value (NAV) & o Net asset value per share of $17.09 as of March 31, 2025 Implied Market 1 o Implies a market capitalization of $7.9 billion Capitalization 2 o Initial float: 23,256,814 shares (~$400 million or ~5% of shares outstanding) Initial Float & 3 Shares Outstanding o Shares outstanding: 465,126,583 Share Repurchase o Board has authorized a share repurchase program of up to $200 million that may be purchased at management’s discretion from time to time in open-market transactions Program 4 o Regular dividend of $0.35 per share for shareholders of record as of June 30, 2025, payable on or before July 15, 2025 Dividends 4 o Five special dividends of $0.05 per share payable quarterly starting in Q3’25 5 o Estimated 9.4% annualized dividend yield starting in Q3’25 through Q3’26 o OTF Charter dictates 100% share lock-up at a liquidity event Existing Investor o Lock-up waived on 5% of each shareholder position at listing Lock-Ups o Lock-ups expire on one third of remaining position at each of 180 days, 270 days, and 365 days post-listing o Management fee: 1.50% on gross assets up to 1.0x debt-to-equity, reduced to 1.00% on all assets financed 6 using leverage over 1.0x debt-to-equity Fee Structure o Incentive fee: 17.5% and 6.0% hurdle o $5.0 million of fees and expenses associated with the listing will be reimbursed by OTF's adviser, Blue Owl Expense Support Technology Credit Advisors LLC See endnotes for additional information. PROPRIETARY AND CONFIDENTIAL 3
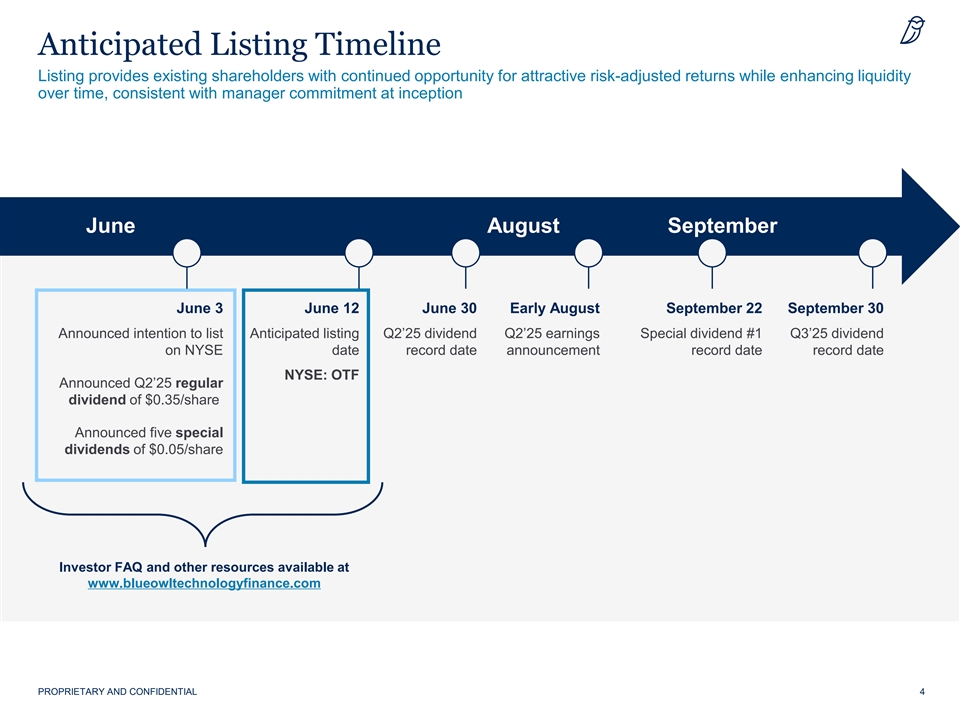
Anticipated Listing Timeline Listing provides existing shareholders with continued opportunity for attractive risk-adjusted returns while enhancing liquidity over time, consistent with manager commitment at inception June August September June 3 June 12 June 30 Early August September 22 September 30 Announced intention to list Anticipated listing Q2’25 dividend Q2’25 earnings Special dividend #1 Q3’25 dividend on NYSE date record date announcement record date record date NYSE: OTF Announced Q2’25 regular dividend of $0.35/share Announced five special dividends of $0.05/share Investor FAQ and other resources available at www.blueowltechnologyfinance.com PROPRIETARY AND CONFIDENTIAL 4
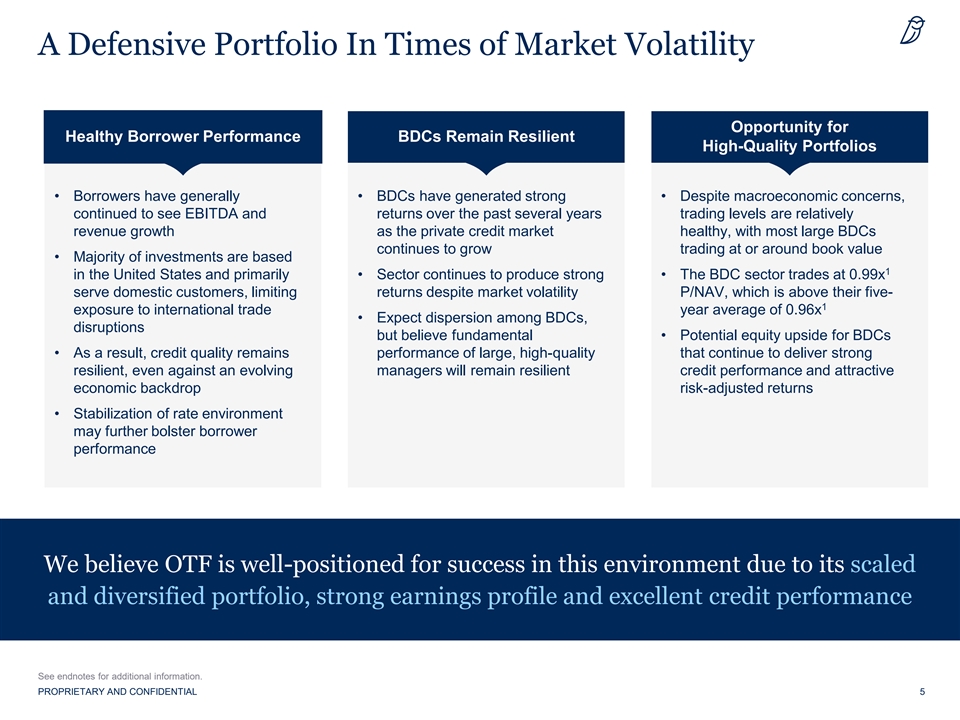
A Defensive Portfolio In Times of Market Volatility Opportunity for Healthy Borrower Performance BDCs Remain Resilient High-Quality Portfolios • Borrowers have generally • BDCs have generated strong • Despite macroeconomic concerns, continued to see EBITDA and returns over the past several years trading levels are relatively revenue growth as the private credit market healthy, with most large BDCs continues to grow trading at or around book value • Majority of investments are based 1 in the United States and primarily • Sector continues to produce strong • The BDC sector trades at 0.99x serve domestic customers, limiting returns despite market volatility P/NAV, which is above their five- 1 exposure to international trade year average of 0.96x • Expect dispersion among BDCs, disruptions but believe fundamental • Potential equity upside for BDCs • As a result, credit quality remains performance of large, high-quality that continue to deliver strong resilient, even against an evolving managers will remain resilient credit performance and attractive economic backdrop risk-adjusted returns • Stabilization of rate environment may further bolster borrower performance We believe OTF is well-positioned for success in this environment due to its scaled and diversified portfolio, strong earnings profile and excellent credit performance See endnotes for additional information. PROPRIETARY AND CONFIDENTIAL 5
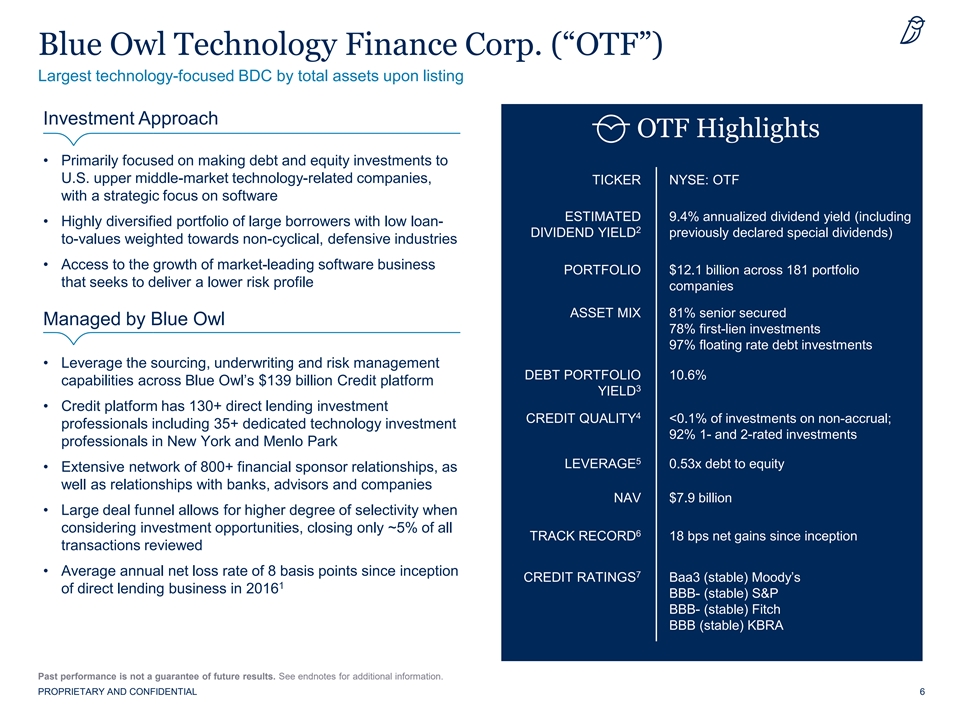
Blue Owl Technology Finance Corp. (“OTF”) Largest technology-focused BDC by total assets upon listing Investment Approach OTF Highlights • Primarily focused on making debt and equity investments to U.S. upper middle-market technology-related companies, TICKER NYSE: OTF with a strategic focus on software ESTIMATED 9.4% annualized dividend yield (including • Highly diversified portfolio of large borrowers with low loan- 2 DIVIDEND YIELD previously declared special dividends) to-values weighted towards non-cyclical, defensive industries • Access to the growth of market-leading software business PORTFOLIO $12.1 billion across 181 portfolio that seeks to deliver a lower risk profile companies ASSET MIX 81% senior secured Managed by Blue Owl 78% first-lien investments 97% floating rate debt investments • Leverage the sourcing, underwriting and risk management DEBT PORTFOLIO 10.6% capabilities across Blue Owl’s $139 billion Credit platform 3 YIELD • Credit platform has 130+ direct lending investment 4 CREDIT QUALITY <0.1% of investments on non-accrual; professionals including 35+ dedicated technology investment 92% 1- and 2-rated investments professionals in New York and Menlo Park 5 LEVERAGE 0.53x debt to equity • Extensive network of 800+ financial sponsor relationships, as well as relationships with banks, advisors and companies NAV $7.9 billion • Large deal funnel allows for higher degree of selectivity when considering investment opportunities, closing only ~5% of all 6 TRACK RECORD 18 bps net gains since inception transactions reviewed • Average annual net loss rate of 8 basis points since inception 7 CREDIT RATINGS Baa3 (stable) Moody’s 1 of direct lending business in 2016 BBB- (stable) S&P BBB- (stable) Fitch BBB (stable) KBRA Past performance is not a guarantee of future results. See endnotes for additional information. PROPRIETARY AND CONFIDENTIAL 6
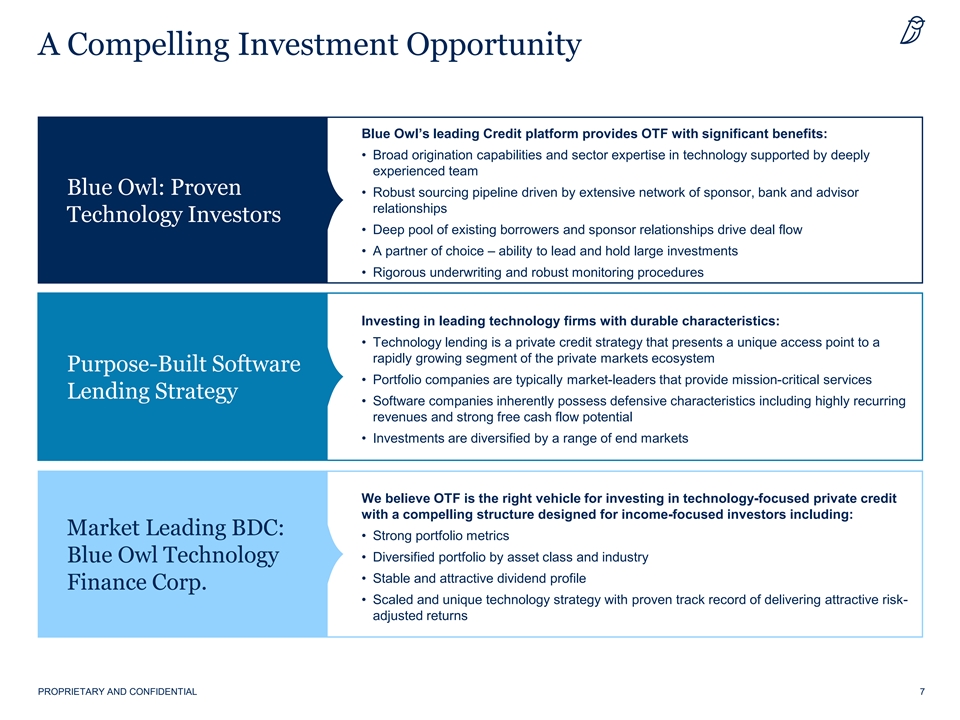
A Compelling Investment Opportunity Blue Owl’s leading Credit platform provides OTF with significant benefits: • Broad origination capabilities and sector expertise in technology supported by deeply experienced team Blue Owl: Proven • Robust sourcing pipeline driven by extensive network of sponsor, bank and advisor relationships Technology Investors • Deep pool of existing borrowers and sponsor relationships drive deal flow • A partner of choice – ability to lead and hold large investments • Rigorous underwriting and robust monitoring procedures Investing in leading technology firms with durable characteristics: • Technology lending is a private credit strategy that presents a unique access point to a rapidly growing segment of the private markets ecosystem Purpose-Built Software • Portfolio companies are typically market-leaders that provide mission-critical services Lending Strategy • Software companies inherently possess defensive characteristics including highly recurring revenues and strong free cash flow potential • Investments are diversified by a range of end markets We believe OTF is the right vehicle for investing in technology-focused private credit with a compelling structure designed for income-focused investors including: Market Leading BDC: • Strong portfolio metrics • Diversified portfolio by asset class and industry Blue Owl Technology • Stable and attractive dividend profile Finance Corp. • Scaled and unique technology strategy with proven track record of delivering attractive risk- adjusted returns PROPRIETARY AND CONFIDENTIAL 7
About Blue Owl, a Leading Global Alternative Asset Manager
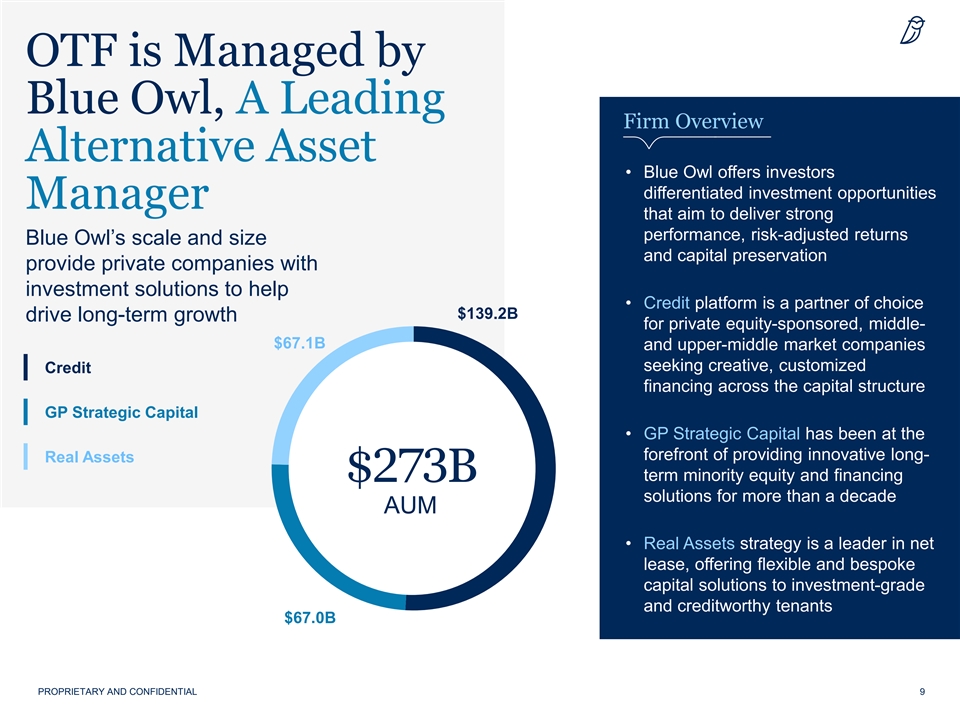
OTF is Managed by Blue Owl, A Leading Firm Overview Alternative Asset • Blue Owl offers investors differentiated investment opportunities Manager that aim to deliver strong performance, risk-adjusted returns Blue Owl’s scale and size and capital preservation provide private companies with investment solutions to help • Credit platform is a partner of choice $139.2B drive long-term growth for private equity-sponsored, middle- $67.1B and upper-middle market companies seeking creative, customized Credit financing across the capital structure GP Strategic Capital • GP Strategic Capital has been at the forefront of providing innovative long- Real Assets term minority equity and financing $273B solutions for more than a decade AUM • Real Assets strategy is a leader in net lease, offering flexible and bespoke capital solutions to investment-grade and creditworthy tenants $67.0B PROPRIETARY AND CONFIDENTIAL 9
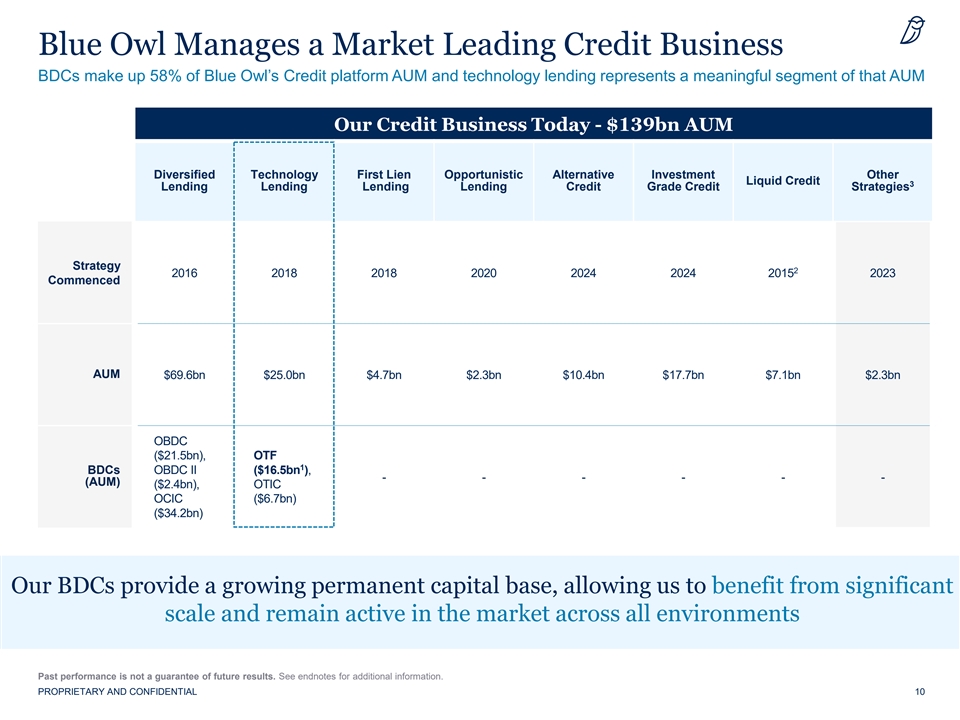
Blue Owl Manages a Market Leading Credit Business BDCs make up 58% of Blue Owl’s Credit platform AUM and technology lending represents a meaningful segment of that AUM Our Credit Business Today - $139bn AUM Diversified Technology First Lien Opportunistic Alternative Investment Other Liquid Credit 3 Lending Lending Lending Lending Credit Grade Credit Strategies Strategy 2 2016 2018 2018 2020 2024 2024 2015 2023 Commenced AUM $69.6bn $25.0bn $4.7bn $2.3bn $10.4bn $17.7bn $7.1bn $2.3bn OBDC ($21.5bn), OTF 1 BDCs OBDC II ($16.5bn ), - - - - - - (AUM) ($2.4bn), OTIC OCIC ($6.7bn) ($34.2bn) Our BDCs provide a growing permanent capital base, allowing us to benefit from significant scale and remain active in the market across all environments Past performance is not a guarantee of future results. See endnotes for additional information. PROPRIETARY AND CONFIDENTIAL 10
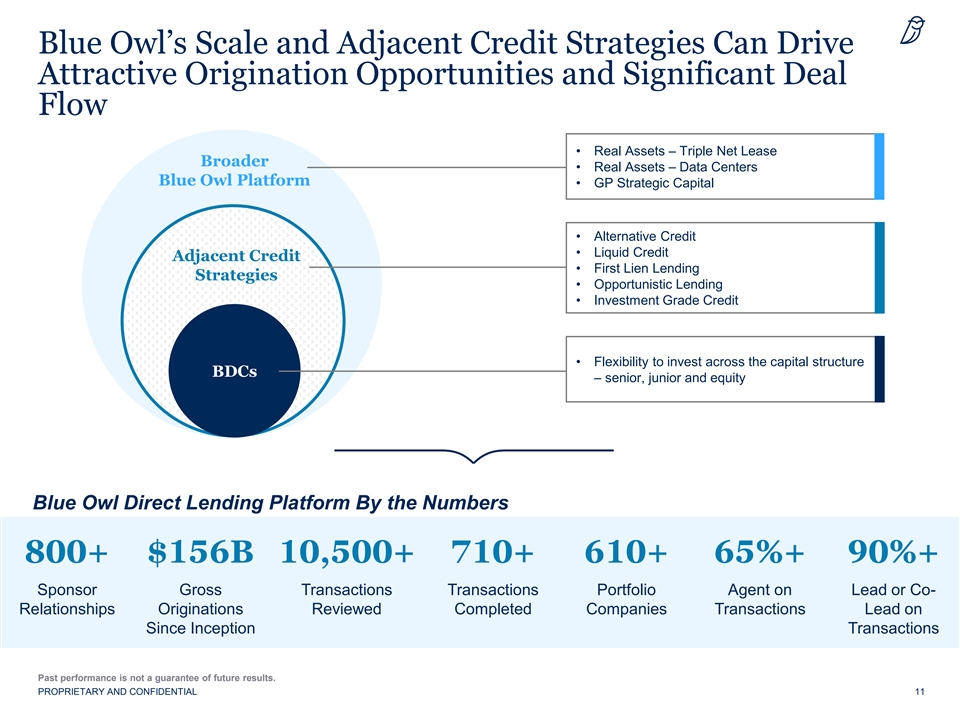
Blue Owl’s Scale and Adjacent Credit Strategies Can Drive Attractive Origination Opportunities and Significant Deal Flow • Real Assets – Triple Net Lease Broader • Real Assets – Data Centers Blue Owl Platform • GP Strategic Capital • Alternative Credit • Liquid Credit Adjacent Credit • First Lien Lending Strategies • Opportunistic Lending • Investment Grade Credit • Flexibility to invest across the capital structure BDCs – senior, junior and equity Blue Owl Direct Lending Platform By the Numbers 800+ $156B 10,500+ 710+ 610+ 65%+ 90%+ Sponsor Gross Transactions Transactions Portfolio Agent on Lead or Co- Relationships Originations Reviewed Completed Companies Transactions Lead on Since Inception Transactions Past performance is not a guarantee of future results. PROPRIETARY AND CONFIDENTIAL 11
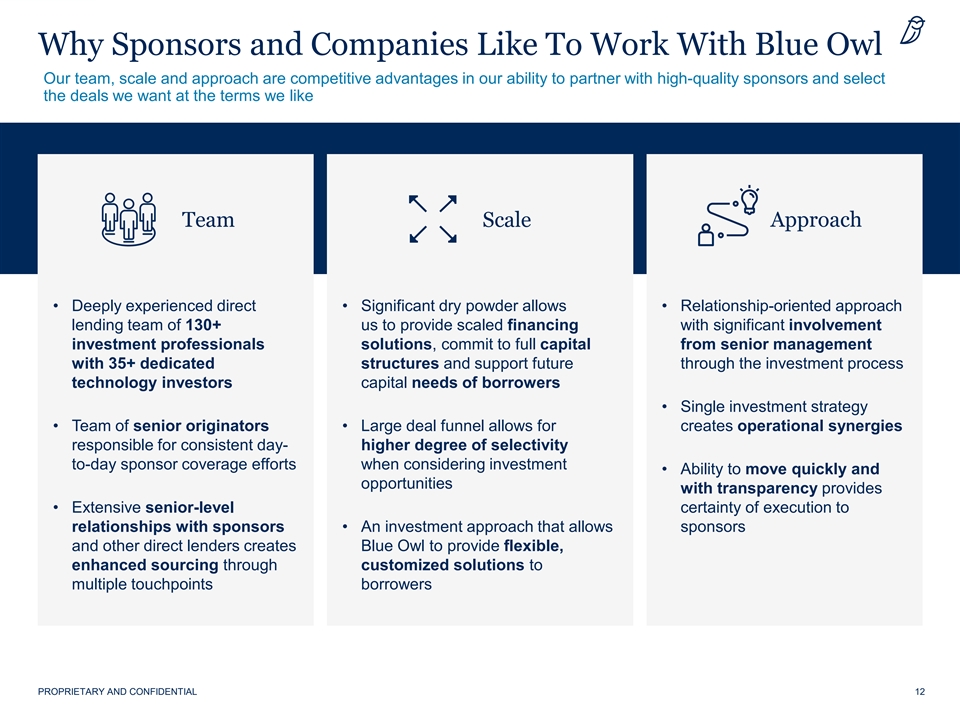
Why Sponsors and Companies Like To Work With Blue Owl Our team, scale and approach are competitive advantages in our ability to partner with high-quality sponsors and select the deals we want at the terms we like Why do sponsors like working with Blue Owl? Team Team Team Scale Approach • Deeply experienced direct • Significant dry powder allows • Relationship-oriented approach lending team of 130+ us to provide scaled financing with significant involvement investment professionals solutions, commit to full capital from senior management with 35+ dedicated structures and support future through the investment process technology investors capital needs of borrowers • Single investment strategy • Team of senior originators • Large deal funnel allows for creates operational synergies responsible for consistent day- higher degree of selectivity to-day sponsor coverage efforts when considering investment • Ability to move quickly and opportunities with transparency provides • Extensive senior-level certainty of execution to relationships with sponsors • An investment approach that allows sponsors and other direct lenders creates Blue Owl to provide flexible, “Sponsor Backing Helps Borrowers Better enhanced sourcing through customized solutions to Robert Dodd Weather Tough Macro Periods.” multiple touchpoints borrowers PROPRIETARY AND CONFIDENTIAL 12

Unique and Market-Leading Technology Strategy
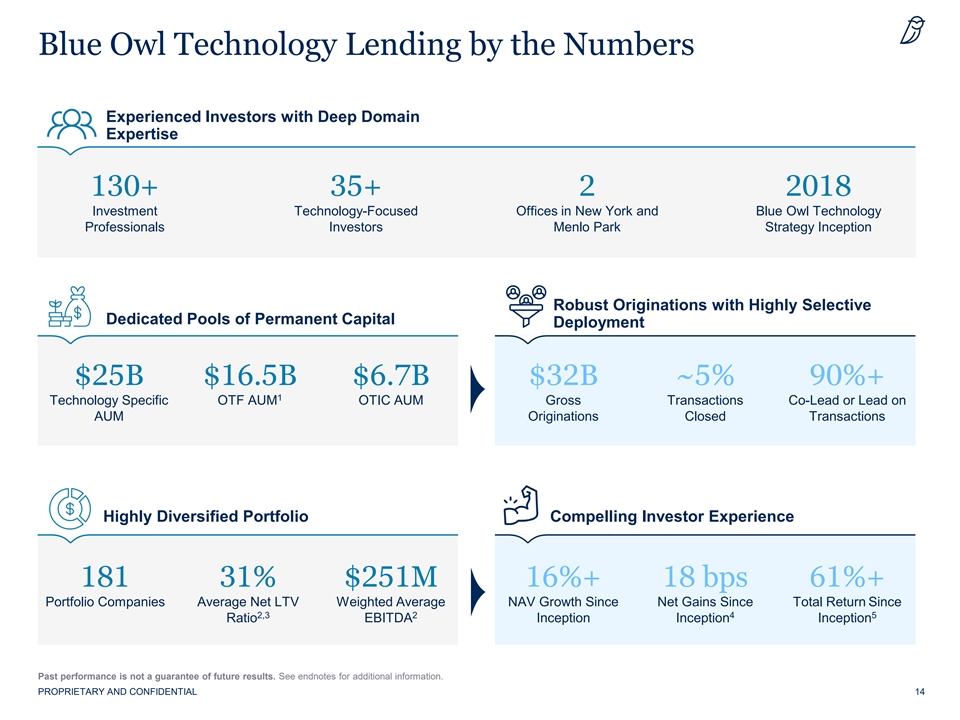
Blue Owl Technology Lending by the Numbers Experienced Investors with Deep Domain Expertise 130+ 35+ 2 2018 Investment Technology-Focused Offices in New York and Blue Owl Technology Professionals Investors Menlo Park Strategy Inception Robust Originations with Highly Selective Dedicated Pools of Permanent Capital Deployment $25B $16.5B $6.7B $32B ~5% 90%+ 1 Technology Specific OTF AUM OTIC AUM Gross Transactions Co-Lead or Lead on AUM Originations Closed Transactions Highly Diversified Portfolio Compelling Investor Experience 181 31% $251M 16%+ 18 bps 61%+ Portfolio Companies Average Net LTV Weighted Average NAV Growth Since Net Gains Since Total Return Since 2,3 2 4 5 Ratio EBITDA Inception Inception Inception Past performance is not a guarantee of future results. See endnotes for additional information. PROPRIETARY AND CONFIDENTIAL 14
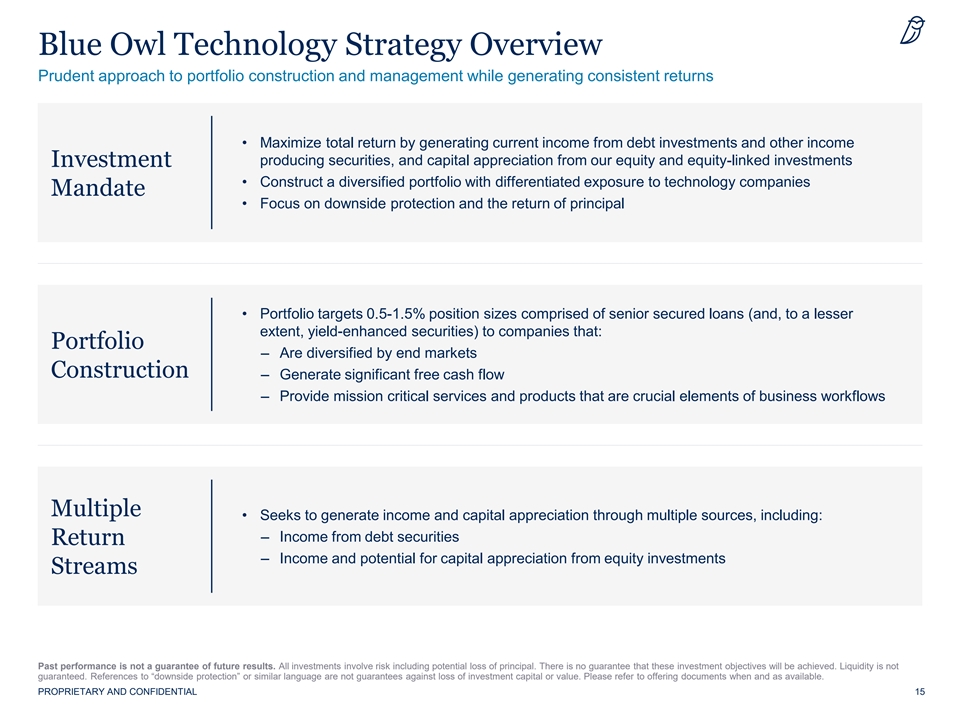
Blue Owl Technology Strategy Overview Prudent approach to portfolio construction and management while generating consistent returns • Maximize total return by generating current income from debt investments and other income producing securities, and capital appreciation from our equity and equity-linked investments Investment • Construct a diversified portfolio with differentiated exposure to technology companies Mandate • Focus on downside protection and the return of principal • Portfolio targets 0.5-1.5% position sizes comprised of senior secured loans (and, to a lesser extent, yield-enhanced securities) to companies that: Portfolio – Are diversified by end markets Construction – Generate significant free cash flow – Provide mission critical services and products that are crucial elements of business workflows Multiple • Seeks to generate income and capital appreciation through multiple sources, including: – Income from debt securities Return – Income and potential for capital appreciation from equity investments Streams Past performance is not a guarantee of future results. All investments involve risk including potential loss of principal. There is no guarantee that these investment objectives will be achieved. Liquidity is not guaranteed. References to “downside protection” or similar language are not guarantees against loss of investment capital or value. Please refer to offering documents when and as available. PROPRIETARY AND CONFIDENTIAL 15
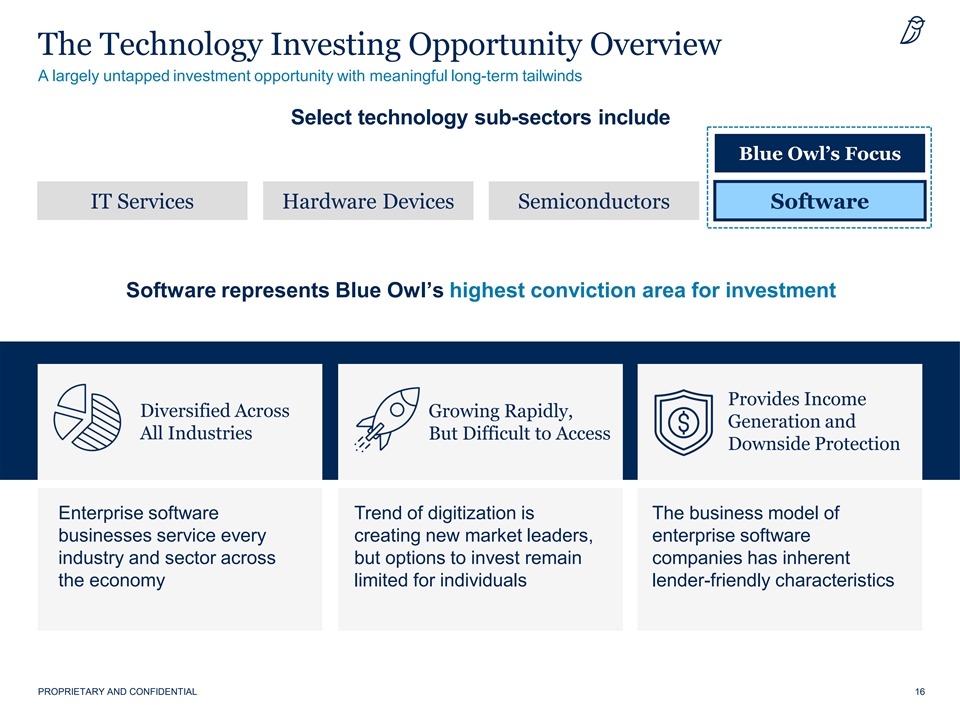
The Technology Investing Opportunity Overview A largely untapped investment opportunity with meaningful long-term tailwinds Select technology sub-sectors include Blue Owl’s Focus IT Services Hardware Devices Semiconductors Software Software represents Blue Owl’s highest conviction area for investment Provides Income Diversified Across Growing Rapidly, Generation and All Industries But Difficult to Access Downside Protection Enterprise software Trend of digitization is The business model of businesses service every creating new market leaders, enterprise software industry and sector across but options to invest remain companies has inherent the economy limited for individuals lender-friendly characteristics PROPRIETARY AND CONFIDENTIAL 16
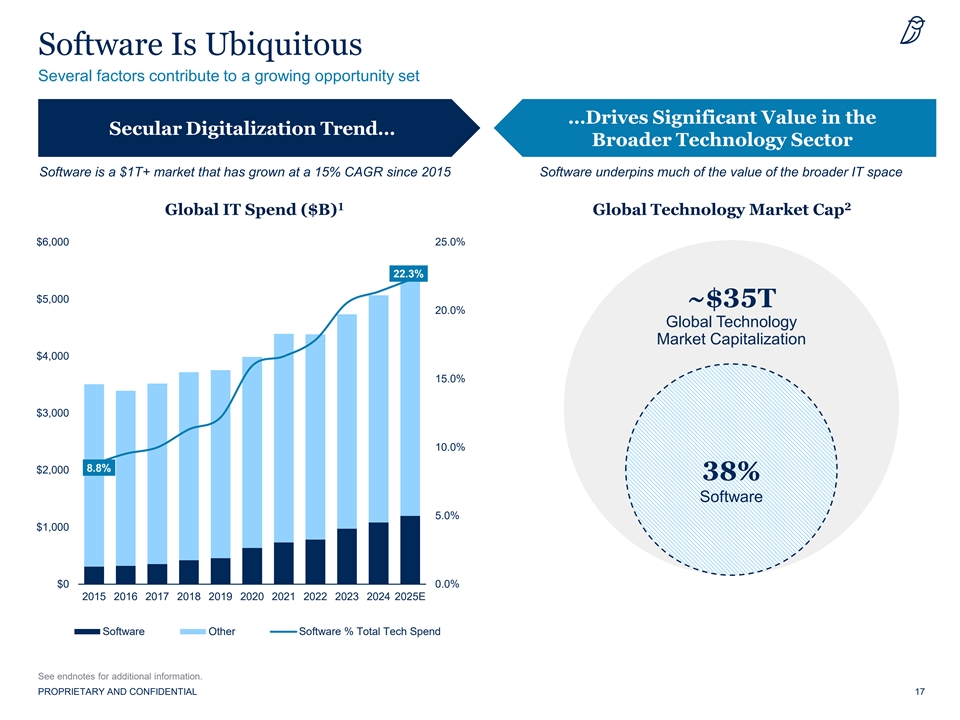
Software Is Ubiquitous Several factors contribute to a growing opportunity set …Drives Significant Value in the Secular Digitalization Trend… Broader Technology Sector Software is a $1T+ market that has grown at a 15% CAGR since 2015 Software underpins much of the value of the broader IT space 1 2 Global IT Spend ($B) Global Technology Market Cap $6,000 25.0% 22.3% $5,000 ~$35T 20.0% Global Technology Market Capitalization $4,000 15.0% $3,000 10.0% 8.8% $2,000 38% Software 5.0% $1,000 $0 0.0% 2015 2016 2017 2018 2019 2020 2021 2022 2023 2024 2025E Software Other Software % Total Tech Spend See endnotes for additional information. PROPRIETARY AND CONFIDENTIAL 17
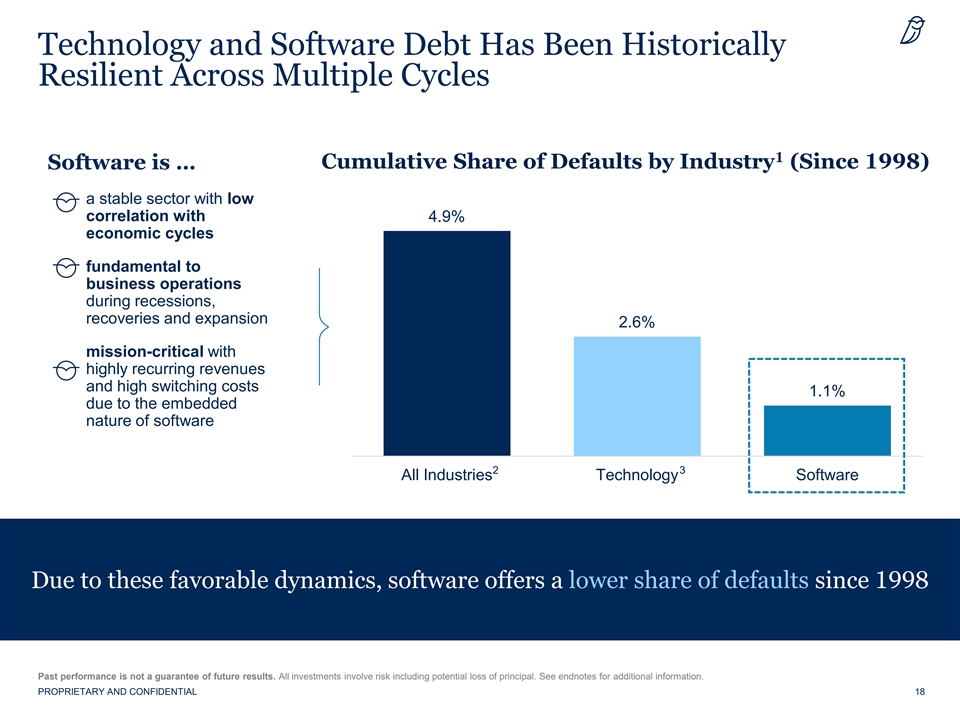
Technology and Software Debt Has Been Historically Resilient Across Multiple Cycles 1 Software is … Cumulative Share of Defaults by Industry (Since 1998) a stable sector with low correlation with 4.9% economic cycles fundamental to business operations during recessions, recoveries and expansion 2.6% mission-critical with highly recurring revenues and high switching costs 1.1% due to the embedded nature of software 2 3 All Industries Technology Software Due to these favorable dynamics, software offers a lower share of defaults since 1998 Past performance is not a guarantee of future results. All investments involve risk including potential loss of principal. See endnotes for additional information. PROPRIETARY AND CONFIDENTIAL 18
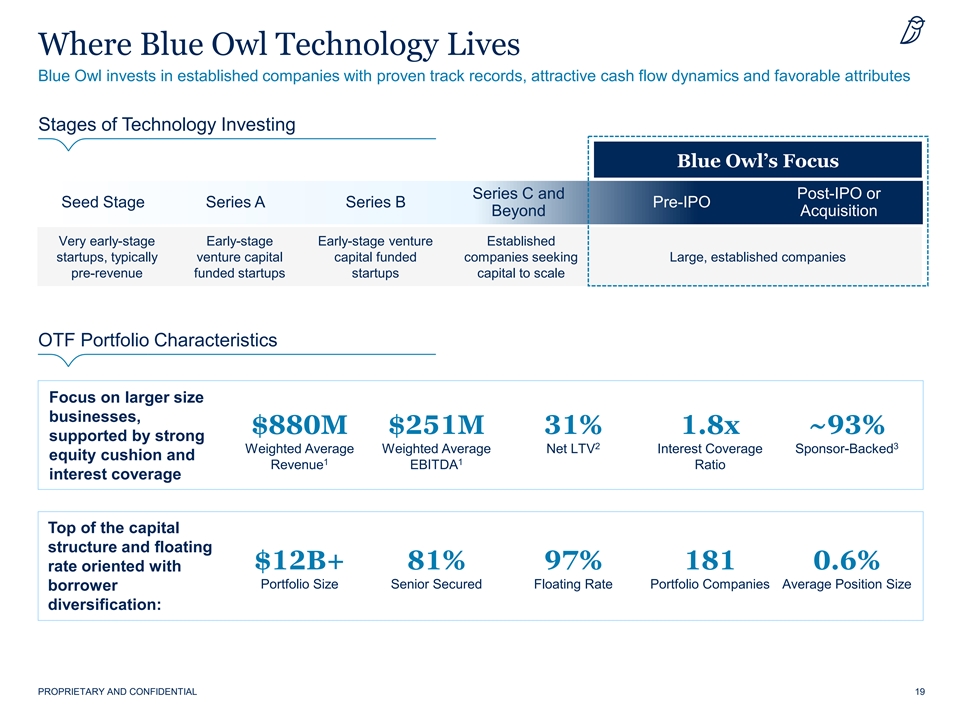
Where Blue Owl Technology Lives Blue Owl invests in established companies with proven track records, attractive cash flow dynamics and favorable attributes Stages of Technology Investing Blue Owl’s Focus Series C and Post-IPO or Series C and Post-IPO or Seed Stage Series A Series B Pre-IPO Seed Stage Series A Series B Pre-IPO Beyond Acquisition Beyond Acquisition Very early-stage Early-stage Early-stage venture Established startups, typically venture capital capital funded companies seeking Large, established companies pre-revenue funded startups startups capital to scale OTF Portfolio Characteristics Focus on larger size businesses, $880M $251M 31% 1.8x ~93% supported by strong 2 3 Weighted Average Weighted Average Net LTV Interest Coverage Sponsor-Backed equity cushion and 1 1 Revenue EBITDA Ratio interest coverage Top of the capital structure and floating $12B+ 81% 97% 181 0.6% rate oriented with Portfolio Size Senior Secured Floating Rate Portfolio Companies Average Position Size borrower diversification: PROPRIETARY AND CONFIDENTIAL 19
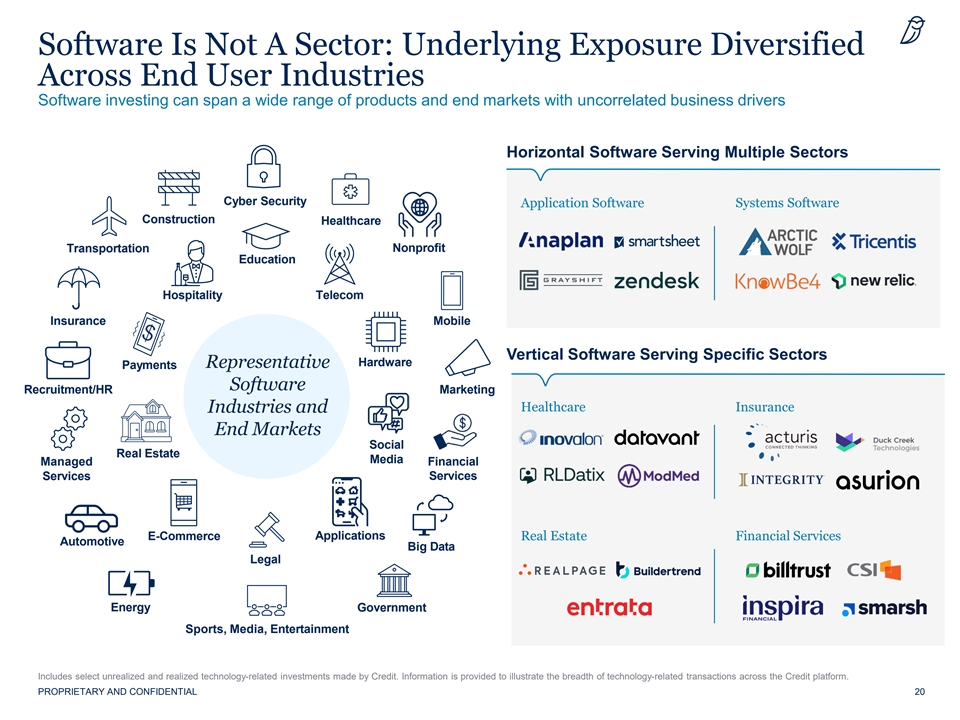
Software Is Not A Sector: Underlying Exposure Diversified Across End User Industries Software investing can span a wide range of products and end markets with uncorrelated business drivers Horizontal Software Serving Multiple Sectors Cyber Security Application Software Systems Software Construction Healthcare Nonprofit Transportation Education Hospitality Telecom Insurance Mobile Vertical Software Serving Specific Sectors Hardware Representative Payments Software Recruitment/HR Marketing Healthcare Insurance Industries and End Markets Social Real Estate Media Managed Financial Services Services E-Commerce Applications Real Estate Financial Services Automotive Big Data Legal Energy Government Sports, Media, Entertainment Includes select unrealized and realized technology-related investments made by Credit. Information is provided to illustrate the breadth of technology-related transactions across the Credit platform. PROPRIETARY AND CONFIDENTIAL 20
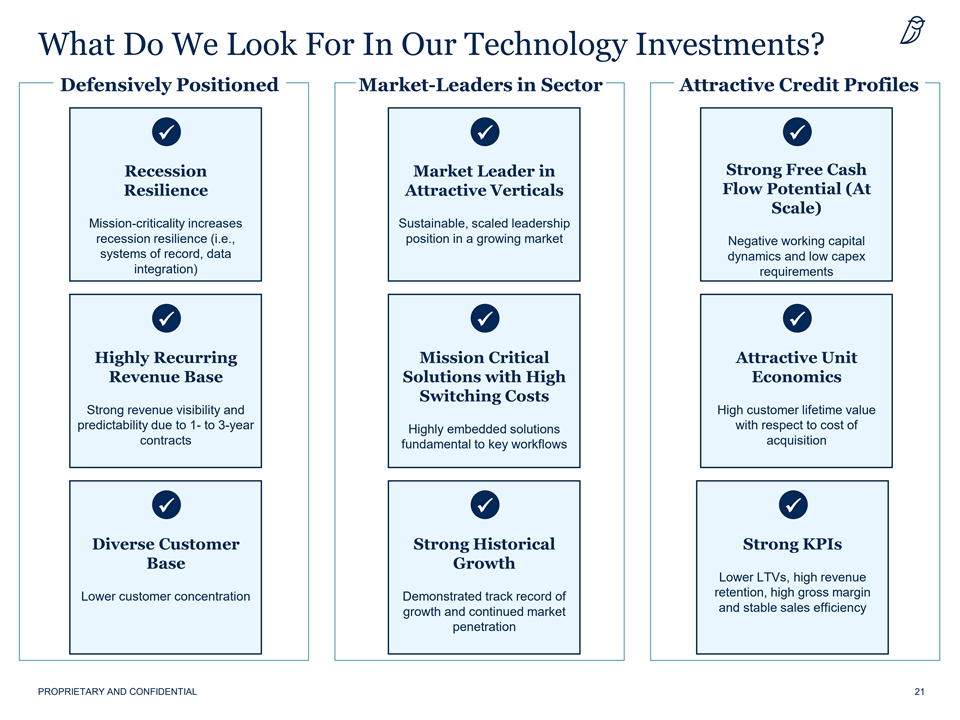
What Do We Look For In Our Technology Investments? Defensively Positioned Market-Leaders in Sector Attractive Credit Profiles üüü Strong Free Cash Recession Market Leader in Flow Potential (At Resilience Attractive Verticals Scale) Mission-criticality increases Sustainable, scaled leadership recession resilience (i.e., position in a growing market Negative working capital systems of record, data dynamics and low capex integration) requirements üüü Highly Recurring Mission Critical Attractive Unit Revenue Base Solutions with High Economics Switching Costs Strong revenue visibility and High customer lifetime value predictability due to 1- to 3-year with respect to cost of Highly embedded solutions contracts acquisition fundamental to key workflows üüü Diverse Customer Strong Historical Strong KPIs Base Growth Lower LTVs, high revenue retention, high gross margin Lower customer concentration Demonstrated track record of and stable sales efficiency growth and continued market penetration PROPRIETARY AND CONFIDENTIAL 21
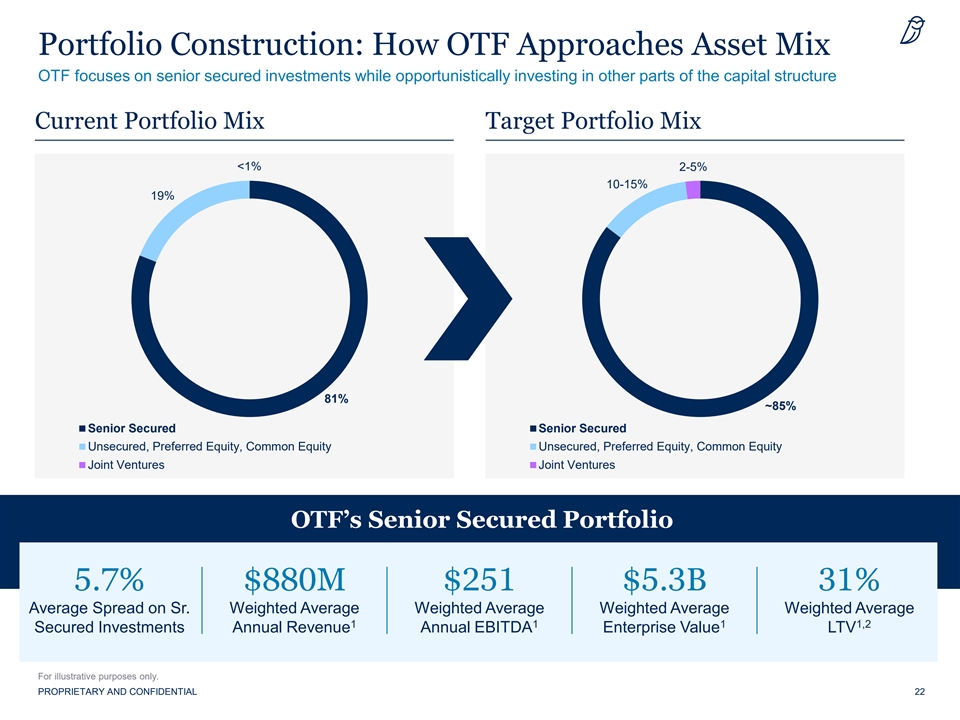
Portfolio Construction: How OTF Approaches Asset Mix OTF focuses on senior secured investments while opportunistically investing in other parts of the capital structure Current Portfolio Mix Target Portfolio Mix <1% 2-5% 10-15% 19% 81% ~85% Senior Secured Senior Secured Unsecured, Preferred Equity, Common Equity Unsecured, Preferred Equity, Common Equity Joint Ventures Joint Ventures OTF’s Senior Secured Portfolio 5.7% $880M $251 $5.3B 31% Average Spread on Sr. Weighted Average Weighted Average Weighted Average Weighted Average 1 1 1 1,2 Secured Investments Annual Revenue Annual EBITDA Enterprise Value LTV For illustrative purposes only. PROPRIETARY AND CONFIDENTIAL 22
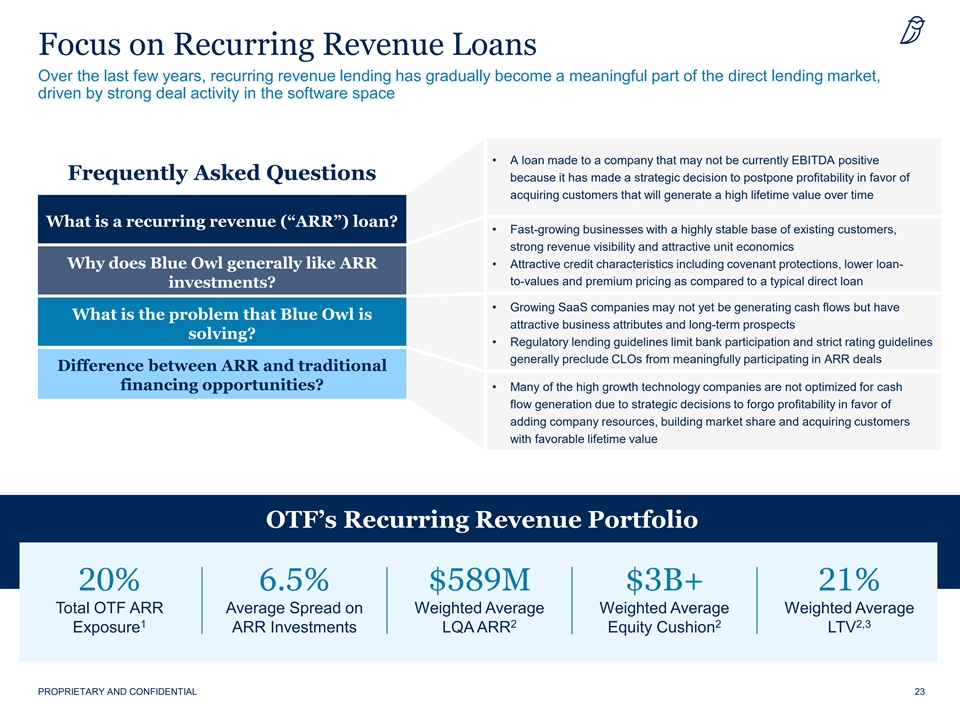
Focus on Recurring Revenue Loans Over the last few years, recurring revenue lending has gradually become a meaningful part of the direct lending market, driven by strong deal activity in the software space • A loan made to a company that may not be currently EBITDA positive Frequently Asked Questions because it has made a strategic decision to postpone profitability in favor of acquiring customers that will generate a high lifetime value over time What is a recurring revenue (“ARR”) loan? • Fast-growing businesses with a highly stable base of existing customers, strong revenue visibility and attractive unit economics • Attractive credit characteristics including covenant protections, lower loan- Why does Blue Owl generally like ARR to-values and premium pricing as compared to a typical direct loan investments? • Growing SaaS companies may not yet be generating cash flows but have What is the problem that Blue Owl is attractive business attributes and long-term prospects solving? • Regulatory lending guidelines limit bank participation and strict rating guidelines generally preclude CLOs from meaningfully participating in ARR deals Difference between ARR and traditional financing opportunities? • Many of the high growth technology companies are not optimized for cash flow generation due to strategic decisions to forgo profitability in favor of adding company resources, building market share and acquiring customers with favorable lifetime value OTF’s Recurring Revenue Portfolio 20% 6.5% $589M $3B+ 21% Total OTF ARR Average Spread on Weighted Average Weighted Average Weighted Average 1 2 2 2,3 Exposure ARR Investments LQA ARR Equity Cushion LTV PROPRIETARY AND CONFIDENTIAL 23
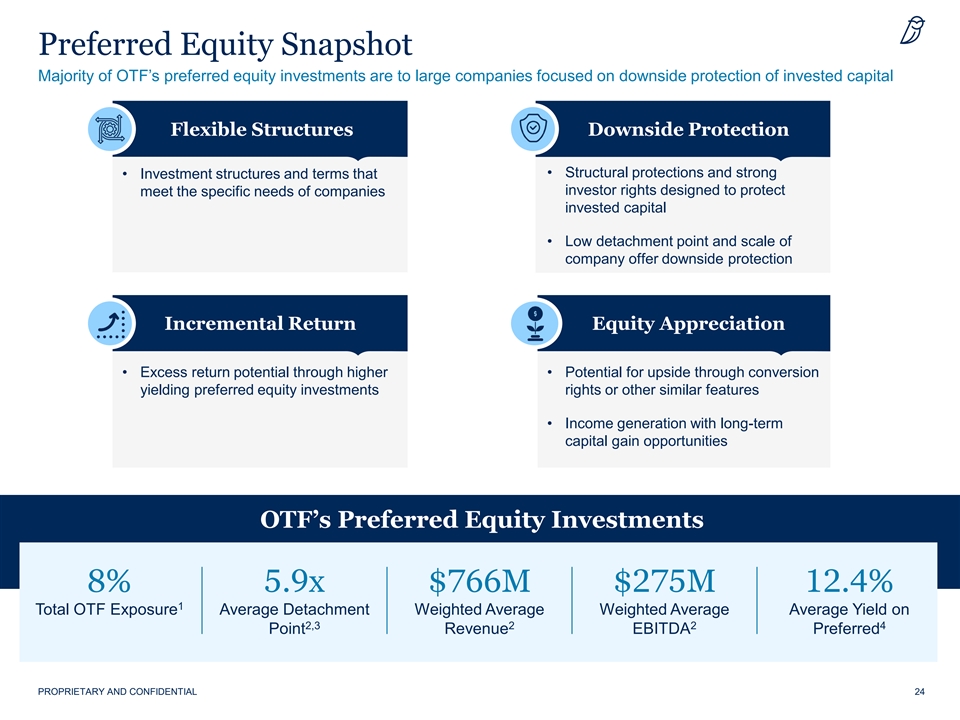
Preferred Equity Snapshot Majority of OTF’s preferred equity investments are to large companies focused on downside protection of invested capital F Fl lex exi ib bl le S e St tru ruc ct tu ures res Downside Protection • Structural protections and strong • Investment structures and terms that investor rights designed to protect meet the specific needs of companies invested capital • Low detachment point and scale of company offer downside protection Incremental Return Equity Appreciation • Excess return potential through higher • Potential for upside through conversion yielding preferred equity investments rights or other similar features • Income generation with long-term capital gain opportunities OTF’s Preferred Equity Investments 8% 5.9x $766M $275M 12.4% 1 Total OTF Exposure Average Detachment Weighted Average Weighted Average Average Yield on 2,3 2 2 4 Point Revenue EBITDA Preferred PROPRIETARY AND CONFIDENTIAL 24
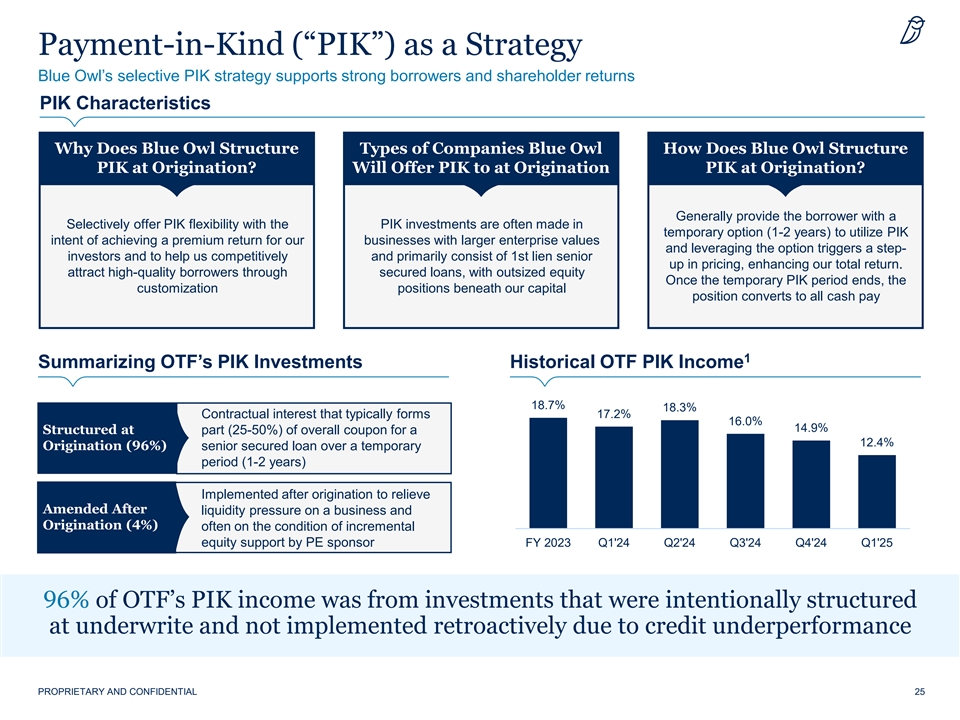
Payment-in-Kind (“PIK”) as a Strategy Blue Owl’s selective PIK strategy supports strong borrowers and shareholder returns PIK Characteristics Why Does Blue Owl Structure Types of Companies Blue Owl How Does Blue Owl Structure PIK at Origination? Will Offer PIK to at Origination PIK at Origination? Generally provide the borrower with a Selectively offer PIK flexibility with the PIK investments are often made in temporary option (1-2 years) to utilize PIK intent of achieving a premium return for our businesses with larger enterprise values and leveraging the option triggers a step- investors and to help us competitively and primarily consist of 1st lien senior up in pricing, enhancing our total return. attract high-quality borrowers through secured loans, with outsized equity Once the temporary PIK period ends, the customization positions beneath our capital position converts to all cash pay 1 Summarizing OTF’s PIK Investments Historical OTF PIK Income 18.7% 18.3% Contractual interest that typically forms 17.2% 16.0% 14.9% Structured at part (25-50%) of overall coupon for a 12.4% Origination (96%) senior secured loan over a temporary period (1-2 years) Implemented after origination to relieve Amended After liquidity pressure on a business and Origination (4%) often on the condition of incremental equity support by PE sponsor FY 2023 Q1'24 Q2'24 Q3'24 Q4'24 Q1'25 96% of OTF’s PIK income was from investments that were intentionally structured at underwrite and not implemented retroactively due to credit underperformance PROPRIETARY AND CONFIDENTIAL 25
A Leading Software BDC: Blue Owl Technology Finance Corp.
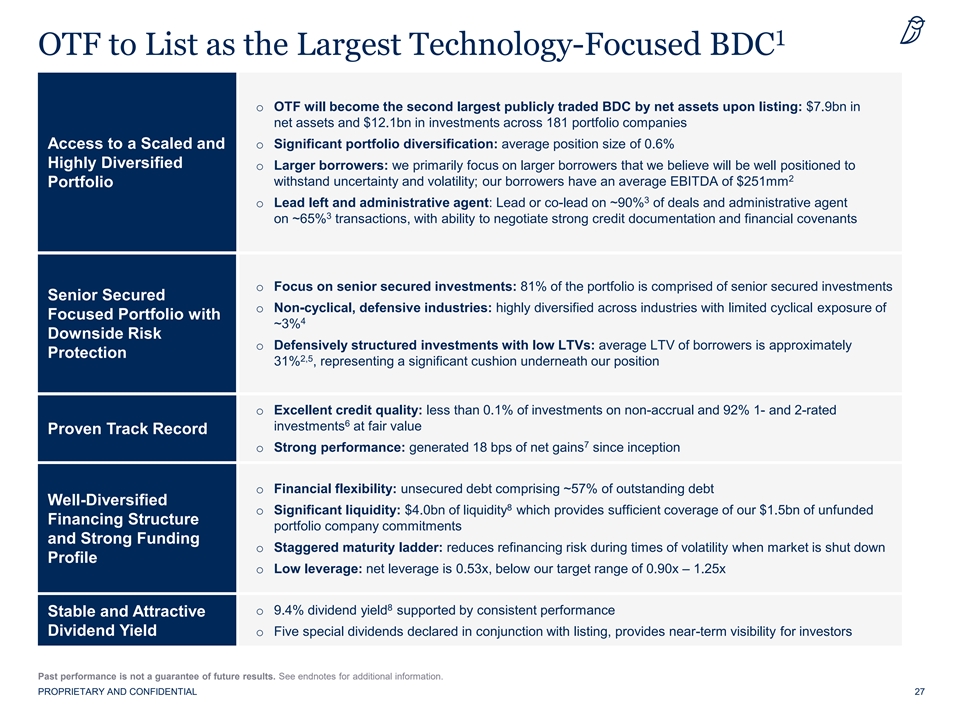
1 OTF to List as the Largest Technology-Focused BDC o OTF will become the second largest publicly traded BDC by net assets upon listing: $7.9bn in net assets and $12.1bn in investments across 181 portfolio companies o Significant portfolio diversification: average position size of 0.6% Access to a Scaled and Highly Diversified o Larger borrowers: we primarily focus on larger borrowers that we believe will be well positioned to 2 withstand uncertainty and volatility; our borrowers have an average EBITDA of $251mm Portfolio 3 o Lead left and administrative agent: Lead or co-lead on ~90% of deals and administrative agent 3 on ~65% transactions, with ability to negotiate strong credit documentation and financial covenants o Focus on senior secured investments: 81% of the portfolio is comprised of senior secured investments Senior Secured o Non-cyclical, defensive industries: highly diversified across industries with limited cyclical exposure of Focused Portfolio with 4 ~3% Downside Risk o Defensively structured investments with low LTVs: average LTV of borrowers is approximately Protection 2,5 31% , representing a significant cushion underneath our position o Excellent credit quality: less than 0.1% of investments on non-accrual and 92% 1- and 2-rated 6 investments at fair value Proven Track Record 7 o Strong performance: generated 18 bps of net gains since inception o Financial flexibility: unsecured debt comprising ~57% of outstanding debt Well-Diversified 8 o Significant liquidity: $4.0bn of liquidity which provides sufficient coverage of our $1.5bn of unfunded Financing Structure portfolio company commitments and Strong Funding o Staggered maturity ladder: reduces refinancing risk during times of volatility when market is shut down Profile o Low leverage: net leverage is 0.53x, below our target range of 0.90x – 1.25x 8 o 9.4% dividend yield supported by consistent performance Stable and Attractive Dividend Yield o Five special dividends declared in conjunction with listing, provides near-term visibility for investors Past performance is not a guarantee of future results. See endnotes for additional information. PROPRIETARY AND CONFIDENTIAL 27
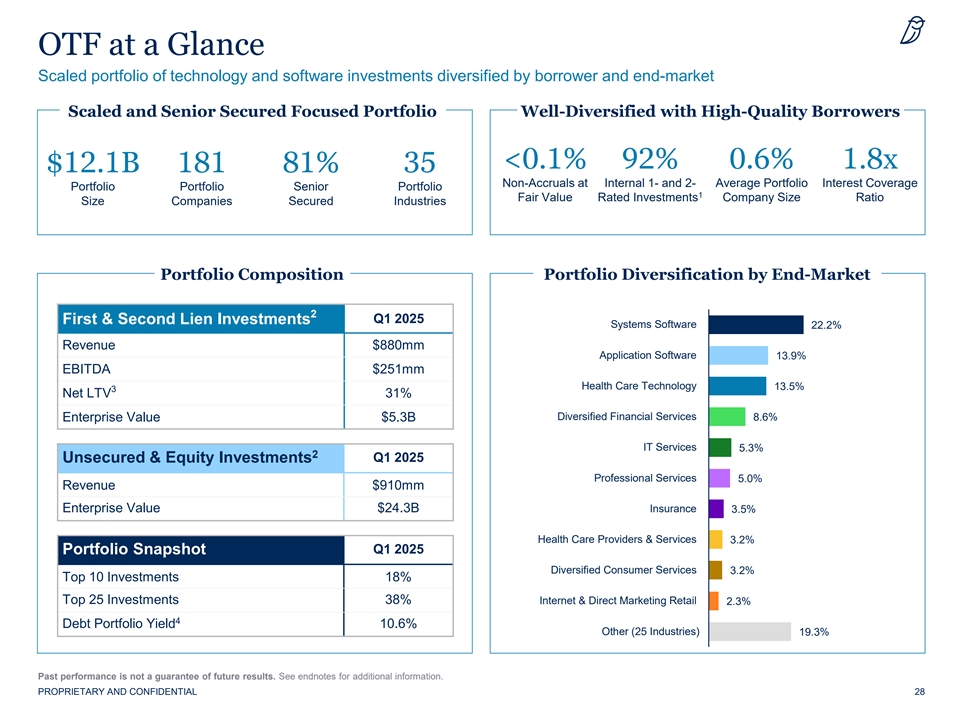
OTF at a Glance Scaled portfolio of technology and software investments diversified by borrower and end-market Scaled and Senior Secured Focused Portfolio Well-Diversified with High-Quality Borrowers <0.1% 92% 0.6% 1.8x $12.1B 181 81% 35 Non-Accruals at Internal 1- and 2- Average Portfolio Interest Coverage Portfolio Portfolio Senior Portfolio 1 Fair Value Rated Investments Company Size Ratio Size Companies Secured Industries Portfolio Composition Portfolio Diversification by End-Market 2 First & Second Lien Investments Q1 2025 Systems Software 22.2% Revenue $880mm Application Software 13.9% EBITDA $251mm Health Care Technology 13.5% 3 Net LTV 31% Diversified Financial Services Enterprise Value$5.3B 8.6% IT Services 5.3% 2 Unsecured & Equity Investments Q1 2025 Professional Services 5.0% Revenue $910mm Enterprise Value$24.3B Insurance 3.5% Health Care Providers & Services 3.2% Q1 2025 Portfolio Snapshot Diversified Consumer Services 3.2% Top 10 Investments 18% Top 25 Investments 38% Internet & Direct Marketing Retail 2.3% 4 Debt Portfolio Yield 10.6% Other (25 Industries) 19.3% Past performance is not a guarantee of future results. See endnotes for additional information. PROPRIETARY AND CONFIDENTIAL 28
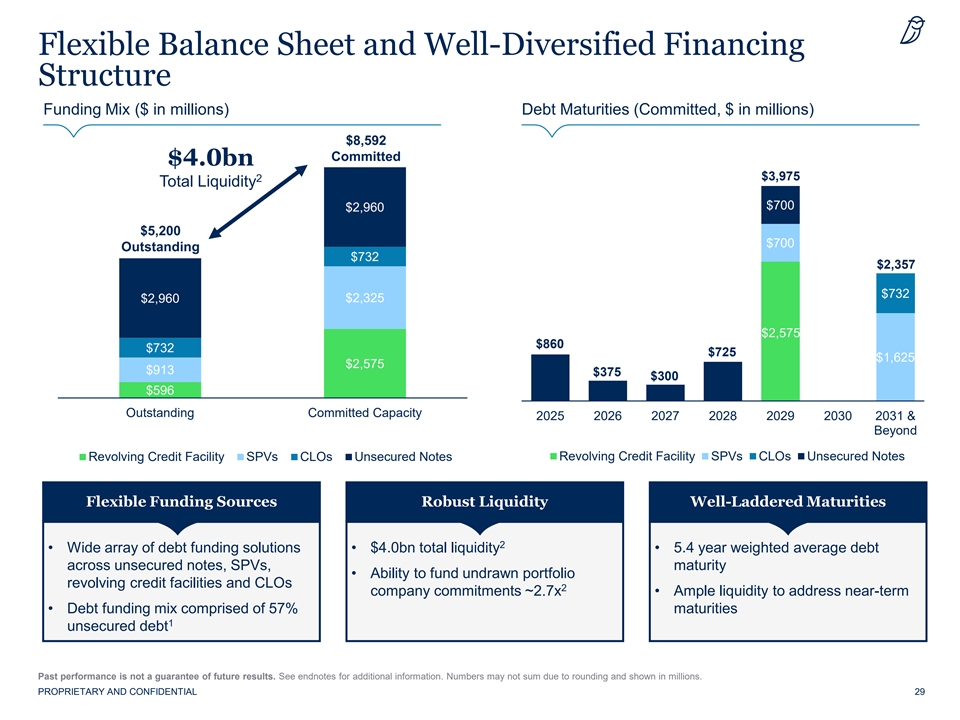
Flexible Balance Sheet and Well-Diversified Financing Structure Funding Mix ($ in millions) Debt Maturities (Committed, $ in millions) $8,592 Committed $4.0bn $3,975 2 Total Liquidity $700 $2,960 $5,200 $700 Outstanding $732 $2,357 $732 $2,960 $2,325 $2,575 $860 $732 $725 $1,625 $2,575 $913 $375 $300 $596 Outstanding Committed Capacity 2025 2026 2027 2028 2029 2030 2031 & Beyond Revolving Credit Facility SPVs CLOs Unsecured Notes Revolving Credit Facility SPVs CLOs Unsecured Notes Flexible Funding Sources Robust Liquidity Well-Laddered Maturities 2 • Wide array of debt funding solutions • $4.0bn total liquidity • 5.4 year weighted average debt across unsecured notes, SPVs, maturity • Ability to fund undrawn portfolio revolving credit facilities and CLOs 2 company commitments ~2.7x • Ample liquidity to address near-term • Debt funding mix comprised of 57% maturities 1 unsecured debt Past performance is not a guarantee of future results. See endnotes for additional information. Numbers may not sum due to rounding and shown in millions. PROPRIETARY AND CONFIDENTIAL 29
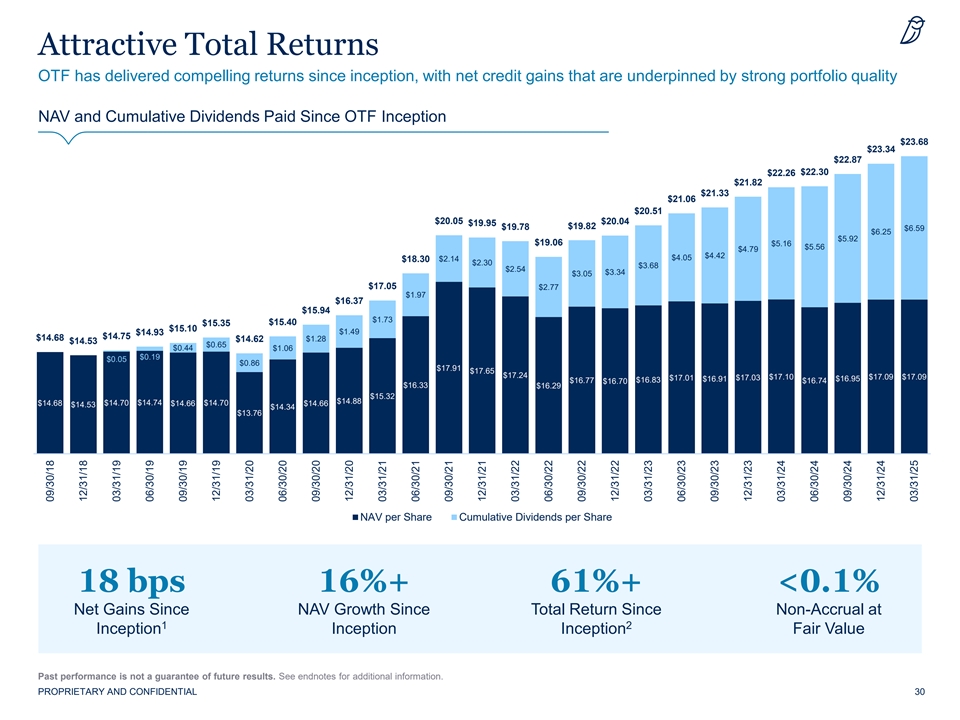
Attractive Total Returns OTF has delivered compelling returns since inception, with net credit gains that are underpinned by strong portfolio quality NAV and Cumulative Dividends Paid Since OTF Inception $23.68 $23.34 $22.87 $22.30 $22.26 $21.82 $21.33 $21.06 $20.51 $20.05 $20.04 $19.95 $19.82 $19.78 $6.59 $6.25 $5.92 $19.06 $5.16 $5.56 $4.79 $4.42 $4.05 $2.14 $18.30 $2.30 $3.68 $2.54 $3.34 $3.05 $17.05 $2.77 $1.97 $16.37 $15.94 $1.73 $15.40 $15.35 $15.10 $1.49 $14.93 $14.75 $14.68 $1.28 $14.62 $14.53 $0.65 $0.44 $1.06 $0.19 $0.00 $0.05 $0.86 $0.00 $17.91 $17.65 $17.24 $17.03 $17.10 $17.09 $17.09 $17.01 $16.91 $16.95 $16.83 $16.77 $16.70 $16.74 $16.33 $16.29 $15.32 $14.88 $14.70 $14.74 $14.70 $14.68 $14.66 $14.66 $14.53 $14.34 $13.76 NAV per Share Cumulative Dividends per Share 18 bps 16%+ 61%+ <0.1% Net Gains Since NAV Growth Since Total Return Since Non-Accrual at 1 2 Inception Inception Inception Fair Value Past performance is not a guarantee of future results. See endnotes for additional information. PROPRIETARY AND CONFIDENTIAL 30 09/30/18 12/31/18 03/31/19 06/30/19 09/30/19 12/31/19 03/31/20 06/30/20 09/30/20 12/31/20 03/31/21 06/30/21 09/30/21 12/31/21 03/31/22 06/30/22 09/30/22 12/31/22 03/31/23 06/30/23 09/30/23 12/31/23 03/31/24 06/30/24 09/30/24 12/31/24 03/31/25
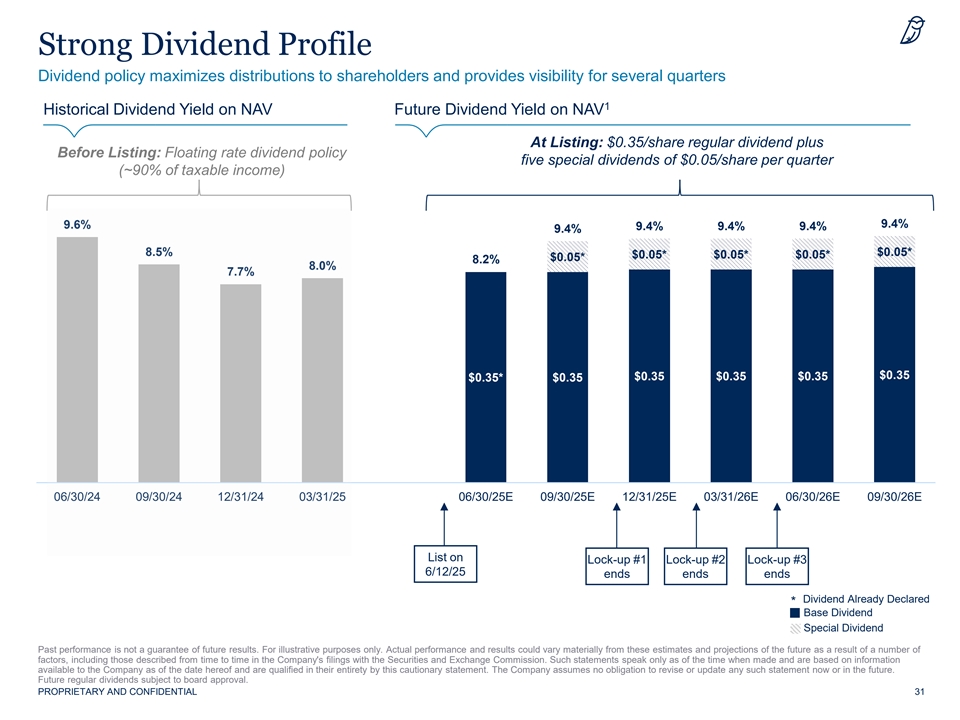
* Strong Dividend Profile Dividend policy maximizes distributions to shareholders and provides visibility for several quarters 1 Historical Dividend Yield on NAV Future Dividend Yield on NAV At Listing: $0.35/share regular dividend plus Before Listing: Floating rate dividend policy five special dividends of $0.05/share per quarter (~90% of taxable income) 9.4% 9.6% 9.4% 9.4% 9.4% 9.4% 8.5% $0.05* $0.05* $0.05* $0.05* $0.05* 8.2% 8.0% 7.7% $0.35 $0.35 $0.35 $0.35 $0.35* $0.35 06/30/24 09/30/24 12/31/24 03/31/25 06/30/25E 09/30/25E 12/31/25E 03/31/26E 06/30/26E 09/30/26E List on Lock-up #1 Lock-up #2 Lock-up #3 6/12/25 ends ends ends Dividend Already Declared * Base Dividend Special Dividend Past performance is not a guarantee of future results. For illustrative purposes only. Actual performance and results could vary materially from these estimates and projections of the future as a result of a number of factors, including those described from time to time in the Company's filings with the Securities and Exchange Commission. Such statements speak only as of the time when made and are based on information available to the Company as of the date hereof and are qualified in their entirety by this cautionary statement. The Company assumes no obligation to revise or update any such statement now or in the future. Future regular dividends subject to board approval. PROPRIETARY AND CONFIDENTIAL 31
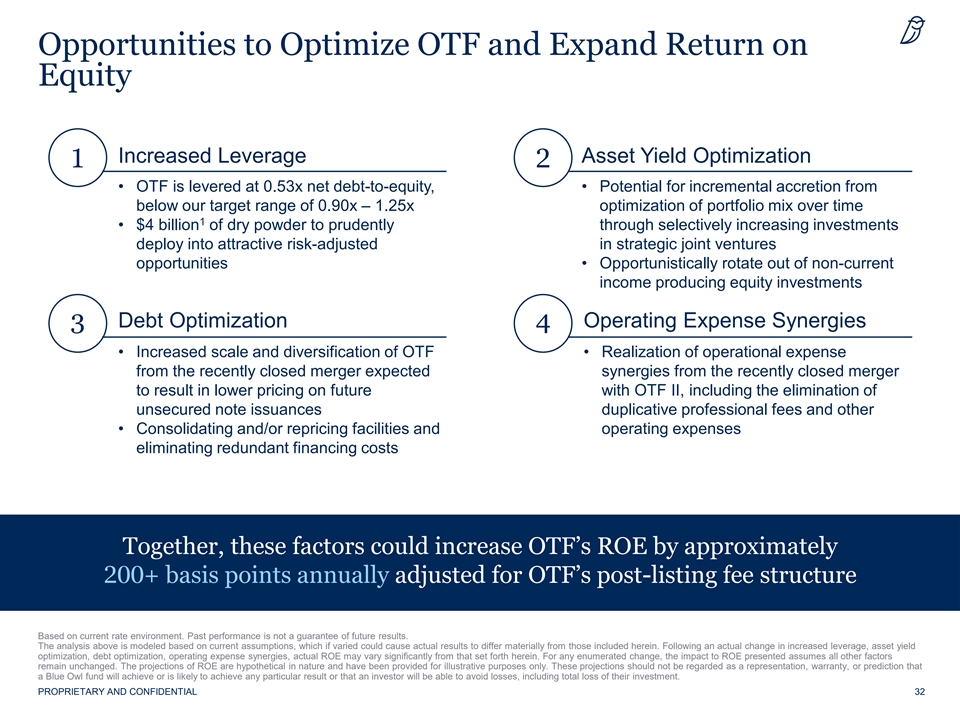
Opportunities to Optimize OTF and Expand Return on Equity Increased Leverage Asset Yield Optimization 1 2 • OTF is levered at 0.53x net debt-to-equity, • Potential for incremental accretion from below our target range of 0.90x – 1.25x optimization of portfolio mix over time 1 • $4 billion of dry powder to prudently through selectively increasing investments deploy into attractive risk-adjusted in strategic joint ventures opportunities • Opportunistically rotate out of non-current income producing equity investments Debt Optimization Operating Expense Synergies 3 4 • Increased scale and diversification of OTF • Realization of operational expense from the recently closed merger expected synergies from the recently closed merger to result in lower pricing on future with OTF II, including the elimination of unsecured note issuances duplicative professional fees and other • Consolidating and/or repricing facilities and operating expenses eliminating redundant financing costs Together, these factors could increase OTF’s ROE by approximately 200+ basis points annually adjusted for OTF’s post-listing fee structure Based on current rate environment. Past performance is not a guarantee of future results. The analysis above is modeled based on current assumptions, which if varied could cause actual results to differ materially from those included herein. Following an actual change in increased leverage, asset yield optimization, debt optimization, operating expense synergies, actual ROE may vary significantly from that set forth herein. For any enumerated change, the impact to ROE presented assumes all other factors remain unchanged. The projections of ROE are hypothetical in nature and have been provided for illustrative purposes only. These projections should not be regarded as a representation, warranty, or prediction that a Blue Owl fund will achieve or is likely to achieve any particular result or that an investor will be able to avoid losses, including total loss of their investment. PROPRIETARY AND CONFIDENTIAL 32
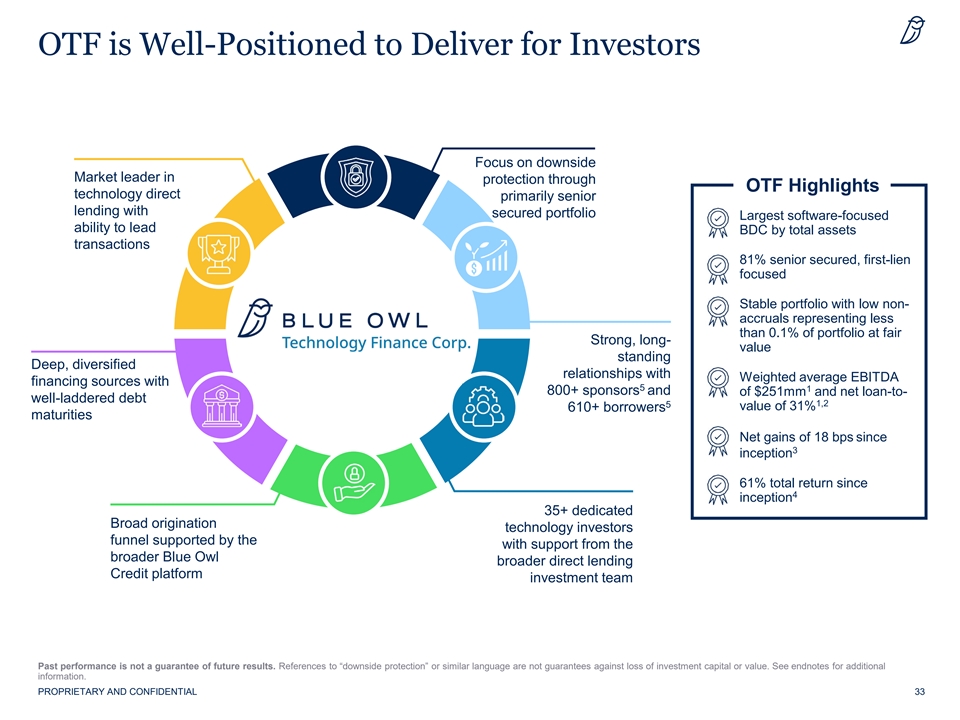
OTF is Well-Positioned to Deliver for Investors Focus on downside Market leader in protection through OTF Highlights technology direct primarily senior lending with secured portfolio Largest software-focused ability to lead BDC by total assets transactions 81% senior secured, first-lien focused Stable portfolio with low non- accruals representing less than 0.1% of portfolio at fair Strong, long- value standing Deep, diversified relationships with Weighted average EBITDA financing sources with 5 1 800+ sponsors and of $251mm and net loan-to- well-laddered debt 1,2 5 value of 31% 610+ borrowers maturities Net gains of 18 bps since 3 inception 61% total return since 4 inception 35+ dedicated Broad origination technology investors funnel supported by the with support from the broader Blue Owl broader direct lending Credit platform investment team Past performance is not a guarantee of future results. References to “downside protection” or similar language are not guarantees against loss of investment capital or value. See endnotes for additional information. PROPRIETARY AND CONFIDENTIAL 33

Appendix
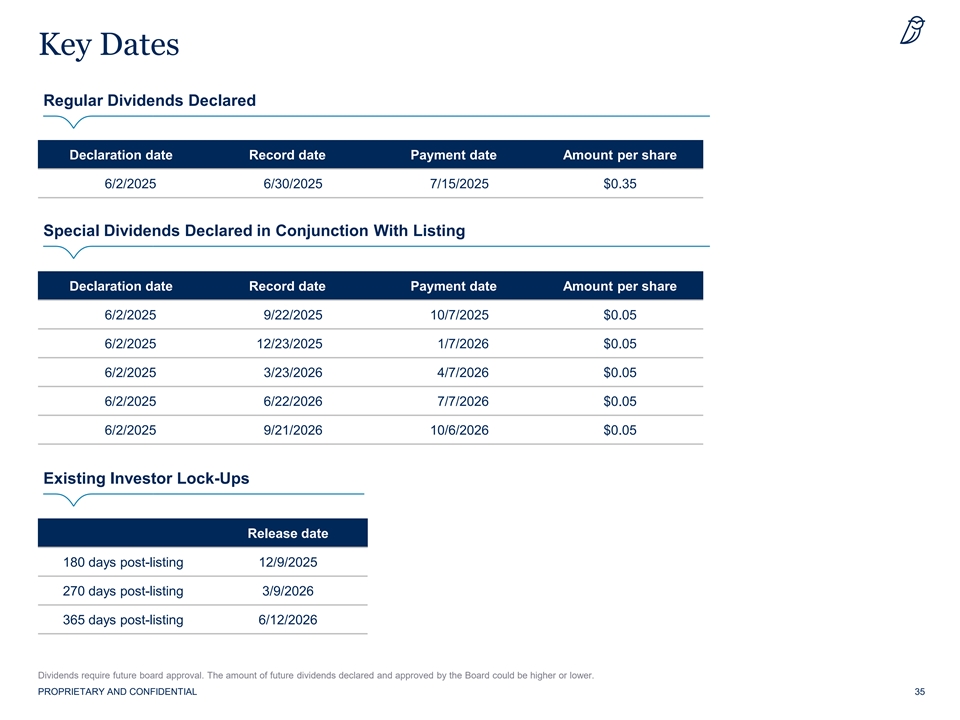
Key Dates Regular Dividends Declared Declaration date Record date Payment date Amount per share 6/2/2025 6/30/2025 7/15/2025 $0.35 Special Dividends Declared in Conjunction With Listing Declaration date Record date Payment date Amount per share 6/2/2025 9/22/2025 10/7/2025 $0.05 6/2/2025 12/23/2025 1/7/2026 $0.05 6/2/2025 3/23/2026 4/7/2026 $0.05 6/2/2025 6/22/2026 7/7/2026 $0.05 6/2/2025 9/21/2026 10/6/2026 $0.05 Existing Investor Lock-Ups Release date 180 days post-listing 12/9/2025 270 days post-listing 3/9/2026 365 days post-listing 6/12/2026 Dividends require future board approval. The amount of future dividends declared and approved by the Board could be higher or lower. PROPRIETARY AND CONFIDENTIAL 35
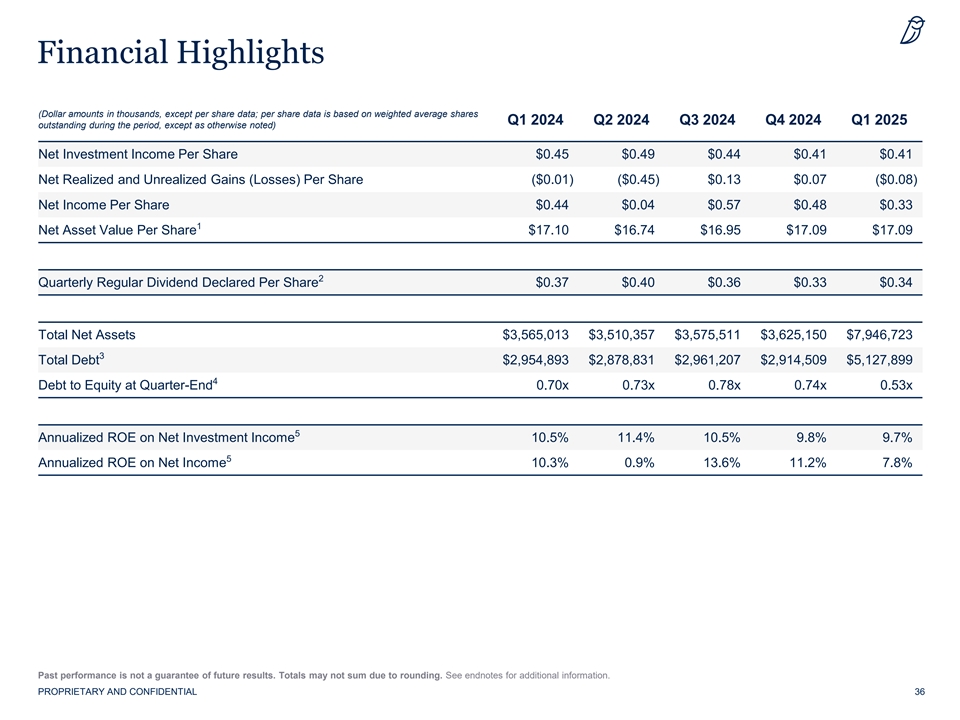
Financial Highlights ( Dollar amounts in thousands, except per share data; per share data is based on weighted average shares Q1 2024 Q2 2024 Q3 2024 Q4 2024 Q1 2025 outstanding during the period, except as otherwise noted) Net Investment Income Per Share $0.45 $0.49 $0.44 $0.41 $0.41 Net Realized and Unrealized Gains (Losses) Per Share ($0.01) ($0.45) $0.13 $0.07 ($0.08) Net Income Per Share $0.44 $0.04 $0.57 $0.48 $0.33 1 Net Asset Value Per Share $17.10 $16.74 $16.95 $17.09 $17.09 2 Quarterly Regular Dividend Declared Per Share $0.37 $0.40 $0.36 $0.33 $0.34 Total Net Assets $3,565,013 $3,510,357 $3,575,511 $3,625,150 $7,946,723 3 Total Debt $2,954,893 $2,878,831 $2,961,207 $2,914,509 $5,127,899 4 Debt to Equity at Quarter-End 0.70x 0.73x 0.78x 0.74x 0.53x 5 Annualized ROE on Net Investment Income 10.5% 11.4% 10.5% 9.8% 9.7% 5 Annualized ROE on Net Income 10.3% 0.9% 13.6% 11.2% 7.8% Past performance is not a guarantee of future results. Totals may not sum due to rounding. See endnotes for additional information. PROPRIETARY AND CONFIDENTIAL 36
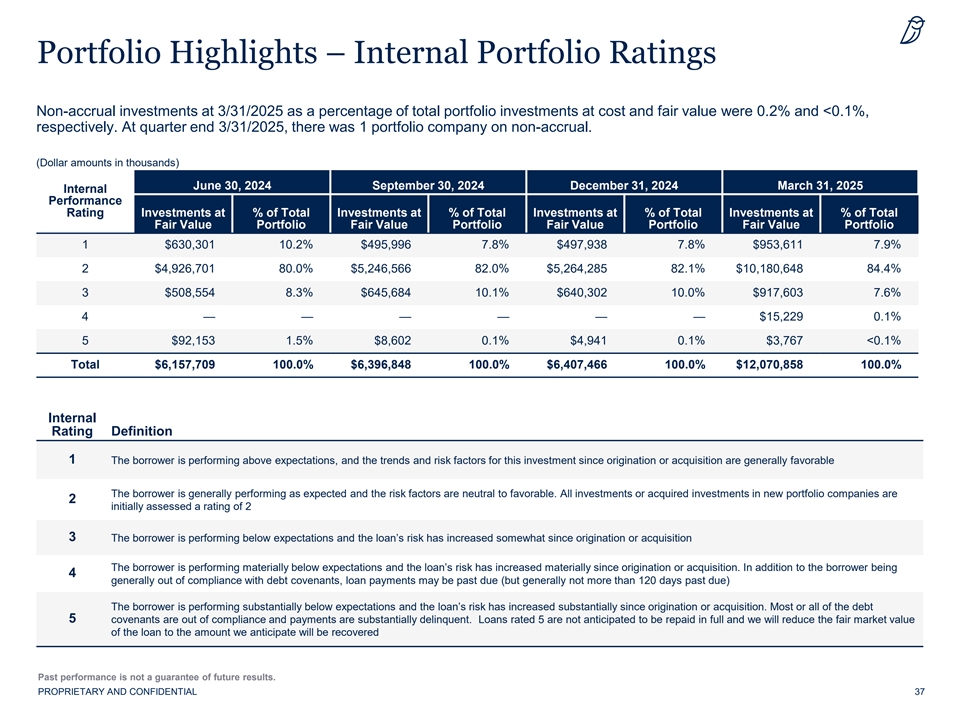
Portfolio Highlights – Internal Portfolio Ratings Non-accrual investments at 3/31/2025 as a percentage of total portfolio investments at cost and fair value were 0.2% and <0.1%, respectively. At quarter end 3/31/2025, there was 1 portfolio company on non-accrual. (Dollar amounts in thousands) June 30, 2024 September 30, 2024 December 31, 2024 March 31, 2025 Internal Performance Rating Investments at % of Total Investments at % of Total Investments at % of Total Investments at % of Total Fair Value Portfolio Fair Value Portfolio Fair Value Portfolio Fair Value Portfolio 1 $630,301 10.2% $495,996 7.8% $497,938 7.8% $953,611 7.9% 2 $4,926,701 80.0% $5,246,566 82.0% $5,264,285 82.1% $10,180,648 84.4% 3 $508,554 8.3% $645,684 10.1% $640,302 10.0% $917,603 7.6% 4 — — — — — — $15,229 0.1% 5 $92,153 1.5% $8,602 0.1% $4,941 0.1% $3,767 <0.1% Total $6,157,709 100.0% $6,396,848 100.0% $6,407,466 100.0% $12,070,858 100.0% Internal Rating Definition 1 The borrower is performing above expectations, and the trends and risk factors for this investment since origination or acquisition are generally favorable The borrower is generally performing as expected and the risk factors are neutral to favorable. All investments or acquired investments in new portfolio companies are 2 initially assessed a rating of 2 3 The borrower is performing below expectations and the loan’s risk has increased somewhat since origination or acquisition The borrower is performing materially below expectations and the loan’s risk has increased materially since origination or acquisition. In addition to the borrower being 4 generally out of compliance with debt covenants, loan payments may be past due (but generally not more than 120 days past due) The borrower is performing substantially below expectations and the loan’s risk has increased substantially since origination or acquisition. Most or all of the debt 5 covenants are out of compliance and payments are substantially delinquent. Loans rated 5 are not anticipated to be repaid in full and we will reduce the fair market value of the loan to the amount we anticipate will be recovered Past performance is not a guarantee of future results. PROPRIETARY AND CONFIDENTIAL 37
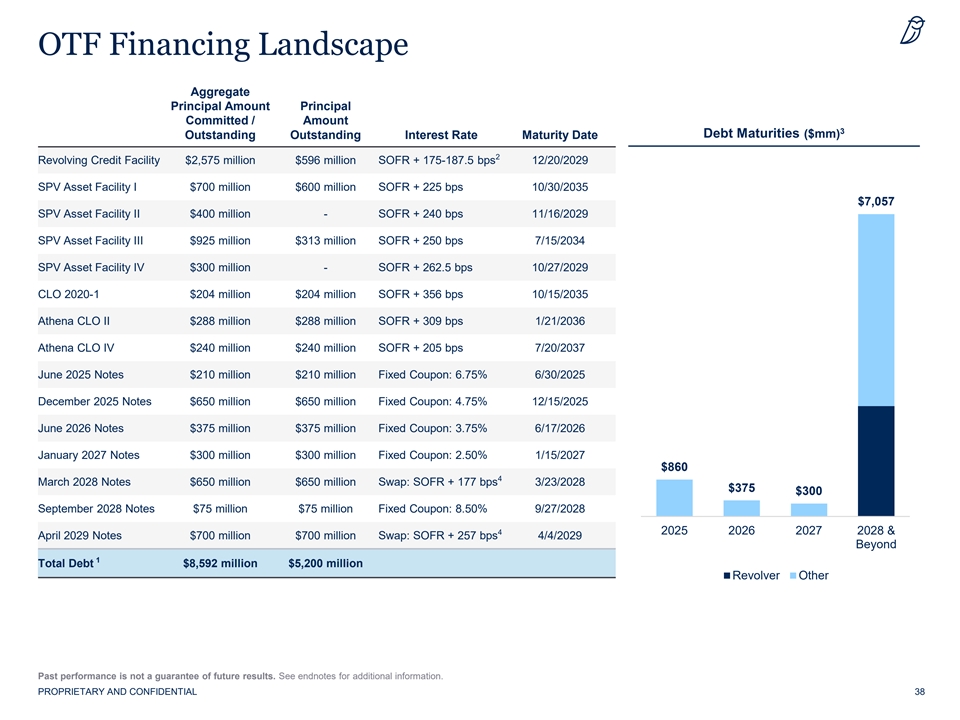
OTF Financing Landscape Aggregate Principal Amount Principal Committed / Amount 3 Debt Maturities ($mm) Outstanding Outstanding Interest Rate Maturity Date 2 Revolving Credit Facility $2,575 million $596 million SOFR + 175-187.5 bps 12/20/2029 SPV Asset Facility I $700 million $600 million SOFR + 225 bps 10/30/2035 $7,057 SPV Asset Facility II $400 million - SOFR + 240 bps 11/16/2029 SPV Asset Facility III $925 million $313 million SOFR + 250 bps 7/15/2034 SPV Asset Facility IV $300 million - SOFR + 262.5 bps 10/27/2029 CLO 2020-1 $204 million $204 million SOFR + 356 bps 10/15/2035 Athena CLO II $288 million $288 million SOFR + 309 bps 1/21/2036 Athena CLO IV $240 million $240 million SOFR + 205 bps 7/20/2037 June 2025 Notes $210 million $210 million Fixed Coupon: 6.75% 6/30/2025 December 2025 Notes $650 million $650 million Fixed Coupon: 4.75% 12/15/2025 June 2026 Notes $375 million $375 million Fixed Coupon: 3.75% 6/17/2026 January 2027 Notes $300 million $300 million Fixed Coupon: 2.50% 1/15/2027 $860 4 March 2028 Notes $650 million $650 million Swap: SOFR + 177 bps 3/23/2028 $375 $300 September 2028 Notes $75 million $75 million Fixed Coupon: 8.50% 9/27/2028 4 2025 2026 2027 2028 & April 2029 Notes $700 million $700 million Swap: SOFR + 257 bps 4/4/2029 Beyond 1 Total Debt $8,592 million $5,200 million Revolver Other Past performance is not a guarantee of future results. See endnotes for additional information. PROPRIETARY AND CONFIDENTIAL 38
Endnotes (1 of 3) Note: Figures are as of the quarter-ended 3/31/2025 at fair value unless otherwise noted. Past performance is not a guarantee of future results. Page 2: Blue Owl Technology Corp. Intends to List its Shares on the New York Stock Exchange on or about June 12, 2025 Under the Ticker Symbol “OTF” 1. By total assets. Page 3: Listing Summary 1. Shares outstanding of 465.1 million multiplied by net asset value per share as of 3/31/25 of $17.09. 2. 23,256,814 shares multiplied by net asset value per share as of 3/31/25 of $17.09. 3. Adjusted for any fractional shares each investor holds, which have been rounded up to the nearest whole share. 4. Dividends specified have been declared by OTF’s Board of Directors. A schedule of dividend record and payment dates is available on page 35. Some dividends require future Board approval. The amount of future dividends declared and approved by the Board could be higher or lower. 5. Annualized dividend yield is calculated as follows: annualized regular dividend of $0.35 per share plus special dividend of $0.05 per share, divided by net asset value per share as of 3/31/25. Dividend yield will be impacted to the extent the dividends declared and approved by the board differ from the numbers presented here. 6. Base management fee on gross assets less cash. Page 5: A Defensive Portfolio In Times of Market Volatility 1. Source: Raymond James Equity Research. Business Development Company Weekly (5/27/25). Page 6: Blue Owl Technology Finance Corp. (“OTF”) 1. Average annual Blue Owl Credit net loss rate across the Blue Owl Credit platform based on total annual net realized gains/losses across all investments divided by the average aggregate quarterly cost of investments in each year since inception. The net loss rate is based on the average net loss rates in each year since inception from 2016 to 2025. 2. Annualized dividend yield is calculated as follows: annualized regular dividend of $0.35 per share plus special dividend of $0.05 per share, divided by net asset value per share as of 3/31/25. Dividend yield will be impacted to the extent the dividends declared and approved by the board differ from the numbers presented here. 3. Weighted average yield of accruing debt and income producing securities at fair value. Calculated based on the interest rate and the accretion of OID. OID represents OID earned on the investment by a Blue Owl BDC. Separately, a Blue Owl adviser may engage in certain origination activities and receive attendant arrangement, structuring or similar fees. As such OID could have been higher had the Blue Owl Advisers not collected this fee. 4. As part of its portfolio monitoring process, Blue Owl Technology Credit Advisors LLC employs an investment rating system to categorize our investments, where 1 is the highest rating and 5 is the lowest. 5. Net of cash. 6. Average annual OTF loss rate based on total annual net realized gains/losses divided by the average aggregate quarterly cost of investments in each year since inception. 7. A security rating is not a recommendation to buy, sell or hold securities and may be subject to revision or withdrawal at any time. For complete ratings definitions please visit www.fitchratings.com, www.moodys.com, www.spglobal.com and www.krollbondratings.com. Page 10: Blue Owl Manages a Market Leading Credit Business 1. On a pro forma basis for OTF’s estimated assets under management at the midpoint of OTF’s target leverage range of 0.90x to 1.25x debt-to-equity. 2. Blue Owl acquired the Liquid Credit platform in April 2022. 3. Includes Strategic Equity and Healthcare Opportunities. Page 14: Blue Owl Technology Lending by the Numbers 1. On a pro forma basis for OTF’s estimated assets under management at the midpoint of OTF’s target leverage range of 0.90x to 1.25x debt-to-equity. 2. Borrower financials are as of the latest available, typically a quarter in arrears. Excludes certain investments that fall outside of our typical borrower profile. 3. “Net LTV” represents the net ratio of “loan to value” for each portfolio company, weighted based on the fair value of OTF’s loan investment. The “attachment point” is the principal amount of debt that is senior to OTF’s \loan investment, and that amount plus the principal amount of the loan in which OTF invested and other equally ranked debt is the “last dollar” amount. “Value” represents an estimate of enterprise value of each portfolio company, a calculation that will vary by portfolio company. 4. Average annual OTF loss rate based on total annual net realized gains/losses divided by the average aggregate quarterly cost of investments in each year since inception. 5. Total return since inception is calculated as the change in quarterly net asset value per share plus total dividends per share divided by net asset value per share at inception. Page 17: Software is Ubiquitous 1. Source: Gartner as of 3/31/25. 2. Source: Bloomberg as of 5/21/25. 39
Endnotes (2 of 3) Page 18: Technology and Software Debt Has Been Historically Resilient Across Multiple Cycles 1. Source: Pitchbook LCD, ”US Leveraged Loan Default Review April 8, 2025”. The cumulative default rate is calculated as a total number of U.S. institutional loan defaults, divided by the total number of U.S. institutional loans tracked by LCD. Default rates comprise Pitchbook LCD loan data from 1995 through March 31, 2025 and there can be no guarantee that historical trends will continue. LCD defines a default as an event in which the company files for bankruptcy, the facility gets downgraded to D by S&P (not due to below par buybacks), or the interest payment is missed without a forbearance. Industry default rate is calculated by taking the total industry default amount in US dollars and dividing it by the total default amount in US dollars of all loans. 2. The “All Industries” default rate shown represents a weighted average of all industry default rates by each industry default amount. 3. The specific industries shown herein are included as representative of the technology sector generally and are not intended to reflect a sole or primary area of investment of OTF. Technology is classified as “Computers and Electronics” and ”Information Technology.” LCD represents Leveraged Commentary & Data, a provider of leveraged loan news, analytics, and index products. LCD is an offering of Pitchbook Data. Page 19: Where Blue Owl Technology Lives 1. Borrower financials are as of the latest available, typically a quarter in arrears. Excludes certain investments that fall outside of our typical borrower profile. 2. “Net LTV” represents the net ratio of “loan to value” for each portfolio company, weighted based on the fair value of OTF’s loan investment. The “attachment point” is the principal amount of debt that is senior to OTF’s loan investment, and that amount plus the principal amount of the loan in which OTF invested and other equally ranked debt is the “last dollar” amount. “Value” represents an estimate of enterprise value of each portfolio company, a calculation that will vary by portfolio company. 3. Excludes joint ventures (Blue Owl Credit SLF LLC) and investments in Amergin AssetCo, LSI, and Fifth Season. Page 22: Portfolio Construction: How OTF Approaches Asset Mix 1. Borrower financials are as of the latest available, typically a quarter in arrears. Excludes certain investments that fall outside of our typical borrower profile. 2. “Net LTV” represents the net ratio of “loan to value” for each portfolio company, weighted based on the fair value of OTF’s loan investment. The “attachment point” is the principal amount of debt that is senior to OTF’s loan investment, and that amount plus the principal amount of the loan in which OTF invested and other equally ranked debt is the “last dollar” amount. “Value” represents an estimate of enterprise value of each portfolio company, a calculation that will vary by portfolio company. Page 23: Focus on Recurring Revenue Loans 1. Based on fair value of total investments. 2. Borrower financials are as of the latest available, typically a quarter in arrears. Excludes certain investments that fall outside of our typical borrower profile. 3. “Net LTV” represents the net ratio of “loan to value” for each portfolio company, weighted based on the fair value of OTF’s loan investment. The “attachment point” is the principal amount of debt that is senior to OTF’s loan investment, and that amount plus the principal amount of the loan in which OTF invested and other equally ranked debt is the “last dollar” amount. “Value” represents an estimate of enterprise value of each portfolio company, a calculation that will vary by portfolio company. Page 24: Preferred Equity Snapshot 1. Based on fair value of total investments. 2. Borrower financials are as of the latest available, typically a quarter in arrears. Excludes certain investments that fall outside of our typical borrower profile. 3. Last dollar out. 4. Excludes non-income producing preferred equity investments. Page 25: Payment-in-Kind (“PIK”) as a Strategy 1. Historical figures shown on a pro forma basis including both OTF and OTF II. Page 27: OTF to List as the Largest Technology-Focused BDC 1. By total assets. 2. Borrower financials are as of the latest available, typically a quarter in arrears. Excludes certain investments that fall outside of our typical borrower profile. 3. Across the Blue Owl Credit platform. 4. Cyclical names include certain portfolio companies with consumer, industrials and manufacturing end markets which are more cyclical in nature 5. “Net LTV” represents the net ratio of “loan to value” for each portfolio company, weighted based on the fair value of OTF’s loan investment. The “attachment point” is the principal amount of debt that is senior to OTF’s loan investment, and that amount plus the principal amount of the loan in which OTF invested and other equally ranked debt is the “last dollar” amount. “Value” represents an estimate of enterprise value of each portfolio company, a calculation that will vary by portfolio company. 6. As part of its portfolio monitoring process, Blue Owl Technology Credit Advisors LLC employs an investment rating system to categorize our investments, where 1 is the highest rating and 5 is the lowest. 7. Average annual OTF loss rate based on total annual net realized gains/losses divided by the average aggregate quarterly cost of investments in each year since inception. 8. The amount available reflects limitations related to each credit facility’s borrowing base. Total liquidity represents undrawn debt plus cash. 9. Annualized dividend yield is calculated as follows: annualized regular dividend of $0.35 per share plus special dividend of $0.05 per share, divided by net asset value per share as of 3/31/25. Dividend yield will be impacted to the extent the dividends declared and approved by the board differ from the numbers presented here. 40

Endnotes (3 of 3) Page 28: OTF at a Glance 1. As part of its portfolio monitoring process, Blue Owl Technology Credit Advisors LLC employs an investment rating system to categorize our investments, where 1 is the highest rating and 5 is the lowest. 2. Borrower financials are as of the latest available, typically a quarter in arrears. Excludes certain investments that fall outside of our typical borrower profile. 3. “Net LTV” represents the net ratio of “loan to value” for each portfolio company, weighted based on the fair value of OTF’s loan investment. The “attachment point” is the principal amount of debt that is senior to OTF’s loan investment, and that amount plus the principal amount of the loan in which OTF invested and other equally ranked debt is the “last dollar” amount. “Value” represents an estimate of enterprise value of each portfolio company, a calculation that will vary by portfolio company. 4. Weighted average yield of accruing debt and income producing securities at fair value. Calculated based on the interest rate and the accretion of OID. OID represents OID earned on the investment by a Blue Owl BDC. Separately, a Blue Owl adviser may engage in certain origination activities and receive attendant arrangement, structuring or similar fees. As such OID could have been higher had the Blue Owl Advisers not collected this fee. Page 29: Flexible Balance Sheet and Well-Diversified Financing Structure 1. Based on outstanding debt. 2. The amount available reflects limitations related to each credit facility’s borrowing base. Total liquidity represents undrawn debt plus cash. Page 30: Attractive Total Returns 1. Average annual OTF loss rate based on total annual net realized gains/losses divided by the average aggregate quarterly cost of investments in each year since inception. 2. Total return since inception is calculated as the change in quarterly net asset value per share plus total dividends per share divided by net asset value per share at inception. Page 31: Strong Dividend Profile 1. Annualized dividend yield is calculated as follows: annualized regular dividend of $0.35 per share plus special dividend of $0.05 per share, divided by net asset value per share as of 3/31/25. Dividend yield will be impacted to the extent the dividends declared and approved by the board differ from the numbers presented here. Page 32: Opportunities to Optimize OTF and Improve Return on Equity 1. The amount available reflects limitations related to each credit facility’s borrowing base. Total dry powder represents undrawn debt plus cash. Page 33: OTF is Well-Positioned to Deliver for Investors 1. Borrower financials are as of the latest available, typically a quarter in arrears. Excludes certain investments that fall outside of our typical borrower profile. 2. “Net LTV” represents the net ratio of “loan to value” for each portfolio company, weighted based on the fair value of OTF’s loan investment. The “attachment point” is the principal amount of debt that is senior to OTF’s loan investment, and that amount plus the principal amount of the loan in which OTF invested and other equally ranked debt is the “last dollar” amount. “Value” represents an estimate of enterprise value of each portfolio company, a calculation that will vary by portfolio company. 3. Average annual OTF loss rate based on total annual net realized gains/losses divided by the average aggregate quarterly cost of investments in each year since inception. 4. Total return since inception is calculated as the change in quarterly net asset value per share plus total dividends per share divided by net asset value per share at inception. 5. Across the Credit platform. Page 36: Financial Highlights 1. Based on period end shares. 2. Dividend amount based on shares outstanding as of record date. 3. Net of debt issuance costs. 4. Net of cash. 5. Annualized quarterly net investment income or net income per share divided by beginning period net asset value per share. Page 38: OTF Financing Landscape 1. Par value. 2. Amounts drawn under the Revolving Credit Facility with respect to the commitments maturing on December 20, 2029 will bear interest at the relevant rate (including any applicable credit adjustment spread) plus margin of either 1.875% per annum or, if the gross borrowing base is greater than or equal to the product of 1.60 and the combined debt amount, 1.75% per annum. 3. Based on principal amount committed. 4. In connection with the note offering, OTF entered into an interest rate swap to continue to align the interest rates of our liabilities with our investment portfolio, which consists of predominately floating rate loans. As a result of the swap, our effective interest rate on the notes was one‐ month SOFR plus CSA plus 177 basis points, which reflects the current terms. 5. In connection with the note offering, OTF entered into an interest rate swap to continue to align the interest rates of our liabilities with our investment portfolio, which consists of predominately floating rate loans. As a result of the swap, our effective interest rate on the notes was one‐ month SOFR plus CSA plus 256 basis points, which reflects the current terms. 41
Disclaimer Past performance is not a guide to future results and is not indicative of expected realized returns. Assets Under Management (“AUM”) refers to the assets that Credit manages and are generally equal to the sum of (i) net asset value (“NAV”); (ii) drawn and undrawn debt; and (iii) uncalled capital commitments. This presentation contains proprietary information regarding Blue Owl Capital Inc. (“Blue Owl”), its affiliates and investment program, funds sponsored by Blue Owl, including the Credit Funds, the GP Strategic Capital Funds and the Real Estate Funds (collectively the “Blue Owl Funds”) as well as investment held by the Blue Owl Funds. This presentation and the information contained in this presentation may not be reproduced or distributed to persons other than the recipient or its advisors. The views expressed and, except as otherwise indicated, the information provided are as of the report date and are subject to change, update, revision, verification, and amendment, materially or otherwise, without notice, as market or other conditions change. Since these conditions can change frequently, there can be no assurance that the trends described herein will continue or that any forecasts are accurate. In addition, certain of the statements contained in this presentation may be statements of future expectations and other forward-looking statements that are based on the current views and assumptions of Blue Owl and involve known and unknown risks and uncertainties (including those discussed below) that could cause actual results, performance, or events to differ materially from those expressed or implied in such statements. These statements may be forward-looking by reason of context or identified by words such as “may, will, should, expects, plans, intends, anticipates, believes, estimates, predicts, potential or continue” and other similar expressions. Neither Blue Owl, its affiliates, nor any of Blue Owl’s or its affiliates' respective advisers, members, directors, officers, partners, agents, representatives or employees or any other person (collectively the “Blue Owl Entities”) is under any obligation to update or keep current the information contained in this document. This presentation contains information from third party sources which Blue Owl has not verified. No representation or warranty, express or implied, is given by or on behalf of the Blue Owl Entities as to the accuracy, fairness, correctness or completeness of the information or opinions contained in this presentation and no liability whatsoever (in negligence or otherwise) is accepted by the Blue Owl Entities for any loss howsoever arising, directly or indirectly, from any use of this presentation or its contents, or otherwise arising in connection therewith. Performance Information: Where performance returns have been included in this presentation, Blue Owl has included herein important information relating to the calculation of these returns as well as other pertinent performance related definitions. SPV Asset Facilities: Certain of our wholly owned subsidiaries are parties to credit facilities (the “SPV Asset Facilities”). Pursuant to the SPV Asset Facilities, we sell and contribute certain investments to these wholly owned subsidiaries pursuant to sale and contribution agreements by and between us and the wholly owned subsidiaries. No gain or loss is recognized as a result of these contributions. Proceeds from the SPV Asset Facilities are used to finance the origination and acquisition of eligible assets by the wholly owned subsidiary, including the purchase of such assets from us. We retain a residual interest in assets contributed to or acquired to the wholly owned subsidiary through our ownership of the wholly owned subsidiary. The SPV Asset Facilities are secured by a perfected first priority security interest in the assets of these wholly owned subsidiaries and on any payments received by such wholly owned subsidiaries in respect of those assets. Assets pledged to lenders under the SPV Asset Facilities will not be available to pay our debts. The SPV Asset Facilities contain customary covenants, including certain limitations on the incurrence by us of additional indebtedness and on our ability to make distributions to our shareholders, or redeem, repurchase or retire shares of stock, upon the occurrence of certain events, and customary events of default (with customary cure and notice provisions). CLOs: CLO Debt is the secured obligation of the CLO Issuers, and the Indenture and the CLO Credit Agreement include customary covenants and events of default. Assets pledged to holders of the Secured Debt and the other secured parties under the Indenture will not be available to pay our debts. The CLO Notes were offered in reliance on Section 4(a)(2) of the Securities Act. The CLO Notes have not been registered under the Securities Act or any state securities laws and, unless so registered, may not be offered or sold in the United States except pursuant to an exemption from, or in a transaction not subject to, the registration requirements of the Securities Act as applicable. All investments are subject to risk, including the loss of the principal amount invested. These risks may include limited operating history, uncertain distributions, inconsistent valuation of the portfolio, changing interest rates, leveraging of assets, reliance on the investment advisor, potential conflicts of interest, payment of substantial fees to the investment advisor and the dealer manager, potential illiquidity, and liquidation at more or less than the original amount invested. Diversification will not guarantee profitability or protection against loss. Performance may be volatile, and the NAV may fluctuate. This material is for informational purposes only and is not an offer or a solicitation to sell or subscribe for any fund and does not constitute investment, legal, regulatory, business, tax, financial, accounting, or other advice or a recommendation regarding any securities of Blue Owl, of any fund or vehicle managed by Blue Owl, or of any other issuer of securities. Only a definitive offering document (i.e.: Prospectus or Private Placement Memorandum) can make such an offer. Neither the Securities and Exchange Commission, the Attorney General of the State of New York nor any state securities commission has approved or disapproved of these securities or determined if the Prospectus or Private Placement Memorandum is truthful or complete. Any representation to the contrary is a criminal offense. Securities are offered through Blue Owl Securities LLC, member of FINRA/SIPC, as Dealer Manager. Copyright© Blue Owl Capital Inc. 2025 All rights reserved. This presentation is proprietary and may not be reproduced, transferred, or distributed in any form without prior written permission from Blue Owl. It is delivered on an “as is” basis without warranty or liability by accepting the information, you agree to abide by all applicable copyright and other laws, as well as any additional copyright notices or restrictions contained in the information. 42