10-K: Annual report [Section 13 and 15(d), not S-K Item 405]
Published on February 18, 2026
UNITED STATES
SECURITIES AND EXCHANGE COMMISSION
Washington, D.C. 20549
______________________________________________________________________________
FORM 10-K
______________________________________________________________________________
| (Mark One) | |||||
ANNUAL REPORT PURSUANT TO SECTION 13 OR 15(d) OF THE SECURITIES EXCHANGE ACT OF 1934 | |||||
For the fiscal year ended December 31 , 2025
OR
| TRANSITION REPORT PURSUANT TO SECTION 13 OR 15(d) OF THE SECURITIES EXCHANGE ACT OF 1934 | |||||
For the transition period from to
Commission File Number 000-55977
(Exact name of Registrant as specified in its Charter)
______________________________________________________________________________
(State or other jurisdiction of incorporation or organization) | (I.R.S. Employer Identification No.) | |||||||
(Address of principal executive offices) | (Zip Code) | |||||||
Registrant’s telephone number, including area code: (212 ) 419-3000
______________________________________________________________________________
Securities registered pursuant to Section 12(b) of the Act:
| Title of each class | Trading Symbol(s) | Name of each exchange on which registered | ||||||||||||
Securities registered pursuant to Section 12(g) of the Act: Common Stock, $0.01 par value per share
Indicate by check mark if the registrant is a well-known seasoned issuer, as defined in Rule 405 of the Securities Act Yes x No o
Indicate by check mark if the registrant is not required to file reports pursuant to Section 13 or Section 15(d) of the Act. Yes o No x
Indicate by check mark whether the Registrant: (1) has filed all reports required to be filed by Section 13 or 15(d) of the Securities Exchange Act of 1934 during the preceding 12 months (or for such shorter period that the Registrant was required to file such reports), and (2) has been subject to such filing requirements for the past 90 days. Yes x No o
Indicate by check mark whether the Registrant has submitted electronically, every Interactive Data File required to be submitted pursuant to Rule 405 of Regulation S-T (§232.405 of this chapter) during the preceding 12 months (or for such shorter period that the Registrant was required to submit such files). Yes x No o
Indicate by check mark whether the Registrant is a large accelerated filer, an accelerated filer, a non-accelerated filer, a smaller reporting company, or an emerging growth company. See the definitions of “large accelerated filer”, “accelerated filer”, “smaller reporting company” and “emerging growth company” in Rule 12b-2 of the Exchange Act.
Accelerated filer o | |||||||||||
Non-accelerated filer o | Small reporting company | ||||||||||
Emerging growth company | |||||||||||
If an emerging growth company, indicate by check mark if the registrant has elected not to use the extended transition period for complying with any new or revised financial accounting standards provided pursuant to Section 13(a) of the Exchange Act. o
Indicate by check mark whether the registrant has filed a report on and attestation to its management’s assessment of the effectiveness of its internal control over financial reporting under Section 404(b) of the Sarbanes-Oxley Act (15 U.S.C. 7262(b)) by the registered public accounting firm that prepared or issued its audit report. x
If securities are registered pursuant to Section 12(b) of the Act, indicate by check mark whether the financial statements of the registrant included in the filing reflect the correction of an error to previously issued financial statements. o
Indicate by check mark whether any of those error corrections are restatements that required a recovery analysis of incentive-based compensation received by any of the registrant’s executive officers during the relevant recovery period pursuant to §240.10D-1(b).o
Indicate by check mark whether the Registrant is a shell company (as defined in Rule 12b-2 of the Exchange Act). YES o NO x
The aggregate market value of common stock held by non-affiliates as of June 30, 2025 based on the closing price on that date of $15.25 on The New York Stock Exchange, was approximately $6,964,994,518 .
As of February 11, 2026, the registrant had 465,329,991 shares of common stock, $0.01 par value per share, outstanding.
i
Table of Contents
| Page | ||||||||
Item 1C. | ||||||||
| Item 6. | ||||||||
F-1 | ||||||||
ii
CAUTIONARY STATEMENT REGARDING FORWARD-LOOKING STATEMENTS
This report contains forward-looking statements that involve substantial risks and uncertainties. Such statements involve known and unknown risks, uncertainties and other factors and undue reliance should not be placed thereon. These forward-looking statements are not historical facts, but rather are based on current expectations, estimates and projections about Blue Owl Technology Finance Corp. (the “Company,” “we” or “our”), our current and prospective portfolio investments, our industry, our beliefs and opinions, and our assumptions. Words such as “anticipates,” “expects,” “intends,” “plans,” “will,” “may,” “continue,” “believes,” “seeks,” “estimates,” “would,” “could,” “should,” “targets,” “projects,” “outlook,” “potential,” “predicts” and variations of these words and similar expressions are intended to identify forward-looking statements. These statements are not guarantees of future performance and are subject to risks, uncertainties and other factors, some of which are beyond our control and difficult to predict and could cause actual results to differ materially from those expressed or forecasted in the forward-looking statements, including without limitation:
•an economic downturn could impair our portfolio companies’ ability to continue to operate, which could lead to the loss of some or all of our investments in such portfolio companies;
•an economic downturn could disproportionately impact the companies that we intend to target for investment, potentially causing us to experience a decrease in investment opportunities and diminished demand for capital from these companies;
•the impact of elevated inflation rates, fluctuating interest rates, ongoing supply chain and labor market disruptions, including those as a result of strikes, work stoppages or accidents, instability in the U.S. and international banking systems, changes in law or regulation, including the impact of tariff enactment and tax reductions, trade disputes with other countries, and the risk of recession or future government shutdowns could impact our business prospects and the prospects of our portfolio companies;
•an economic downturn could also impact availability and pricing of our financing and our ability to access the debt and equity capital markets;
•a contraction of available credit and/or an inability to access the equity markets could impair our lending and investment activities;
•changes in base interest rates and significant market volatility on our business and our portfolio companies (including our business prospects and the prospects of our portfolio companies including the ability to achieve our and their business objectives), our industry and the global economy including as a result of ongoing supply chain disruptions;
•interest rate volatility could adversely affect our results, particularly because we use leverage as part of our investment strategy;
•currency fluctuations could adversely affect the results of our investments in foreign companies, particularly to the extent that we receive payments denominated in foreign currency rather than U.S. dollars;
•our future operating results;
•our contractual arrangements and relationships with third parties;
•the ability of our portfolio companies to achieve their objectives;
•competition with other entities and our affiliates for investment opportunities;
•risks related to the uncertainty of the value of our portfolio investments, particularly those having no liquid trading market;
•the use of borrowed money to finance a portion of our investments as well as any estimates regarding potential use of leverage;
•the adequacy of our financing sources and working capital;
•the loss of key personnel;
•the timing of cash flows, if any, from the operations of our portfolio companies;
•the ability of Blue Owl Technology Credit Advisors LLC (“the Adviser” or “our Adviser”) to locate suitable investments for us and to monitor and administer our investments;
•the ability of the Adviser to attract and retain highly talented professionals;
•our ability to qualify for and maintain our tax treatment as a regulated investment company (“RIC”) under subchapter M of the Internal Revenue Code of 1986, as amended (the “Code”), and as a business development company (“BDC”) under the Investment Company Act of 1940, as amended (the “1940 Act”);
•the impact that environmental, social and governance matters could have on our brand and reputation and our portfolio companies;
•the effect of legal, tax and regulatory changes on our business and our portfolio companies;
1
•the impact of geo-political conditions, including revolution, insurgency, terrorism or war, including those arising out of the ongoing war between Russia and Ukraine, continued political unrest in various countries such as Venezuela, as well as political and social unrest in the Middle East and North Africa regions, uncertainty with respect to immigration, and general uncertainty surrounding the financial and political stability of the United States, the United Kingdom, the European Union and China, on financial market volatility, global economic markets, and various markets for commodities globally such as oil and natural gas; and
•the ability to realize the anticipated benefits of the merger of Blue Owl Technology Finance Corp. II (“OTF II”) with and into us (the “Mergers”) on March 24, 2025 pursuant to an Agreement and Plan of Merger (the “Merger Agreement”), dated November 12, 2024, among us, OTF II, Oriole Merger Sub, Inc., a Maryland corporation and our wholly owned subsidiary (“Merger Sub”) and, solely for the limited purposes set forth therein, the Adviser and, solely for the limited purposes set forth therein, Blue Owl Technology Credit Advisers II LLC, a Delaware limited liability company and investment advisor to OTF II (“OTCA II”); and
•other risks, uncertainties and other factors previously identified in the reports and other documents we have filed with the Securities and Exchange Commission (“SEC”).
Although we believe that the assumptions on which these forward-looking statements are based are reasonable, any of those assumptions could prove to be inaccurate, and as a result, the forward-looking statements based on those assumptions also could be inaccurate. In light of these and other uncertainties, the inclusion of a projection or forward-looking statement in this report should not be regarded as a representation by us that our plans and objectives will be achieved. These forward-looking statements apply only as of the date of this report. Moreover, we assume no duty and do not undertake to update the forward-looking statements. Because we are an investment company, the forward-looking statements and projections contained in this report are excluded from the safe harbor protection provided by Section 21E of the U.S. Securities Exchange Act of 1934, as amended (the “Exchange Act”).
2
PART I
Item 1. Business.
Our Company
Blue Owl Technology Finance Corp. is a Maryland corporation formed on July 12, 2018. We are focused primarily on making loans to, and making debt and equity investments in technology-related, specifically software, companies based primarily in the United States. We originate and invest in senior secured or unsecured loans, subordinated loans or mezzanine loans, and equity-related securities including common equity, warrants, preferred stock and similar forms of senior equity, which may or may not be convertible into a portfolio company’s common equity. Our investment objective is to maximize total return by generating current income from debt investments and other income producing securities, and capital appreciation from our equity and equity-linked investments. We may hold our investments directly or through special purpose vehicles.
We intend to invest at least 80% of the value of our total assets in “technology-related” companies. We define technology-related companies as those that (i) operate directly in the technology industry which includes, but is not limited to application software, systems software, healthcare technology, information technology, technology services and technology infrastructure, financial technology and internet and digital media, (ii) operate indirectly through their reliance on technology (i.e., utilizing scientific knowledge or technology-enabled techniques, skills, methods, devices or processes as an integral part of their delivery of goods and/or services) or (iii) seek to grow primarily through technological advancements and innovations. We invest in a broad range of established and high growth technology-related companies with a focus on large, established enterprise software companies across a variety of end-markets that are capitalizing on the large and growing demand for enterprise software products and services. Within enterprise software we currently focus on investing in application software, which represents the operating layer for core business functions; systems and infrastructure software, which is the defense layer that protects enterprise data and networks and of which cybersecurity is a large component; and fintech and payments software, which provide critical means for the global movement of capital.
We are externally managed by the Adviser, which is a registered investment adviser with the SEC. The Adviser is an indirect affiliate of Blue Owl Capital Inc. (“Blue Owl”) (NYSE: OWL) and part of Blue Owl’s Credit platform, which includes several strategies, including direct lending, alternative credit, investment grade credit, liquid credit and other adjacent investment strategies. We leverage Blue Owl’s relationships and existing origination capabilities to focus our investments in companies with an enterprise value of at least $250 million and that are typically backed by institutional investors that are active investors in and have an expertise in technology companies and technology-related industries. We expect that our target credit investments will typically have maturities between three and ten years and generally range in size between $20 million and $500 million. Our expected portfolio composition will be majority debt or income producing securities, with a lesser allocation to equity related opportunities. We anticipate that generally any equity related securities we hold will be minority positions. We expect that our investment size will vary with the size of our capital base and we anticipate that our average investment size will be 0.5-1.5% of our entire portfolio with no investment size greater than 5%; however, from time to time certain of our investments may comprise greater than 5%. In addition, we generally do not intend to invest more than 20% of our total assets in companies whose principal place of business is outside the United States, although we do not generally intend to invest in companies whose principal place of business is in an emerging market. Our portfolio composition may fluctuate from time to time based on market conditions and interest rates.
As of December 31, 2025, based on fair value, our portfolio consisted of 76.8% first lien senior secured debt investments, 4.0% second lien senior secured debt investments, 0.3% specialty finance debt investments, 3.3% unsecured debt investments, 7.5% preferred equity investments, 5.1% common equity investments, 2.6% specialty finance equity investments and 0.4% joint ventures. As of December 31, 2025, 96.2% of our debt investments based on fair value bear interest at a floating rate, subject to interest rate floors, in certain cases. As of December 31, 2025, we had investments in 199 portfolio companies with an aggregate fair value of $14.3 billion.
As of December 31, 2025, our portfolio was invested across 39 different industries. The largest industry in our portfolio as of December 31, 2025 was Systems Software, which represented 17.9% of our total portfolio at fair value.
On June 12, 2025, our stock was listed and began trading on the New York Stock Exchange (“NYSE”) under the symbol “OTF” (the “Exchange Listing”).
We are an externally managed, closed-end management investment company that has elected to be regulated as a BDC under the 1940 Act. We have elected to be treated, and intend to qualify annually thereafter, as a RIC for U.S. federal income tax purposes. As a BDC and a RIC, we are required to comply with certain regulatory requirements. As a BDC, at least 70% of our assets must be assets of the type listed in Section 55(a) of the 1940 Act, as described herein. We will not invest more than 20% of our total assets in companies whose principal place of business is outside the United States. See “— Regulation as a Business Development Company” and “— Certain U.S. Federal Income Tax Considerations.”
We generally intend to distribute, out of assets legally available for distribution, substantially all of our available earnings, on a quarterly basis, as determined by our board of directors (the “Board”) in its sole discretion.
3
Certain consolidated subsidiaries of ours are subject to U.S. federal and state corporate-level income taxes.
We may borrow money from time to time within the levels permitted by the 1940 Act (which generally allows us to incur leverage up to two-thirds of our assets). We currently have in place a revolving credit facility, a senior secured credit agreement and special purpose vehicle asset credit facilities and in the future may enter into additional credit facilities. In addition, we have issued unsecured notes and may issue additional unsecured notes in the future. We have also entered into term debt securitization transactions, also known as collateralized loan obligation transactions, and in the future may enter into additional collateralized loan obligation transactions. We expect to use our credit facilities and other borrowings, along with proceeds from the rotation of our portfolio, to finance our investment objectives. See “— Regulation as a Business Development Company” for discussion of BDC regulation and other regulatory considerations. See “Item 7. MANAGEMENT’S DISCUSSION AND ANALYSIS OF FINANCIAL CONDITION AND RESULTS OF OPERATIONS — Debt.”
On March 24, 2025, we consummated the transactions contemplated by the Agreement and Plan of Merger (the “Merger Agreement”), dated November 12, 2024, with Blue Owl Technology Finance Corp. II, a Maryland corporation (“OTF II”), Oriole Merger Sub, Inc., a Maryland corporation and our wholly-owned subsidiary (“Merger Sub”), and, solely for the limited purposes set forth therein, the Adviser, and OTCA II, investment adviser to OTF II. In connection therewith, Merger Sub merged with and into OTF II, with OTF II continuing as the surviving company and our wholly-owned subsidiary (the “Initial Merger”) and, immediately thereafter, OTF II merged with and into us, and we continued as the surviving company (together with the Initial Merger, the “Mergers”).
The Adviser and Administrator — Blue Owl Technology Credit Advisors LLC
Blue Owl Technology Credit Advisors LLC serves as our investment adviser pursuant to an amended and restated investment advisory agreement between us and the Adviser (the “Investment Advisory Agreement”). See “Investment Advisory Agreement” below. The Adviser also serves as our Administrator pursuant to an amended and restated administration agreement between us and the Adviser (the “Administration Agreement”). See “Administration Agreement” below.
The Adviser is a Delaware limited liability company that is registered with the SEC as an investment adviser under the Investment Advisers Act of 1940, as amended (the “Advisers Act”). The Adviser is an indirect affiliate of Blue Owl and part of Blue Owl’s Credit platform. Blue Owl consists of three investment platforms: (1) Credit, which includes several strategies, including direct lending, alternative credit, investment grade credit, liquid credit and other adjacent investment strategies, (2) GP Strategic Capital, which primarily focuses on acquiring equity stakes in, or providing debt financing to, large, multi-product private equity and private credit firms and (3) Real Assets, which primarily focuses on the strategies of net lease real estate, real estate credit and digital infrastructure, which focuses on acquiring, financing, developing and operating data centers and related digital infrastructure assets. The Adviser is part of the direct lending strategy of Blue Owl’s Credit platform which focuses on lending to primarily upper-middle-market companies, both private equity-sponsored and non-sponsored, and provides a range of customized financing solutions across debt and equity-related instruments. In addition to the Adviser, Blue Owl’s Credit platform’s direct lending strategy is comprised of the Adviser, Blue Owl Technology Credit Advisors II LLC (“OTCA II”), Blue Owl Credit Advisors LLC (“OCA”), Blue Owl Diversified Credit Advisors LLC (“ODCA”) and Blue Owl Credit Private Fund Advisors LLC (“OPFA” and together with the Adviser, OTCA II, OCA and ODCA, the “Blue Owl Credit Advisers”), which are also registered investment advisers.
Blue Owl’s Credit platform is led by its three co-founders, Douglas I. Ostrover, Marc S. Lipschultz and Craig W. Packer. The Adviser’s investment team (the “Investment Team”) is also led by Douglas I. Ostrover, Marc S. Lipschultz and Craig W. Packer and is supported by certain members of the Adviser’s senior executive team and Blue Owl’s Credit platform’s direct lending investment committees. Blue Owl’s four direct lending investment committees focus on a specific investment strategy (Diversified Lending, Technology Lending, First Lien Lending and Opportunistic Lending). Douglas I. Ostrover, Marc S. Lipschultz, Craig W. Packer, and Alexis Maged, sit on each of Blue Owl’s direct lending investment committees. In addition to Messrs. Ostrover, Lipschultz, Packer and Maged, the Technology Lending Investment Committee is comprised of Erik Bissonnette, Pravin Vazirani, Jon ten Oever, and Arthur Martini. We consider these individuals on the Technology Lending Investment Committee to be our portfolio managers. The Adviser has limited operating history. The Investment Team, under the Technology Lending Investment Committee’s supervision, sources investment opportunities, conducts research, performs due diligence on potential investments, structures our investments and monitors our portfolio companies on an ongoing basis. Subject to the overall supervision of the Board, the Adviser manages our day-to-day operations and provides investment advisory and management services to us.
As of December 31, 2025, the Blue Owl Credit Advisers managed $157.8 billion in assets under management (“AUM”), of which $115.0 billion was attributable to the direct lending strategy which includes the following strategies:
• Diversified Lending — The diversified lending strategy seeks to generate current income and, to a lesser extent, capital appreciation by targeting investment opportunities with favorable risk-adjusted returns across credit cycles with an emphasis on preserving capital primarily through originating and making loans to, and making debt and equity investments in, U.S. middle market companies.
•Technology Lending — The technology lending strategy seeks to maximize total return by generating current income from our debt investments and other income producing securities, and capital appreciation from our equity and equity-linked
4
investments primarily through originating and making loans to, and making debt and equity investments in, technology-related companies based primarily in the United States.
•First Lien Lending — The first lien lending strategy seeks to realize current income with an emphasis on preservation of capital primarily through originating primary transactions in and, to a lesser extent, secondary transactions of first lien senior secured loans in or related to private equity sponsored, middle market businesses based primarily in the United States.
•Opportunistic Lending — The opportunistic lending strategy seeks to generate attractive, risk-adjusted returns by taking advantage of credit opportunities in U.S. middle market companies with liquidity needs and market leaders seeking to improve their balance sheets.
We refer to the Blue Owl BDCs and the private funds, interval fund and separately managed accounts managed by the Blue Owl Credit Advisers in the direct lending strategy, as the “Blue Owl Credit Clients.” In addition to the Blue Owl Credit Clients, Blue Owl's Credit platform includes (1) alternative credit, which targets credit-oriented investments in markets underserved by traditional lenders or the broader capital markets, with deep expertise investing across specialty finance, private corporate credit and equipment leasing; (2) investment grade credit, which focuses on generating capital-efficient investment income through asset-backed finance, private corporate credit, and structured products; and (3) liquid credit, which focuses on the management of collateralized loan obligation vehicles (“CLOs”). Blue Owl’s Credit platform also includes other adjacent investment strategies (e.g., strategic equity assets and healthcare companies).
Blue Owl Credit Clients and other Blue Owl clients may have overlapping objectives with us. The Adviser and its affiliates may face conflicts in the allocation of investment opportunities to us and others. In addition, the Adviser and its affiliates are permitted to allocate an investment to a number of products across platforms that it views as appropriate for the particular investment objectives, strategies and characteristics of such products. In order to address these conflicts, the Blue Owl Credit Advisers have put in place investment allocation policies that address the allocation of investment opportunities as well as co-investment restrictions under the 1940 Act. See, “ITEM 13. CERTAIN RELATIONSHIPS AND RELATED TRANSACTIONS, AND DIRECTOR INDEPENDENCE.”
In addition, we rely on an order for exemptive relief (the “Order”) to co-invest with other funds managed by the Adviser or certain affiliates, in a manner consistent with our investment objective, positions, policies, strategies and restrictions as well as regulatory requirements and other pertinent factors. Pursuant to such Order, we are generally permitted to co-invest with certain of our affiliates if such co-investments are done on the same terms and at the same time, as further detailed in the Order. The Order requires that a “required majority” (as defined in Section 57(o) of the 1940 Act) of the Board make certain findings (1) in most instances when we co-invest with our affiliates in an issuer where our affiliate has an existing investment in the issuer, and (2) if we dispose of an asset acquired in a transaction under the Order unless the disposition is done on a pro rata basis. Pursuant to the Order, the Board will oversee our participation in the co-investment program. As required by the Order, we have adopted, and the Board has approved, policies and procedures reasonably designed to ensure compliance with the terms of the Order, and the Adviser and our Chief Compliance Officer will provide reporting to the Board.
As a result of the Order, there could be significant overlap in our investment portfolio and the investment portfolio of the Blue Owl Credit Clients and other Blue Owl clients that avail themselves of the Order. In addition, the Adviser and its affiliates are permitted to allocate an investment to a number of products across platforms that it views as appropriate for the particular investment objectives, strategies and characteristics of such products. See “Item 1A. Risk Factors —Risks Related to our Adviser and its Affiliates — Our Adviser and its affiliates may face conflicts of interest with respect to services performed for their respective other accounts and clients or issuers in which we may invest.”
The Adviser or its affiliates may engage in certain origination activities and receive attendant arrangement, structuring or similar fees from portfolio companies. See “Item 1A. Risk Factors —Risks Related to our Adviser and its Affiliates — Our Adviser and its affiliates may face conflicts of interest with respect to services performed for their respective other accounts and clients or issuers in which we may invest.”
The Adviser’s address is 399 Park Avenue, 37th floor, New York, NY 10022.
Market Trends
We believe the technology investment lending environment provides opportunities for us to meet our goal of making investments that generate an attractive total return based on a combination of the following factors.
Limited Availability of Capital for Technology, Specifically Enterprise Software, Companies — We believe that technology companies have limited access to capital, driven by a lack of dedicated pools of capital focused on technology companies. Traditional lenders, such as commercial and investment banks, generally do not have flexible product offerings that meet the needs of technology-related companies and there has been a reduction in activity from commercial and investment banks as a result of regulatory and structural factors, industry consolidation and general risk aversion. In recent years, many commercial and investment banks have focused their efforts and resources on lending to large corporate clients and managing capital markets transactions rather than lending to technology-related companies. In addition, these lenders may be constrained in their ability to underwrite and hold loans and high yield securities, as well as their ability to provide equity financing, as they seek to meet existing and future regulatory capital requirements. We also believe that there is a lack of scaled market participants that are willing to provide and hold meaningful
5
amounts of a customized financing solution for technology companies. As a result, we believe our focus on technology-related companies and our ability to invest across the capital structure, coupled with a limited supply of capital providers, presents an attractive opportunity to invest in technology companies.
Capital Markets Have Been Unable to Fill the Void Left by Banks — Access to the underwritten bond and syndicated loan markets is challenging for many technology companies due to loan size and liquidity. For example, high yield bonds are generally purchased by institutional investors such as mutual funds and exchange traded funds (“ETFs”) who, among other things, are highly focused on the liquidity characteristics of the bond being issued in order to fund investor redemptions and/or comply with regulatory requirements. Accordingly, the existence of an active secondary market for bonds is an important consideration in these entities’ initial investment decision. Syndicated loans arranged through a bank are done either on a “best efforts” basis or are underwritten with terms plus provisions that permit the underwriters to change certain terms, including pricing, structure, yield and tenor, otherwise known as “flex”, to successfully syndicate the loan, in the event the terms initially marketed are insufficiently attractive to investors. Loans provided by companies such as ours provide certainty to issuers in that we can commit to a given amount of debt on specific terms, at stated coupons and with agreed upon fees. As we are the ultimate holder of the loans, we do not require market “flex” or other arrangements that banks may require when acting on an agency basis. In addition, our Adviser has teams focused on both liquid credit and private credit and these teams are able to collaborate with respect to syndicated loans.
Secular Trends Supporting Growth for Private Credit — According to Gartner, a research and advisory company, global technology spend was $5.6 trillion in 2025 and is expected to grow to more than $6.2 trillion in 2026. We believe global demand for technology products and services will continue to grow rapidly, and that growth will stimulate demand for capital from technology companies which will continue to require access to capital to refinance existing debt, support growth and finance acquisitions. We believe that periods of market volatility, such as the current period of market volatility caused, in part, by uncertainty regarding inflation and interest rates, and current geopolitical conditions, have accentuated the advantages of private credit. The availability of capital in the liquid credit market is highly sensitive to market conditions whereas we believe private lending has proven to be a stable and reliable source of capital through periods of volatility. We believe the opportunity set for private credit will continue to expand even as the public markets remain open. Financial sponsors and companies today are familiar with direct lending and have seen firsthand the strong value proposition that a private solution can offer. Scale, certainty of execution and flexibility all provide borrowers with a compelling alternative to the syndicated and high yield markets. Based on our experience, larger, higher quality credits that have traditionally been issuers in the syndicated and high yield markets are increasingly seeking private solutions independent of credit market conditions. In our view, this is supported by financial sponsors wanting to work with collaborative financing partners that have scale and breadth of capabilities. This has driven substantial growth in direct lending portfolio companies over time. Given the dynamics mentioned above, we believe this trend is poised to continue and the large amount of uninvested capital held by funds of private equity firms, estimated by Preqin Ltd., an alternative assets industry data and research company, to be $2.7 trillion as December 31, 2025, will continue to serve as a tailwind to the space.
Attractive Investment Dynamics — With respect to the debt investments in technology companies, we believe the directly negotiated nature of such financings generally provides more favorable terms to the lender, including stronger covenant and reporting packages, better call protection, and lender protective change of control provisions. Further, we believe that historical default rates for technology and software companies have been lower, and recovery rates have been higher, as compared to the broader leveraged finance market, leading to lower cumulative losses. With respect to equity and equity-linked investments, we will seek to structure these investments with meaningful shareholder protections, including, but not limited to, anti-dilution, anti-layering, and liquidation preferences, which we believe will create the potential for meaningful risk-adjusted long-term capital gains in connection with the future liquidity events of these technology companies. Lastly, we believe that in the current environment, lenders with available capital may be able to take advantage of attractive investment opportunities.
Compelling Business Models — We believe that the products and services that technology companies, and more specifically enterprise software businesses, provide often have high switching costs and are fundamental to the operations and success of their customers across diverse industries. We generally invest in scaled or growing players in niche markets that are selling mission critical products to established customer bases. As a result, technology companies with a focus on enterprise software have attributes that make them compelling investments, including strong customer retention rates, high switching costs and highly contracted cash flows which leads to recurring and predictable revenue. Further, technology companies with a focus on enterprise software are typically highly capital efficient, with limited capital expenditures and high free cash flow conversion. In addition, the replicable nature of technology products, specifically enterprise software, creates substantial operating leverage which typically results in strong profitability, lower loan to value ratios, high revenue retention, high gross margins and stable sale efficiency.
We believe that enterprise software businesses make compelling investments because they are inherently diversified into a variety of sectors due to end market applications and have been one of the more defensive sectors throughout economic cycles.
Attractive Opportunities in Investments in Technology Companies — We invest in the debt and equity of technology companies. We believe that opportunities in the debt of technology companies are significant because of the floating rate structure of most senior secured debt issuances and because of the strong defensive characteristics of these types of investments. We believe that debt issued with floating interest rates offer a superior return profile as compared with fixed-rate investments, since floating rate structures are generally less susceptible to declines in value experienced by fixed-rate securities in a rising interest rate environment.
6
Senior secured debt provides strong defensive characteristics because it has priority in payment among an issuer’s security holders whereby holders are due to receive payment before junior creditors and equity holders. Further, these investments are generally secured by the issuer’s assets, which may provide protection in the event of a default. We also make recurring revenue loans to companies that have made a strategic decision to postpone profitability in favor of acquiring customers that will generate a high lifetime value over time. We believe that recurring revenue loans provide attractive credit characteristics including covenant protections, lower loan-to-values and/or premium pricing.
We believe that opportunities in the equity of technology companies are significant because of the potential to generate meaningful capital appreciation by participating in the growth in the portfolio company and the demand for its products and services. We find many of these opportunities are in the form of preferred equities, where there is the opportunity to invest in large, established companies through structures that protect invested capital and also offer upside opportunities. Moreover, we believe that the high-growth profile of a technology company will generally make it a more attractive candidate for a liquidity event than a company in a non-high growth industry. We believe the technology investment lending environment provides opportunities for us to meet our goal of making investments that generate an attractive total return based on a combination of the foregoing factors.
Potential Competitive Advantages
We believe that the Adviser’s disciplined approach to origination, fundamental investment analysis, portfolio construction and risk management should allow us to achieve attractive risk-adjusted returns while preserving our capital. We believe that we represent an attractive investment opportunity for the following reasons:
Dedicated Pool of Capital — From a deal sourcing perspective, having a pool of capital dedicated to technology investing should enable us to be a more relevant partner to sponsors and management teams who seek this type of financing for their deals.
Additionally, our dedicated industry focus is supported by a team with a track record of success investing in technology businesses. The Adviser’s network of deep industry relationships creates a substantial information advantage that informs and augments its due diligence process. This unique positioning should further drive entrenchment with sponsors as the Adviser will typically be viewed as a value-added partner during the diligence and investment lifecycle of our businesses.
We believe that there is currently an opportunity for us to be a “first mover” as a specialized debt financing provider in the technology sector. We believe the technology sector to be underserved and, other than the Company and Blue Owl Technology Income Corp. (“OTIC”), we are not aware of other entities currently serving the sector that have large pools of capital dedicated to the space and that operate competing businesses.
Experienced Team with Expertise Across all Levels of the Corporate Capital Structure — The members of the Technology Lending Investment Committee have over 25 years of experience in private lending and investing at all levels of a company’s capital structure, including in high yield securities, leveraged loans, high yield credit derivatives, distressed securities, and equity securities, as well as experience in operations, corporate finance, mergers and acquisitions and workout restructuring. The members of the Technology Lending Investment Committee have diverse backgrounds with investing experience through multiple business and credit cycles. Moreover, certain members of the Technology Lending Investment Committee and other executives and employees of the Adviser and its affiliates have operating and/or investing experience on behalf of business development companies. In addition, through its West Coast office, the Adviser has a significant presence in Silicon Valley to better serve financial sponsors operating in the technology sector. We believe this experience provides the Adviser with an in-depth understanding of the strategic, financial and operational challenges and opportunities of technology companies and will afford it numerous tools to manage risk while preserving the opportunity for attractive risk-adjusted returns on our investments and offering a diverse product set to help meet borrowers’ needs.
Distinctive Origination Platform — We anticipate that a substantial majority of our investments will be sourced directly and that our origination platform provides us the ability to originate investments without the assistance of investment banks or other traditional Wall Street intermediaries.
The Investment Team includes approximately 130 investment professionals (over 40 of whom are dedicated to technology investing) and is responsible for originating, underwriting, executing and managing the assets of our direct lending transactions and for sourcing and executing opportunities directly. The Investment Team is fully dedicated to direct lending and has significant experience as transaction originators and building and maintaining strong relationships with private equity sponsors, venture capital firms, entrepreneurs and companies. In addition, we believe that the Investment Team has enhanced sourcing capabilities because of their ability to utilize Blue Owl’s resources and its relationships with the financial sponsor community and service providers, which we believe may broaden our deal funnel and result in an increased pipeline of deal opportunities.
The Investment Team also maintains direct contact with banks, corporate advisory firms, industry consultants, attorneys, investment banks, “club” investors and other potential sources of lending opportunities. We believe the Adviser’s ability to source through multiple channels allows us to generate investment opportunities that have more attractive risk-adjusted return characteristics than by relying solely on origination flow from investment banks or other intermediaries and to be more selective investors.
7
Since OCA’s inception in April 2016 through December 31, 2025, the Adviser and its affiliates have reviewed over 3,105 technology-related opportunities totaling approximately $1.195 billion of financing and have sourced potential investment opportunities from more than 840 private equity sponsors and venture capital firms. We believe that the Adviser receives “early looks” and “last looks” based on its and Blue Owl's relationships, allowing it to be highly selective in the transactions it pursues.
Provide Customized Financing Complementary to Financial Sponsors’ Capital — We offer a broad range of investment structures and possess expertise and experience to effectively structure and price investments in technology companies. We offer customized financing solutions ranging from senior debt to equity capital. Unlike many of our competitors that we believe are restricted to smaller investment sizes and only invest in companies that fit a specific set of investment parameters, we have the scale and flexibility to structure our investments to suit the particular needs of our portfolio companies. As a result, we believe that our capital will be viewed as an attractive and complimentary source of capital, both by the portfolio company and by the portfolio company’s financial sponsor.
Potential Long-Term Investment Horizon — We believe our potential long-term investment horizon gives us flexibility, allowing us to maximize returns on our investments in technology companies. We invest using a long-term focus, which we believe provides us with the opportunity to increase total returns on invested capital, as compared to other private company investment vehicles or investment vehicles with daily liquidity requirements (e.g., open-ended mutual funds and ETFs).
Defensive Investment Philosophy — The Adviser employs an investment approach focused on rigorous due diligence and underwriting, a highly selective and multi-stage investment decision process, and ongoing portfolio monitoring. The investment approach will focus on quantitative and qualitative factors, with particular emphasis on early detection of potential deterioration. This strategy is designed to minimize potential losses and achieve attractive risk adjusted returns.
Active Portfolio Monitoring — The Adviser closely monitors the investments in our portfolio and takes a proactive approach to identifying and addressing sector- or company-specific risks. The Adviser receives and reviews detailed financial information from portfolio companies no less than quarterly and seeks to maintain regular dialogue with portfolio company management teams regarding current and forecasted performance. We anticipate that many of our debt investments will have financial covenants that we believe will provide an early warning of potential problems facing our borrowers, allowing lenders, including us, to identify and carefully manage risk. Further, we anticipate that many of our equity investments will provide us the opportunity to nominate a member or observer to the board of directors of the portfolio company or otherwise include provisions protecting our rights as a minority-interest holder, which we believe will allow us to closely monitor the performance of these portfolio companies. In addition, the Adviser has built out its portfolio management team to include workout experts who closely monitor our portfolio companies and who, on at least a quarterly basis, assess each portfolio company’s operational and liquidity exposure and outlook to understand and mitigate risks; and, on at least a monthly basis, evaluates existing and newly identified situations where operating results are deviating from expectations. As part of its monitoring process, the Adviser focuses on projected liquidity needs and where warranted, re-underwriting credits and evaluating downside and liquidation scenarios.
Increasing Benefits of Scale — We believe the Adviser’s robust, scaled infrastructure and focus on direct lending provides us a competitive advantage which enables us to provide attractive solutions as a trusted partner and therefore continue to capture market share. Blue Owl’s differentiated approach and scaled platform allow us to capitalize on opportunities across the sizing spectrum—from bespoke financing solutions to traditional upper-middle-market loans and, increasingly, loans of $2.0 billion or more. Blue Owl’s Credit platform’s scale has demonstrated the ability to originate larger deals, while also providing diversification. We believe our scale enables Blue Owl to broaden our deal funnel and provides us access to more investment opportunities than many other direct lenders.
Investment Selection
The Adviser applies rigorous and established investment selection and underwriting criteria. Although not exhaustive, the Adviser expects that our investments will typically have many of the following attributes:
•Mission critical solutions: solutions that are essential to business operations and are tightly integrated into the workflows or operations of end users;
•Market leadership positions: a leadership position in its market (or the potential to establish a leadership position) with potential and/or defensible barriers to entry;
•Strong quality of revenue: revenue streams with high degrees of visibility (contracted or reoccurring) and substantial gross margins diversified by a granular, long-tenured customer base;
•Strong customer retention: highly embedded software with meaningful switching costs;
•Highly capital efficient: strong free cash flow conversion or the potential to generate strong free cash flow conversion due to operating margins and low capital intensity; and
•Attractive Unit Economics: strong payback periods in respect of lifetime value of a customer versus the cost to acquire the customer.
8
The Adviser has identified the following investment criteria and guidelines that it believes are important in evaluating prospective portfolio companies. However, not all of these criteria and guidelines will be met, or will be equally important, in connection with each of our investments.
Established Companies with Positive Cash Flow — We seek to invest in companies with sound historical financial performance and a history of profitability which we believe tend to be well-positioned to maintain consistent, often contractual, cash flow to service and repay their obligations and maintain growth in their businesses or market share in all market conditions, including in the event of a recession. The Adviser primarily focuses on upper middle-market companies with a history of profitability on an operating cash flow basis, a high percentage of recurring revenue and with limited cyclicality in their end markets. The Adviser does not intend to invest in start-up companies that have not achieved sustainable profitability and cash flow generation or companies with speculative business plans.
Strong Competitive Position in Industry — The Adviser analyzes the strengths and weaknesses of target companies relative to their competitors. The factors the Adviser considers include relative product pricing, product quality, customer loyalty, substitution risk, switching costs, patent protection, brand positioning and capitalization. We seek to invest in companies that have developed leading positions within their respective markets, are well positioned to capitalize on growth opportunities and operate businesses, exhibit the potential to maintain sufficient cash flows and profitability to service their obligations in a range of economic environments or are in industries with significant barriers to entry. We seek companies that demonstrate advantages in scale, scope, customer loyalty, product pricing or product quality versus their competitors that, when compared to their competitors, may help to protect their market position and profitability.
Experienced Management Team — We seek to invest in companies that have experienced management teams. We also seek to invest in companies that have proper incentives in place, including management teams having significant equity interests to motivate management to act in concert with our interests as an investor.
Diversified Customer and Supplier Base — We generally seek to invest in companies that have a diversified customer and supplier base. Companies with a diversified customer and supplier base are generally better able to endure economic downturns, industry consolidation, changing business preferences and other factors that may negatively impact their customers, suppliers and competitors.
Exit Strategy — While certain debt investments may be repaid through operating cash flows of the borrower, we expect that the primary means by which we exit our debt investments will be through methods such as strategic acquisitions by other industry participants, an initial public offering of common stock, a recapitalization, a refinancing or another transaction in the capital markets.
Prior to making an equity investment in a prospective portfolio company, we analyze the potential for that company to increase the liquidity of its equity through a future event that would enable us to realize appreciation in the value of our equity interest. Liquidity events may include an initial public offering, a private sale of our equity interest to a third party, a merger or an acquisition of the company or a purchase of our equity position by the company or one of its stockholders.
In addition, in connection with our investing activities, we may make commitments with respect to an investment in a potential portfolio company substantially in excess of our final investment. In such situations, while we may initially agree to fund up to a certain dollar amount of an investment, we may sell a portion of such amount, such that we are left with a smaller investment than what was reflected in our original commitment.
Financial Sponsorship — We seek to participate in transactions sponsored by what we believe to be high-quality private equity and venture capital firms. We believe that a financial sponsor’s willingness to invest significant sums of equity capital into a company is an explicit endorsement of the quality of their investment. Further, financial sponsors of portfolio companies with significant investments at risk have the ability and a strong incentive to contribute additional capital in difficult economic times should operational issues arise.
Investments in Different Portfolio Companies and Industries — We seek to invest broadly among portfolio companies and industries, thereby potentially reducing the risk of any one company or industry having a disproportionate impact on the value of our portfolio; however, there can be no assurances in this regard. We seek to structure larger transactions and invest in stable, recession-resistant, strategically valuable industries that we are familiar with. We seek to invest not more than 20% of our portfolio in any single industry classification and target portfolio companies that comprise 0.5-1.5% of our portfolio (with no individual portfolio company generally expected to comprise greater than 5% of our portfolio).
Investment Process Overview
9
Origination and Sourcing — The Investment Team has an extensive network from which to source deal flow and referrals. Specifically, the Adviser sources portfolio investments from a variety of different investment sources, including among others, private equity sponsors, management teams, financial intermediaries and advisers, investment bankers, family offices, accounting firms and law firms. The Adviser focuses on sponsor-led leveraged buyouts, refinancings, recapitalizations and acquisitions and sponsors who value the ability to provide sizable commitments; flexible and creative solutions; and certainty, speed and transparency. To a lesser extent, the Adviser may invest in broadly syndicated loans. The Adviser believes that its experience across different industries and transaction types makes the Adviser particularly qualified to source, analyze and execute investment opportunities with a focus on downside protection and a return of principal.
Due Diligence Process — The process through which an investment decision is made involves extensive research into the company, its industry, its growth prospects and its ability to withstand adverse conditions. If one or more members of the Investment Team responsible for the transaction determines that an investment opportunity should be pursued, the Adviser will engage in an intensive due diligence process focused on fundamental credit analysis and downside protection. Though each transaction may involve a somewhat different approach, the Adviser’s diligence of each opportunity could include:
•understanding the purpose of the loan, the key personnel, the sources and uses of the proceeds;
•meeting the company’s management and key personnel, including top level executives, to get an insider’s view of the business, and to probe for potential weaknesses in business prospects;
•checking management’s backgrounds and references;
•performing a detailed review of historical financial performance, including performance through various economic cycles, and the quality of earnings;
•contacting customers and vendors to assess both business prospects and standard practices;
•conducting a competitive analysis, and comparing the company to its main competitors on an operating, financial, market share and valuation basis;
•researching the industry for historic growth trends and future prospects as well as to identify future exit alternatives;
•assessing asset value and the ability of physical infrastructure and information systems to handle anticipated growth;
•leveraging the Adviser’s internal resources and network with institutional knowledge of the company’s business;
•assessing business valuation and corresponding recovery analysis;
•developing downside financial projections and liquidation analysis;
•reviewing responsible investing and environmental, social and governance (“ESG”) considerations including consulting the Sustainability Accounting Standards Board’s Engagement Guide for ESG considerations; and
•investigating legal and regulatory risks and financial and accounting systems and practices.
Selective Investment Process — After an investment has been identified and preliminary diligence has been completed, a Technology Lending Investment Committee memorandum is prepared. This report is reviewed by the members of the Investment Team in charge of the potential investment and generally includes information on downside protection, asset coverage and collateral. If these members of the Investment Team are in favor of the potential investment, then a more extensive due diligence process, which may include significant analysis and focus on strategy and potential to recover par in default scenarios, is employed. Additional due diligence with respect to any investment may be conducted on our behalf by attorneys, independent accountants, and other third-party consultants and research firms prior to the closing of the investment, as appropriate on a case-by-case basis.
Structuring and Execution — Approval of an investment requires the approval of a majority of the Technology Lending Investment Committee. Once the Technology Lending Investment Committee has determined that a prospective portfolio company is suitable for investment, the Adviser works with the management team of that company and its other capital providers, including senior, junior and equity capital providers, if any, to finalize the structure and terms of the investment. Additionally, a majority of the Technology Lending Investment Committee may approve parameters or guidelines pursuant to which certain investment may be made or sold consistent with our investment objective.
10
Inclusion of Covenants — Covenants are contractual restrictions that lenders place on companies to limit the corporate actions a company may pursue. Generally, the loans in which we expect to invest will have financial maintenance covenants, which are used to proactively address materially adverse changes in a portfolio company’s financial performance. However, to a lesser extent, we may invest in “covenant-lite” loans. We use the term “covenant-lite” to refer generally to loans that do not have a complete set of financial maintenance covenants. Generally, “covenant-lite” loans provide borrower companies more freedom to negatively impact lenders because their covenants are incurrence-based, which means they are only tested and can only be breached following an affirmative action of the borrower, rather than by a deterioration in the borrower’s financial condition. Accordingly, to the extent we invest in “covenant-lite” loans, we may have fewer rights against a borrower and may have a greater risk of loss on such investments as compared to investments in or exposure to loans with financial maintenance covenants.
Portfolio Monitoring — The Adviser monitors our portfolio companies on an ongoing basis. The Adviser monitors the financial trends of each portfolio company to determine if it is meeting its business plans and to assess the appropriate course of action with respect to our investment in each portfolio company. The Adviser has a number of methods of evaluating and monitoring the performance and fair value of our investments, which may include the following:
•assessment of success of the portfolio company in adhering to its business plan and compliance with covenants;
•periodic and regular contact with portfolio company management and, if appropriate, the financial or strategic sponsor, to discuss financial position, requirements and accomplishments;
•comparisons to other companies in the portfolio company’s industry;
•attendance at, and participation in, board meetings; and
•review of periodic financial statements and financial projections for portfolio companies.
An investment will be placed on the Adviser's credit watch list when select events occur and will only be removed from the watch list with oversight of the Technology Lending Investment Committee and/or other Blue Owl agent. Once an investment is on the credit watch list, the Adviser works with the borrower prior to payment default to resolve financial stress through amendments, waivers or other alternatives. If a borrower defaults on its payment obligations, the Adviser's focus shifts to capital recovery. If an investment needs to be restructured, the Adviser’s workout team partners with the investment team and all material amendments, waivers and restructurings require the approval of a majority of the Technology Lending Investment Committee.
Structure of Investments
Our investment objective is to maximize total return by generating current income from debt investments and other income producing securities, and capital appreciation from our equity and equity-linked investments.
We expect that generally our portfolio composition will be majority debt or income producing securities, which may include “covenant-lite” loans, with a lesser allocation to equity or equity-linked opportunities. In addition, we may invest a portion of our portfolio in opportunistic investments, which will not be our primary focus, but will be intended to enhance returns to our shareholders and from time to time, we may evaluate and enter into strategic portfolio transactions which may result in additional portfolio companies which we are considered to control. These investments may include high-yield bonds and broadly-syndicated loans, which are typically originated and structured by banks on behalf of large corporate borrowers with employee counts, revenues, EBITDAs and enterprise values larger than the middle-market characteristics described herein, and equity investments in portfolio companies that make senior secured loans or invest in broadly syndicated loans or structured products, such as life settlements and royalty interests. Our portfolio composition may fluctuate from time to time based on market conditions and interest rates.
Covenants are contractual restrictions that lenders place on companies to limit the corporate actions a company may pursue. Generally, the loans in which we expect to invest will have financial maintenance covenants, which are used to proactively address materially adverse changes in a portfolio company’s financial performance. However, to a lesser extent, we may invest in “covenant-lite” loans. See “Investment Process Overview - Inclusion of Covenants.”
Debt Investments — The terms of our debt investments are tailored to the facts and circumstances of each transaction. The Adviser negotiates the structure of each investment to protect our rights and manage our risk. We generally invest in the following types of debt:
•First-lien debt. First-lien debt typically is senior on a lien basis to other liabilities in the issuer’s capital structure and has the benefit of a first-priority security interest in assets of the issuer. The security interest ranks above the security interest of any second-lien lenders in those assets. Our first-lien debt may include stand-alone first-lien loans, “unitranche” loans (including “last out” portions of such loans), and secured corporate bonds with similar features to
11
these categories of first-lien loans. As of December 31, 2025, 61% of our first lien debt was comprised of unitranche loans.
•Stand-alone first lien loans. Stand-alone first-lien loans are traditional first-lien loans. All lenders in the facility have equal rights to the collateral that is subject to the first-priority security interest.
◦Unitranche loans. Unitranche loans (including the “last out” portions of such loans) combine features of first-lien, second-lien and mezzanine debt, generally in a first-lien position. In many cases, we may provide the issuer most, if not all, of the capital structure above their equity. The primary advantages to the issuer are the ability to negotiate the entire debt financing with one lender and the elimination of intercreditor issues. “Last out” first-lien loans have a secondary priority behind super-senior “first out” first-lien loans in the collateral securing the loans in certain circumstances. The arrangements for a “last out” first-lien loan are typically set forth in an “agreement among lenders,” which provides lenders with “first out” and “last out” payment streams based on a single lien on the collateral. Since the “first out” lenders generally have priority over the “last out” lenders for receiving payment under certain specified events of default, or upon the occurrence of other triggering events under intercreditor agreements or agreements among lenders, the “last out” lenders bear a greater risk and, in exchange, receive a higher effective interest rate, through arrangements among the lenders, than the “first out” lenders or lenders in stand-alone first-lien loans. Agreements among lenders also typically provide greater voting rights to the “last out” lenders than the intercreditor agreements to which second-lien lenders often are subject. Among the types of first-lien debt in which we may invest, “last out” first-lien loans generally have higher effective interest rates than other types of first-lien loans, since “last out” first-lien loans rank below standalone first-lien loans.
•Second-lien debt. Our second-lien debt may include secured loans, and, to a lesser extent, secured corporate bonds, with a secondary priority behind first-lien debt. Second-lien debt typically is senior on a lien basis to unsecured liabilities in the issuer’s capital structure and has the benefit of a security interest over assets of the issuer, though ranking junior to first-lien debt secured by those assets. First-lien lenders and second-lien lenders typically have separate liens on the collateral, and an intercreditor agreement provides the first-lien lenders with priority over the second-lien lenders’ liens on the collateral.
•Mezzanine debt (unsecured debt). Structurally, mezzanine debt usually ranks subordinate in priority of payment to first-lien and second-lien debt, is often unsecured, and may not have the benefit of financial covenants common in first-lien and second-lien debt. However, mezzanine debt ranks senior to common and preferred equity in an issuer’s capital structure. Mezzanine debt investments generally offer lenders fixed returns in the form of interest payments, which could be paid-in-kind, and may provide lenders an opportunity to participate in the capital appreciation, if any, of an issuer through an equity interest. This equity interest typically takes the form of an equity co-investment or warrants. Due to its higher risk profile and often less restrictive covenants compared to senior secured loans, mezzanine debt generally bears a higher stated interest rate than first-lien and second-lien debt.
•Broadly syndicated loans. Broadly syndicated loans (whose features are similar to those described under “First-lien debt” and “Second-lien debt” above) are typically originated and structured by banks on behalf of large corporate borrowers with employee counts, revenues, EBITDAs, and enterprise values larger than the middle-market characteristics described above. The proceeds of broadly syndicated loans are often used for leveraged buyout transactions, mergers and acquisitions, recapitalizations, refinancings, and financing capital expenditures. Broadly syndicated loans are typically distributed by the arranging bank to a diverse group of investors primarily consisting of: CLOs; senior secured loan and high yield bond mutual funds; closed-end funds, hedge funds, banks, and insurance companies; and finance companies. A borrower must comply with various covenants contained in a loan agreement or note purchase agreement between the borrower and the holders of the broadly syndicated loan. The broadly syndicated loans in which we invest may include loans that are considered “covenant-lite” loans, because of their lack of a full set of financial maintenance covenants.
Our debt investments are typically structured with the maximum seniority and collateral that we can reasonably obtain while seeking to achieve our total return target. The Adviser seeks to limit the downside potential of our investments by:
•requiring a total return on our investments (including both interest and potential equity appreciation) that compensates us for credit risk;
•negotiating covenants in connection with our investments consistent with preservation of our capital. Such restrictions may include affirmative covenants (including reporting requirements), negative covenants (including financial maintenance covenants), lien protection, limitations on debt incurrence, restrictions on asset sales, downside and liquidation cases, restrictions on dividends and other payments, cash flow sweeps, collateral protection, required debt amortization, change of control provisions and board rights, including either observation rights or rights to a seat on the board under some circumstances; and
12
•including debt amortization requirements, where appropriate, to require the timely repayment of principal of the loan, as well as appropriate maturity dates.
Within our portfolio, the Adviser aims to maintain the appropriate proportion among the various types of first-lien loans, as well as second-lien debt and mezzanine debt, to allow us to achieve our target returns while maintaining our targeted amount of credit risk.
Our debt investments may be structured as annualized recurring revenue (“ARR”) loans, which are loans made to a company that may not currently be EBITDA positive because they have strategically determined to postpone profitability in favor of acquiring customers that will generate a high lifetime value over time. Generally, our ARR loans are made to high growth technology companies with a stable base of existing customers, providing strong revenue visibility. We believe the recurring revenue market to be underserved and find that ARR loans often have attractive risk adjusted return profiles, in the form of pricing, credit documentation, and /or loan-to-values, relative to the broader market.
Equity Investments — Our investment in a portfolio company could be or may include an equity interest, such as common stock or preferred stock, or equity linked interest, such as a warrant or profit participation right. We may make direct and indirect equity investments with or without a concurrent investment in a more senior part of the capital structure of the issuer. Our equity investments are typically not control-oriented investments and we may structure such equity investments to include provisions protecting our rights as a minority-interest holder.
Specialty Financing Portfolio Companies and Joint Ventures
We leverage the expanding role that private lenders are being asked to play in the broader credit markets to evaluate cross-platform opportunities including strategic equity and accretive joint venture investments that have cash flow and credit profiles that provide consistent income.
Specialty Financing Portfolio Companies — We may make equity investments in portfolio companies that make senior secured loans or invest in broadly syndicated loans or structured products, such as life settlements and royalty interests. Our specialty financing companies include the following:
•Amergin, which consists of AAM Series 1.1 Rail and Domestic Intermodal Feeder, LLC and AAM Series 2.1 Aviation Feeder, LLC (collectively, “Amergin AssetCo”) and Amergin Asset Management LLC, which has entered into a Servicing Agreement with Amergin AssetCo. Amergin was created to invest in a leasing platform focused on railcar, aviation and other long-lived transportation assets. Amergin acquires existing on-lease portfolios of new and end-of-life railcars and related equipment and selectively purchases off-lease assets and is building a commercial aircraft portfolio through aircraft financing and engine acquisition on a sale and lease back basis.
•Fifth Season Investments LLC (“Fifth Season”), a portfolio company created to invest in life insurance based assets, including secondary and tertiary life settlement assets and other life insurance exposures using detailed analytics, internal life expectancy review and sophisticated portfolio management techniques.
•LSI Financing 1 DAC (“LSI Financing DAC”), a portfolio company formed to acquire contractual rights to revenue pursuant to earnout agreements generally in the life sciences space.
•LSI Financing LLC (“LSI Financing LLC”), a separately managed portfolio company formed to indirectly own royalty purchase agreements and loans in the life sciences space.
•Blue Owl Cross-Strategy Opportunities LLC (“BOCSO”), a portfolio company formed to hold alternative credit assets, including asset-based finance (“ABF”). ABF is a subsector of private credit focused on generating income from pools of financial, physical or other assets.
Joint Ventures — We may make equity investments in joint ventures. Our joint ventures include:
•Blue Owl Credit SLF LLC (“Credit SLF”) is a joint venture whose principal purpose is to make investments in senior secured loans to middle-market companies, broadly syndicated loans and senior and subordinated notes issued by collateralized loan obligations.
•Blue Owl Leasing LLC (“Blue Owl Leasing”), a cross-platform joint venture that invests in equipment leases and loans.
Investments
As of December 31, 2025 and 2024, we had investments in 199 and 148 portfolio companies, respectively, with an aggregate fair value of $14.3 billion and $6.4 billion. The table below presents the composition of investments at fair value and amortized cost as of the following periods:
13
| December 31, 2025 | December 31, 2024 | ||||||||||||||||||||||||||||||||||
| ($ in thousands) | Amortized Cost | Fair Value | Net Unrealized Gain (Loss) | Amortized Cost | Fair Value | Net Unrealized Gain (Loss) | |||||||||||||||||||||||||||||
First-lien senior secured debt investments | $ | 10,983,810 | $ | 10,979,070 | $ | (4,740) | $ | 4,457,465 | $ | 4,451,797 | $ | (5,668) | |||||||||||||||||||||||
| Second-lien senior secured debt investments | 601,494 | 568,641 | (32,853) | 292,835 | 258,538 | (34,297) | |||||||||||||||||||||||||||||
| Unsecured debt investments | 467,464 | 477,128 | 9,664 | 337,386 | 336,635 | (751) | |||||||||||||||||||||||||||||
| Specialty finance debt investments | 37,449 | 37,452 | 3 | 5,024 | 5,041 | 17 | |||||||||||||||||||||||||||||
Preferred equity investments | 1,127,105 | 1,072,481 | (54,624) | 764,816 | 686,859 | (77,957) | |||||||||||||||||||||||||||||
Common equity investments | 504,733 | 722,100 | 217,367 | 450,093 | 536,136 | 86,043 | |||||||||||||||||||||||||||||
| Specialty finance equity investments | 351,675 | 375,812 | 24,137 | 124,553 | 131,513 | 6,960 | |||||||||||||||||||||||||||||
Joint Ventures | 53,483 | 53,355 | (128) | 949 | 947 | (2) | |||||||||||||||||||||||||||||
| Total Investments | $ | 14,127,213 | $ | 14,286,039 | $ | 158,826 | $ | 6,433,121 | $ | 6,407,466 | $ | (25,655) | |||||||||||||||||||||||
As of December 31, 2025 and 2024, we had outstanding commitments to fund unfunded investments totaling $1.8 billion and $0.6 billion, respectively.
For additional information about our investment portfolio refer to “Note 4 – Investments” to our consolidated financial statements included in this Annual Report.
Capital Resources and Borrowings
We anticipate generating cash in the future from the issuance of common stock and cash flows from operations, including interest and dividends received on our debt and equity investments, respectively.
We may borrow money from time to time if our asset coverage, as defined in the 1940 Act, is at least equal to 150% immediately after such borrowing. Additionally, we are permitted, under specified conditions, to issue multiple classes of indebtedness and one class of shares senior to our common stock if our asset coverage, as defined in the 1940 Act, is at least equal to 150% immediately after each such issuance. Our current target leverage ratio is 0.90x-1.25x. As of December 31, 2025 and 2024, our asset coverage was 226% and 220%, respectively. See “Regulation as a Business Development Company – Senior Securities; Coverage Ratio” below.
Furthermore, while any indebtedness and senior securities remain outstanding, we must make provisions to prohibit any distribution to our shareholders on our capital stock (which may cause us to fail to distribute amounts necessary to avoid entity-level taxation under the Code), or the repurchase of such capital stock unless we meet the applicable asset coverage ratios at the time of the distribution or repurchase. In addition, we must also comply with positive and negative covenants customary for these types of facilities.
For additional information about our debt obligations see “Note 5 – Debt” to our consolidated financial statements included in this Annual Report and “ITEM 7. MANAGEMENT’S DISCUSSION AND ANALYSIS OF FINANCIAL CONDITION AND RESULTS OF OPERATIONS —Financial Condition, Liquidity and Capital Resources — Debt”.
Distribution Policy
To qualify for tax treatment as a RIC, we must distribute (or be treated as distributing) in each taxable year dividends of an amount equal to at least 90% of our investment company taxable income (which includes, among other items, dividends, interest, the excess of any net short-term capital gains over net long-term capital losses, as well as other taxable income, excluding any net capital gains reduced by deductible expenses) and 90% of our net tax-exempt income for that taxable year. As a RIC, we generally will not be subject to U.S. federal income tax at corporate rates on our investment company taxable income and net capital gains that we distribute to shareholders. We may be subject to a nondeductible 4% U.S. federal excise tax if we do not distribute (or are treated as distributing) in each calendar year an amount at least equal to the sum of:
•98% of our net ordinary income, excluding certain ordinary gains and losses, recognized during a calendar year;
•98.2% of our capital gain net income, adjusted for certain ordinary gains and losses, recognized for the twelve-month period ending on October 31 of such calendar year; and
•certain undistributed amounts from previous years on which we paid no U.S. federal income tax.
14
We have previously incurred, and can be expected to incur such excise tax on a portion of our income and gains. While we intend to distribute income and capital gains to minimize exposure to the 4% excise tax, we may not be able to, or may not choose to, distribute amounts sufficient to avoid the imposition of the tax entirely. In that event, we will be liable for the tax only on the amount by which we do not meet the foregoing distribution requirement. See “ITEM 1A. RISK FACTORS – Risks Related to U.S. Federal Income Tax – We will be subject to U.S. federal income tax imposed at corporate rates if we are unable to maintain our tax treatment as a RIC under subchapter M of the Code.”
Dividend Reinvestment Plan
We have adopted a dividend reinvestment plan, pursuant to which, we will reinvest all cash distributions declared by the Board on behalf of our shareholders who do not elect to receive their distribution in cash as provided below. As a result, if the Board authorizes, and we declare, a cash dividend or other distribution, then our shareholders who have not opted out of our dividend reinvestment plan will have their cash distributions automatically reinvested in additional shares of our common stock rather than receiving the cash dividend or other distribution. As described below, we may purchase shares in the open market or use newly issued shares to implement the dividend reinvestment plan. Any fractional share otherwise issuable to a participant in the dividend reinvestment plan will instead be paid in cash.
Prior to the Exchange Listing, the number of shares to be issued to a shareholder under the dividend reinvestment plan was determined by dividing the total dollar amount of the distribution payable to such shareholder by the net asset value per share of the Company’s common stock, as of the last day of the Company’s calendar quarter immediately preceding the date such distribution was declared. In connection with listing our common stock on the NYSE, we entered into our second amended and restated dividend reinvestment plan, pursuant to which, if newly issued shares are used to implement the dividend reinvestment plan, the number of shares to be issued to a shareholder will be determined by dividing the total dollar amount of the cash dividend or distribution payable to a shareholder by the market price per share of our common stock at the close of regular trading on the NYSE on the payment date of a distribution, or if no sale is reported for such day, the average of the reported bid and ask prices. However, if the market price per share on the payment date of a cash dividend or distribution exceeds the most recently computed net asset value per share, we will issue shares at the greater of (i) the most recently computed net asset value per share and (ii) 95% of the current market price per share (or such lesser discount to the current market price per share that still exceeded the most recently computed net asset value per share). Pursuant to our second amended and restated dividend reinvestment plan, if shares are purchased in the open market to implement the dividend reinvestment plan, the number of shares to be issued to a shareholder shall be determined by dividing the dollar amount of the cash dividend payable to such shareholder by the weighted average price per share for all shares purchased by the plan administrator in the open market in connection with the dividend. Shareholders who receive distributions in the form of shares of common stock will be subject to the same U.S. federal, state and local tax consequences as if they received cash distributions.
No action is required on the part of a registered shareholder to have his, her or its cash dividend or other distributions reinvested in shares of our common stock. A registered shareholder is able to elect to receive an entire cash dividend or other distribution in cash by notifying the Adviser in writing so that such notice is received by the Adviser no later than ten days prior to the record date for distributions to the shareholders.
There are no brokerage charges or other charges to shareholders who participate in the plan.
The plan is terminable by us upon notice in writing mailed to each shareholder of record at least 30 days prior to any record date for the payment of any distribution by us.
Competition
Our primary competitors in providing financing to middle-market technology-related companies include public and private funds, other BDCs, commercial and investment banks, commercial finance companies and, to the extent they provide an alternative form of financing, private equity and hedge funds and alternative asset managers. Many of our competitors are substantially larger and have considerably greater financial, technical, and marketing resources than we do. Many of these competitors have similar investment objectives to us, which may create additional competition for investment opportunities. Some of these competitors may have a lower cost of capital and access to funding sources that are not available to us, which may create competitive disadvantages for us with respect to our investment opportunities. In addition, some of our competitors may have higher risk tolerances or different risk assessments, which could allow them to consider a wider variety of investments and establish more relationships than us. Further, many of our competitors are not subject to the regulatory restrictions that the 1940 Act imposes on us as a BDC, or to the distribution and other requirements we must satisfy to qualify for RIC tax treatment. Lastly, institutional and individual investors are allocating increasing amounts of capital to alternative investment strategies. Several large institutional investors have announced a desire to consolidate their investments in a more limited number of managers. We expect that this will cause competition in our industry to intensify and could lead to a reduction in the size and duration of pricing inefficiencies that many of our products seek to exploit. See “ITEM 1A. RISK FACTORS — Risks Related to Our Business — We may face increasing competition for investment opportunities, which could delay further deployment of our capital, reduce returns and result in losses.”
15
Investment Advisory Agreement
The description below of the Investment Advisory Agreement is only a summary and is not necessarily complete. The description set forth below is qualified in its entirety by reference to the Investment Advisory Agreement.
Under the terms of the Investment Advisory Agreement, the Adviser is responsible for the following:
•managing our assets in accordance with our investment objective, policies and restrictions;
•determining the composition of our portfolio, the nature and timing of the changes to our portfolio and the manner of implementing such changes;
•making investment decisions for us, including negotiating the terms of investments in, and dispositions of, portfolio securities and other instruments on our behalf;
•monitoring our investments;
•performing due diligence on prospective portfolio companies;
•exercising voting rights in respect of portfolio securities and other investments for us;
•serving on, and exercising observer rights for, boards of directors and similar committees of our portfolio companies; and
•providing us with such other investment advisory and related services as we may, from time to time, reasonably require for the investment of capital.
The Adviser’s services under the Investment Advisory Agreement are not exclusive, and accordingly, the Adviser may provide similar services to other entities.
Term
The Investment Advisory Agreement became effective on May 18, 2021. Unless earlier terminated as described below, the Investment Advisory Agreement will remain in effect for two years from the date it first became effective and from year-to-year thereafter if approved annually by a majority of the Board or by the holders of a majority of our outstanding voting securities and, in each case, a majority of the independent directors. On May 5, 2025, the Board approved the continuation of the Investment Advisory Agreement.
The Investment Advisory Agreement will automatically terminate within the meaning of the 1940 Act and related SEC guidance and interpretations in the event of its assignment. In accordance with the 1940 Act, without payment of penalty, we may terminate the Investment Advisory Agreement with the Adviser upon 60 days’ written notice. The decision to terminate the agreement may be made by a majority of the Board or the shareholders holding a Majority of the Outstanding Shares of our common stock. “Majority of the Outstanding Shares” means the lesser of (1) 67% or more of the outstanding shares of common stock present at a meeting, if the holders of more than 50% of the outstanding shares of common stock are present or represented by proxy or (2) a majority of outstanding shares of common stock. In addition, without payment of penalty, the Adviser may generally terminate the Investment Advisory Agreement upon 60 days’ written notice.
Compensation of the Adviser
We will pay the Adviser an investment advisory fee for its services under the Investment Advisory Agreement consisting of two components: a management fee (the “Management Fee”) and an incentive fee (the “Incentive Fee”). The cost of both the Management Fee and the Incentive Fee will ultimately be borne by our shareholders.
The Management Fee is payable quarterly in arrears. Prior to June 12, 2025 (the “Listing Date”), the Management Fee was payable at an annual rate of 0.90% of:
(i)our average gross assets at the end of our two most recently completed calendar quarters, plus
(ii)the average of any remaining unfunded Capital Commitments to us at the end of the two most recently completed calendar quarters;
provided, however, that no Management Fee was be charged on the value of our gross assets that was below an asset coverage ratio of 200% calculated in accordance with Sections 18 and 61 of the 1940 Act.
Following the Listing Date, the Management Fee is payable at an annual rate of:
(i)1.5% of our average gross assets that is above an asset coverage ratio of 200% calculated in accordance with Sections 18 and 61 of the 1940 Act, at the end of the two most recently completed calendar quarters payable quarterly in arrears, and
16
(ii)1.00% of our average gross assets that is below an asset coverage ratio of 200% calculated in accordance with Sections 18 and 61 of the 1940 Act, at the end of the two most recently completed calendar quarters payable quarterly in arrears.
The Management Fee will be appropriately prorated and adjusted (based on the actual number of days elapsed relative to the total number of days in such calendar quarter) for any share issuances or repurchases during the relevant calendar quarters and for any partial month or quarter. For purposes of the Investment Advisory Agreement, gross assets means our total assets determined on a consolidated basis in accordance with generally accepted accounting principles in the United States, excluding cash and cash equivalents, but including assets purchased with borrowed amounts.
The Incentive Fee consists of two components that are independent of each other, with the result that one component may be payable even if the other is not. A portion of the Incentive Fee is based on our income and a portion is based on our capital gains, each as described below. The portion of the Incentive Fee based on income is determined and paid quarterly in arrears, and equals (i) prior to the Listing Date, 100% of the pre- Incentive Fee net investment income in excess of a 1.5% quarterly “hurdle rate,” until the Adviser received 10% of the total pre-Incentive Fee net investment income for that calendar quarter and, for pre-Incentive Fee net investment income in excess of 1.67% quarterly, 10% of all remaining pre- Incentive Fee net investment income for that calendar quarter, and (ii) subsequent to the Listing Date, 100% of the pre- Incentive Fee net investment income in excess of a 1.5% quarterly “hurdle rate,” until the Adviser has received 17.5% of the total pre-Incentive Fee net investment income for that calendar quarter and, for pre-Incentive Fee net investment income in excess of 1.82% quarterly, 17.5% of all remaining pre-Incentive Fee net investment income for that calendar quarter. The 100% “catch-up” provision for pre-Incentive Fee net investment income in excess of the 1.5% “hurdle rate” is intended to provide the Adviser with an Incentive Fee of (i) prior to the Listing Date, 10% on all pre- Incentive Fee net investment income when that amount equals 1.67% in a calendar quarter (6.67% annualized), and (ii) subsequent to the Listing Date, 17.5% on all pre-Incentive Fee net investment income when that amount equals 1.82% in a calendar quarter (7.27% annualized), which, in each case, is the rate at which catch-up is achieved. Once the “hurdle rate” is reached and catch-up is achieved, (i) prior to the Listing Date, 10% of any pre-Incentive Fee net investment income in excess of 1.67% in any calendar quarter is payable to the Adviser, and (ii) subsequent to the Listing Date, 17.5% of any pre-Incentive Fee net investment income in excess of 1.82% in any calendar quarter is payable to the Adviser.
Pre-Incentive Fee net investment income means dividends (including reinvested dividends), interest and fee income accrued by us during the calendar quarter, minus operating expenses for the calendar quarter (including the Management Fee, expenses payable under the Administration Agreement, and any interest expense and dividends paid on any issued and outstanding preferred stock, but excluding the Incentive Fee). Pre-Incentive Fee net investment income includes, in the case of investments with a deferred interest feature (such as original issue discount, debt instruments with pay-in-kind interest (“PIK”) and zero coupon securities), accrued income that we may not have received in cash. The Adviser is not obligated to return the Incentive Fee it receives on PIK interest that is later determined to be uncollectible in cash. Pre-Incentive Fee net investment income does not include any realized capital gains, realized capital losses or unrealized capital appreciation or depreciation.
To determine whether pre-Incentive Fee net investment income exceeds the hurdle rate, pre-Incentive Fee net investment income is expressed as a rate of return on the value of our net assets at the end of the immediately preceding calendar quarter. Because of the structure of the Incentive Fee, it is possible that we may pay an Incentive Fee in a calendar quarter in which we incur a loss. For example, if we receive pre-Incentive Fee net investment income in excess of the quarterly hurdle rate, we will pay the applicable Incentive Fee even if we have incurred a loss in that calendar quarter due to realized and unrealized capital losses. In addition, because the quarterly hurdle rate is calculated based on our net assets, decreases in our net assets due to realized or unrealized capital losses in any given calendar quarter may increase the likelihood that the hurdle rate is reached and therefore the likelihood that we will pay an Incentive Fee for that calendar quarter. Our net investment income used to calculate this component of the Incentive Fee is also included in the amount of our gross assets used to calculate the Management Fee because gross assets are total assets (including cash received) before deducting liabilities (such as declared dividend payments).
The following are graphical representations of the calculation of the income-related portion of the Incentive Fee:
Quarterly Incentive Fee on
Pre-Incentive Fee Net Investment Income
Prior to the Listing Date
(expressed as a percentage of the value of net assets)
| 0% | 1.5% | 1.67% | |||||||||||||||
| ← 0% → | ← 100% → | ← 10% → | |||||||||||||||
17
Quarterly Incentive Fee on
Pre-Incentive Fee Net Investment Income
Subsequent to the Listing Date
(expressed as a percentage of the value of net assets)
| 0% | 1.5% | 1.82% | |||||||||||||||
| ← 0% → | ← 100% → | ← 17.5% → | |||||||||||||||
Percentage of Pre-Incentive Fee Net Investment Income
Allocated to Quarterly Incentive Fee
The second component of the Incentive Fee, the “Capital Gains Incentive Fee,” payable at the end of each calendar year in arrears, equals, (i) prior to the Listing Date, 10% of cumulative realized capital gains from to the end of each calendar year, less cumulative realized capital losses and unrealized capital depreciation from the initial closing date to the end of each calendar year, and (ii) subsequent to the Listing Date, 17.5% of cumulative realized capital gains from the Listing Date to the end of each calendar year, less cumulative realized capital losses and unrealized capital depreciation from the Listing Date to the end of each calendar year. Each year, the fee paid for the Capital Gains Incentive Fee is net of the aggregate amount of any previously paid Capital Gains Incentive Fee for prior periods. We will accrue, but will not pay, a Capital Gains Incentive Fee with respect to unrealized appreciation because a Capital Gains Incentive Fee would be owed to the Adviser if we were to sell the relevant investment and realize a capital gain. The fees that are payable under the Investment Advisory Agreement for any partial period will be appropriately prorated. In no event will the Capital Gains Fee payable pursuant to the Investment Advisory Agreement be in excess of the amount permitted by the Advisers Act, including Section 205 thereof.
Limitations of Liability and Indemnification
The Adviser and its officers, managers, partners, agents, employees, controlling persons, members and any other person or entity affiliated with the Adviser, including without limitation its sole member, are not liable to us for any action taken or omitted to be taken by the Adviser in connection with the performance of any of its duties or obligations under the Investment Advisory Agreement or otherwise as our investment adviser (except to the extent specified in Section 36(b) of the 1940 Act, concerning loss resulting from a breach of fiduciary duty (as the same is finally determined by judicial proceedings) with respect to the receipt of compensation for services).
We will indemnify the Adviser and its officers, managers, partners, agents, employees, controlling persons, members and any other person or entity affiliated with the Adviser, including without limitation its general partner or managing member (collectively, the “Indemnified Parties”) and hold them harmless from and against all damages, liabilities, costs and expenses (including reasonable attorneys’ fees and amounts reasonably paid in settlement) incurred by the Indemnified Parties in or by reason of any pending, threatened or completed action, suit, investigation or other proceeding (including an action or suit by or in the right of us or our security holders) arising out of or otherwise based upon the performance of any of the Adviser’s duties or obligations under the Investment Advisory Agreement or otherwise as our investment adviser. However, the Indemnified Parties shall not be entitled to indemnification in respect of, any liability to us or our shareholders to which the Indemnified Parties would otherwise be subject by reason of criminal conduct, willful misfeasance, bad faith or gross negligence in the performance of the Adviser’s duties or by reason of the reckless disregard of the Adviser’s duties and obligations under the Investment Advisory Agreement.
Board Approval of the Investment Advisory Agreement
On May 5, 2025, the Board held an in-person meeting to consider and approve the continuation of the Investment Advisory Agreement and related matters. The Board was provided with the information it required to consider the Investment Advisory Agreement, including: (a) the nature, quality and extent of the advisory and other services to be provided to us by the Adviser; (b) comparative data with respect to advisory fees or similar expenses paid by other BDCs; (c) our projected operating expenses and expense ratio compared to BDCs with similar investment objectives; (d) any existing and potential sources of indirect income to the Adviser from its relationship with us and the profitability of that relationship; (e) information about the services to be performed and the personnel performing such services under the Investment Advisory Agreement; (f) the organizational capability and financial condition of the Adviser and its affiliates; and (g) the possibility of obtaining similar services from other third-party service providers or through an internally managed structure. Based on the information reviewed and the discussion thereof, the Board, including a majority of the non-interested directors, concluded that the investment advisory fee rates are reasonable in relation to the services provided and approved the continuation of the Investment Advisory Agreement as being in the best interests of our shareholders.
18
Administration Agreement
The description below of the Administration Agreement is only a summary and is not necessarily complete. The description set forth below is qualified in its entirety by reference to the Administration Agreement.
Under the terms of the Administration Agreement, the Adviser performs, or oversees the performance of, administrative services for us, which includes, but is not limited to, providing office space, equipment and office services, maintaining financial records, preparing reports to shareholders and reports filed with the SEC, managing the payment of expenses and the performance of administrative and professional services rendered by others, which could include employees of the Adviser or its affiliates. We will reimburse the Adviser for services performed for us pursuant to the terms of the Administration Agreement. In addition, pursuant to the terms of the Administration Agreement, the Adviser may delegate its obligations under the Administration Agreement to an affiliate or to a third party and we will reimburse the Adviser for any services performed for us by such affiliate or third party.
The Administration Agreement became effective on May 18, 2021 and the continuation of the Administration Agreement was approved by the Board on May 5, 2025. Unless earlier terminated as described below, the Administration Agreement will remain in effect for two years from the date it first became effective and from year-to-year thereafter if approved annually by a majority of the Board or by the holders of a majority of our outstanding voting securities and, in each case, a majority of the independent directors. We may terminate the Administration Agreement, without payment of any penalty, upon 60 days’ written notice. The decision to terminate the agreement may be made by a majority of the Board or the shareholders holding a Majority of the Outstanding Shares of our common stock. In addition, the Adviser may terminate the Administration Agreement, without payment of any penalty, upon 60 days’ written notice. To the extent that the Adviser outsources any of its functions we will pay the fees associated with such functions without profit to the Adviser.
The Administration Agreement provides that the Adviser and its affiliates’ respective officers, directors, members, managers, stockholders and employees are entitled to indemnification from us from and against any claims or liabilities, including reasonable legal fees and other expenses reasonably incurred, arising out of or in connection with our business and operations or any action taken or omitted on our behalf pursuant to authority granted by the Administration Agreement, except where attributable to willful misfeasance, bad faith or gross negligence in the performance of such person’s duties or reckless disregard of such person’s obligations and duties under the Administration Agreement as provided by Section 17(i) of the 1940 Act.
Payment of Our Expenses under the Investment Advisory and Administration Agreements
Except as specifically provided below, we anticipate that all investment professionals and staff of the Adviser, when and to the extent engaged in providing investment advisory and management services to us, and the base compensation, bonus and benefits, and the routine overhead expenses, of such personnel allocable to such services, will be provided and paid for by the Adviser. In addition, the Adviser shall be solely responsible for any placement or “finder’s” fees payable to placement agents engaged by the Company or its affiliates in connection with the offering of securities by the Company. We will bear our allocable portion of the costs of the compensation, benefits and related administrative expenses (including travel expenses) of our officers who provide operational and administrative services hereunder, their respective staffs and other professionals who provide services to us (including, in each case, employees of the Adviser or an affiliate) who assist with the preparation, coordination, and administration of the foregoing or provide other “back office” or “middle office” financial or operational services to us. We shall reimburse the Adviser (or its affiliates) for an allocable portion of the compensation paid by the Adviser (or its affiliates) to such individuals (based on a percentage of time such individuals devote, on an estimated basis, to our business affairs, in acting on our behalf and as otherwise set forth in the Administration Agreement). We also will bear all other costs and expenses of our operations, administration and transactions, including, but not limited to (i) investment advisory fees, including Management Fees and Incentive Fees, to the Adviser, pursuant to the Investment Advisory Agreement and the Administration Agreement; (ii) our allocable portion of overhead and other expenses incurred by the Adviser in performing its administrative obligations under the Investment Advisory Agreement and the Administration Agreement and (iii) all other costs and expenses of our operations and transactions including, without limitation, those relating to:
•the cost of our organization and any offerings;
•the cost of calculating our net asset value, including the cost of any third-party valuation services;
•the cost of effecting any sales and repurchases of the common stock and other securities;
•fees and expenses payable under any dealer manager agreements, if any;
•debt service and other costs of borrowings or other financing arrangements;
•costs of hedging;
•expenses, including travel expense, incurred by the Adviser, or members of the Investment Team, or payable to third parties, performing due diligence on prospective portfolio companies and, if necessary, enforcing our rights;
•escrow agent, transfer agent and custodial fees and expenses;
•fees and expenses associated with marketing efforts;
•federal and state registration fees, any stock exchange listing fees and fees payable to rating agencies;
19
•U.S. federal, state and local taxes;
•independent directors’ fees and expenses, including certain travel expenses;
•costs of preparing financial statements and maintaining books and records and filing reports or other documents with the SEC (or other regulatory bodies) and other reporting and compliance costs, including registration fees, listing fees and licenses, and the compensation of professionals responsible for the preparation of the foregoing;
•costs of any reports, proxy statements or other notices to shareholders (including printing and mailing costs);
•costs of any shareholder or director meetings and the compensation of personnel responsible for the preparation of the foregoing and related matters;
•commissions and other compensation payable to brokers or dealers;
•research and market data;
•fidelity bond, directors’ and officers’ errors and omissions liability insurance and other insurance premiums;
•direct costs and expenses of administration, including printing, mailing, long distance telephone and staff;
•fees and expenses associated with independent audits, outside legal and consulting costs;
•costs of winding up;
•costs incurred in connection with the formation or maintenance of entities or vehicles to hold our assets for tax or other purposes;
•extraordinary expenses (such as litigation or indemnification); and
•costs associated with reporting and compliance obligations under the 1940 Act and applicable federal and state securities laws.
We expect, but cannot ensure, that our general and administrative expenses will increase in dollar terms during periods of asset growth, but will decline as a percentage of total assets during such periods.
Affiliated Transactions
We may be prohibited under the 1940 Act from participating in certain transactions with our affiliates without prior approval of the directors who are not interested persons, and in some cases, the prior approval of the SEC. We rely on the Order to co-invest with other funds managed by the Adviser or certain affiliates in a manner consistent with our investment objective, positions, policies, strategies and restrictions as well as regulatory requirements and other pertinent factors. Pursuant to such Order, we are generally permitted to co-invest with certain of our affiliates if such co-investments are done on the same terms and at the same time, as further detailed in the Order. The Order requires that a “required majority” (as defined in Section 57(o) of the 1940 Act) of the Board make certain findings (1) in most instances when we co-invest with our affiliates in an issuer where our affiliate has an existing investment in the issuer, and (2) if we dispose of an asset acquired in a transaction under the Order unless the disposition is done on a pro rata basis. Pursuant to the Order, the Board will oversee our participation in the co-investment program. As required by the Order, we have adopted, and the Board has approved, policies and procedures reasonably designed to ensure compliance with the terms of the Order, and the Adviser and our Chief Compliance Officer will provide reporting to the Board.
License Agreement
We have also entered into a license agreement (the “License Agreement”) with an affiliate of Blue Owl, pursuant to which we were granted a non-exclusive license to use the name “Blue Owl.” Under the License Agreement, we have a right to use the Blue Owl name for so long as the Adviser or one of its affiliates remains our investment adviser. Other than with respect to this limited license, we have no legal right to the “Blue Owl” name or logo.
Employees
We do not currently have any employees and do not expect to have any employees. Services necessary for our business are provided by individuals who are employees of the Adviser or its affiliates, pursuant to the terms of the Investment Advisory Agreement and the Administration Agreement. Each of our executive officers is employed by the Adviser or its affiliates. Our day-to-day investment operations are managed by the Adviser. The services necessary for the origination and administration of our investment portfolio are provided by investment professionals employed by the Adviser or its affiliates. The Investment Team is focused on origination and transaction development and the ongoing monitoring of our investments. In addition, we reimburse the Adviser for the allocable portion of the compensation paid by the Adviser (or its affiliates) to our chief compliance officer and chief financial officer and their respective staffs (based on the percentage of time such individuals devote, on an estimated basis, to our business and affairs and as otherwise set forth in the Administration Agreement). See “— Investment Advisory Agreement” and “— Administration Agreement.”
20
Sustainability
Our and the Adviser’s sustainability efforts seek to enable positive outcomes for our investors and the communities in which we operate. We believe our Adviser’s sustainability efforts reflect strong leadership and oversight by Blue Owl’s senior management and Blue Owl’s Board and Blue Owl’s commitment to its priority areas.
Additionally, to integrate responsible investing practices firmwide, Blue Owl has a Responsible Investing Working Group (the “RI WG”), a cross-functional group across investment platforms, strategies and relevant business units. The RI WG members are senior representatives of their respective teams and are responsible for coordinating responsible investing-related efforts within their business units, as well as providing insights as it relates to their professional roles. The RI WG is chaired by our Blue Owl’s Chief Operating Officer and activities are managed by the Responsible Investing & ESG team.
Investing Responsibly
We and the Adviser recognize the importance of business relevant ESG issues and opportunities and are committed to the consideration of these factors in relation to our business operations and investment activities to manage risk and identify opportunities. Blue Owl adopted an ESG and responsible investing policy, which applies to all asset classes, industries and countries in which Blue Owl does business and the products it manages.
The Adviser believes that incorporating business relevant ESG factors into its corporate and investment activities has the potential to meaningfully contribute to our value. The Adviser strives to continuously strengthen its ability to mitigate, manage, and monitor relevant ESG risks and opportunities within our investment portfolios. When the Adviser considers potential investments on our behalf, it seeks to address the relevant ESG considerations, risks and potential rewards related to prospective investments. Further, the Adviser has processes designed to ensure compliance with applicable regulatory disclosure requirements, including ESG-related disclosure obligations.
The Adviser believes it is important to consider the multiple ways that climate risk may affect it as an asset manager. Blue Owl has designed an approach to identify, assess and prioritize potential climate-related risks across its operations and investment activity. The Adviser has considered recommendations from the Task Force on Climate-Related Financial Disclosures in the design and implementation of its climate risk management program, including topics related to governance, strategy, risk management and metrics.
Belonging
The Adviser seeks to foster a culture that fuels its ability to deliver results through private markets, attract and retain top talent and build strong partnerships. The Adviser’s values—mutual respect, excellence, constructive dialogue and one team—form the foundation of a culture where its employees are empowered to reach their full potential.
The following initiatives help cultivate connection, opportunity and impact for the Adviser’s employees:
•Employee Resource Groups are open to all employees and aim to create an environment of belonging for all. These groups are employee-initiated and employee-led.
•Blue Owl Celebrates is a series that honors various heritage and affinity months throughout the year by highlighting dynamic guest speakers, small businesses and resources for learning and action.
•Blue Owl partners with industry organizations to offer its employees access to resources, memberships, events, networks and opportunities for professional development, as well as utilizing the organizations’ job boards to recruit candidates.
•Finally, Blue Owl’s suite of benefits includes primary and secondary parental leave, family planning benefits and stipend and flexible work schedules.
Citizenship
Blue Owl takes its role as a corporate citizen seriously and aims to contribute to meaningful causes to support the communities in which it operates and resides. Blue Owl is committed to building a robust citizenship program that is integrated, community-centered, and employee-enriched, including:
•Blue Owl Leads Together, its global employee volunteerism and giving program, allows employees to engage with one another and with the communities in which we live and work; and
•Blue Owl Gives, which advances Blue Owl’s philanthropic mission—unlocking opportunity by powering access to college, to careers, and to capital—through strategic nonprofit partnerships.
Regulation as a Business Development Company
We have elected to be regulated as a BDC under the 1940 Act. The 1940 Act contains prohibitions and restrictions relating to transactions between BDCs and their affiliates (including any investment advisers or sub-advisers), principal underwriters and affiliates of those affiliates or underwriters and requires that a majority of the directors be persons other than “interested persons,” as that term is defined in the 1940 Act.
21
In addition, the 1940 Act provides that we may not change the nature of our business so as to cease to be, or to withdraw our election as, a BDC unless approved by a Majority of the Outstanding Shares of our common stock.
We are not generally able to issue and sell our common stock at a price below net asset value per share. We may, however, issue and sell our common stock, or warrants, options or rights to acquire our common stock, at a price below the then-current net asset value of our common stock if (1) our board of directors determines that such sale is in our best interests and the best interests of our shareholders, and (2) our shareholders have approved our policy and practice of making such sales within the preceding 12 months. In any such case, the price at which our securities are to be issued and sold may not be less than a price which, in the determination of our board of directors, closely approximates the market value of such securities.
A BDC generally is required to meet an asset coverage ratio of the value of total assets to senior securities, which include all of our borrowings and any preferred stock the BDC may issue in the future, of at least 200%. However, certain provisions of the 1940 Act allowed a BDC to increase the maximum amount of leverage it may incur from an asset coverage ratio of 200% to an asset coverage ratio of 150%, if certain requirements are met. This means that generally, a BDC can borrow up to $1 for every $1 of investor equity or, if certain requirements are met and it reduces its asset coverage ratio, it can borrow up to $2 for every $1 of investor equity. On August 7, 2018, the Adviser, as our sole shareholder, approved a proposal that allows us to reduce our asset coverage ratio to 150%. As a result, effective on August 8, 2018, our asset coverage requirement applicable to senior securities was reduced from 200% to 150%.
We may also be prohibited under the 1940 Act from knowingly participating in certain transactions with our affiliates without the prior approval of our board of directors who are not interested persons and, in some cases, prior approval by the SEC.
We may invest up to 100% of our assets in securities acquired directly from issuers in privately negotiated transactions. With respect to such securities, we may, for the purpose of public resale, be deemed an “underwriter” as that term is defined in the Securities Act.
Our intention is to not write (sell) or buy put or call options to manage risks associated with the publicly traded securities of our portfolio companies, except that we may enter into hedging transactions to manage the risks associated with interest rate or currency fluctuations. However, we may purchase or otherwise receive warrants to purchase the common stock of our portfolio companies in connection with acquisition financing or other investments. Similarly, in connection with an acquisition, we may acquire rights to require the issuers of acquired securities or their affiliates to repurchase them under certain circumstances.
We do not intend to acquire securities issued by any investment company that exceed the limits imposed by the 1940 Act and the rules and regulations thereunder. Under these limits we generally cannot acquire more than 3% of the voting stock of any registered investment company, invest more than 5% of the value of our total assets in the securities of one investment company, or invest more than 10% of the value of our total assets in the securities of more than one investment company unless certain conditions are met. If we invest in securities issued by investment companies, if any, it should be noted that such investments might subject our shareholders to additional expenses as they will be indirectly responsible for the costs and expenses of such companies.
None of our investment policies are fundamental, and thus may be changed without shareholder approval.
Qualifying Assets. Under the 1940 Act, a BDC may not acquire any asset other than assets of the type listed in Section 55(a) of the 1940 Act, which are referred to as qualifying assets, unless, at the time the acquisition is made, qualifying assets represent at least 70% of the company’s total assets. The principal categories of qualifying assets relevant to our business are any of the following:
(1)Securities purchased in transactions not involving any public offering from the issuer of such securities, which issuer (subject to certain limited exceptions) is an eligible portfolio company, or from any person who is, or has been during the preceding 13 months, an affiliated person of an eligible portfolio company, or from any other person, subject to such rules as may be prescribed by the SEC. An eligible portfolio company is defined in the 1940 Act as any issuer which:
(a)is organized under the laws of, and has its principal place of business in, the United States;
(b)is not an investment company (other than a small business investment company wholly owned by the business development company) or a company that would be an investment company but for certain exclusions under the 1940 Act; and
(c)satisfies any of the following:
(i)does not have any class of securities that is traded on a national securities exchange;
(ii)has a class of securities listed on a national securities exchange, but has an aggregate market value of outstanding voting and non-voting common equity of less than $250 million;
(iii)is controlled by a business development company or a group of companies including a business development company and the business development company has an affiliated person who is a director of the eligible portfolio company; or
(iv)is a small and solvent company having total assets of not more than $4 million and capital and surplus of not less than $2 million.
22
(2)Securities of any eligible portfolio company controlled by us.
(3)Securities purchased in a private transaction from a U.S. issuer that is not an investment company or from an affiliated person of the issuer, or in transactions incident thereto, if the issuer is in bankruptcy and subject to reorganization or if the issuer, immediately prior to the purchase of its securities was unable to meet its obligations as they came due without material assistance other than conventional lending or financing arrangements.
(4)Securities of an eligible portfolio company purchased from any person in a private transaction if there is no ready market for such securities and we already own 60% of the outstanding equity of the eligible portfolio company.
(5)Securities received in exchange for or distributed on or with respect to securities described in (1) through (4) above, or pursuant to the exercise of warrants or rights relating to such securities.
(6)Cash, cash equivalents, U.S. government securities or high-quality debt securities maturing in one year or less from the time of investment.
In addition, a BDC must be operated for the purpose of making investments in the types of securities described in (1), (2) or (3) above.
Control, as defined by the 1940 Act, is presumed to exist where a BDC beneficially owns more than 25% of the outstanding voting securities of the portfolio company, but may exist in other circumstances based on the facts and circumstances.
The regulations defining qualifying assets may change over time. We may adjust our investment focus as needed to comply with and/or take advantage of any regulatory, legislative, administrative or judicial actions.
Managerial Assistance to Portfolio Companies. A BDC must have been organized and have its principal place of business in the United States and must be operated for the purpose of making investments in the types of securities described above. However, in order to count portfolio securities as qualifying assets for the purpose of the 70% test, the BDC must either control the issuer of the securities or must offer to make available to the issuer of the securities (other than small and solvent companies described above) significant managerial assistance; except that, where the BDC purchases such securities in conjunction with one or more other persons acting together, one of the other persons in the group may make available such managerial assistance. Where the BDC purchases such securities in conjunction with one or more other persons acting together, the BDC will satisfy this test if one of the other persons in the group makes available such managerial assistance, although this may not be the sole method by which the BDC satisfies the requirement to make available managerial assistance. Making available significant managerial assistance means, among other things, any arrangement whereby the BDC, through its directors, officers or employees, offers to provide and, if accepted, does so provide, significant guidance and counsel concerning the management, operations or business objectives and policies of a portfolio company through monitoring of portfolio company operations, selective participation in board and management meetings, consulting with and advising a portfolio company’s officers or other organizational or financial guidance.
Temporary Investments. Pending investment in other types of qualifying assets, as described above, our investments can consist of cash, cash equivalents, U.S. government securities or high quality debt securities maturing in one year or less from the time of investment, which are referred to herein, collectively, as temporary investments, so that 70% of our assets would be qualifying assets. We may invest in highly rated commercial paper, U.S. government agency notes, U.S. Treasury bills or in repurchase agreements relating to such securities that are fully collateralized by cash or securities issued by the U.S. government or its agencies. A repurchase agreement involves the purchase by an investor, such as us, of a specified security and the simultaneous agreement by the seller to repurchase it at an agreed-upon future date and at a price that is greater than the purchase price by an amount that reflects an agreed-upon interest rate. Consequently, repurchase agreements are functionally similar to loans. There is no percentage restriction on the proportion of our assets that may be invested in such repurchase agreements. However, the 1940 Act and certain diversification tests in order to qualify as a RIC for federal income tax purposes typically require us to limit the amount we invest with any one counterparty. Accordingly, we do not intend to enter into repurchase agreements with a single counterparty in excess of this limit. The Adviser will monitor the creditworthiness of the counterparties with which we may enter into repurchase agreement transactions.
Warrants and Options. Under the 1940 Act, a BDC is subject to restrictions on the issuance, terms and amount of warrants, options or rights to purchase shares of capital stock that it may have outstanding at any time. Under the 1940 Act, we may generally only offer warrants provided that (i) the warrants expire by their terms within ten years, (ii) the exercise or conversion price is not less than the current market value at the date of issuance, (iii) shareholders authorize the proposal to issue such warrants, and the Board approves such issuance on the basis that the issuance is in our best interests and the shareholders best interests and (iv) if the warrants are accompanied by other securities, the warrants are not separately transferable unless no class of such warrants and the securities accompanying them has been publicly distributed. The 1940 Act also provides that the amount of our voting securities that would result from the exercise of all outstanding warrants, as well as options and rights, at the time of issuance may not exceed 25% of our outstanding voting securities. In particular, the amount of capital stock that would result from the conversion or exercise of all outstanding warrants, options or rights to purchase capital stock cannot exceed 25% of the BDC’s total outstanding shares of capital stock.
Senior Securities; Coverage Ratio. We are generally permitted, under specified conditions, to issue multiple classes of indebtedness and one class of stock senior to our common stock if immediately after such borrowing or issuance, the ratio of our total
23
assets (less total liabilities other than indebtedness represented by senior securities) to our total indebtedness represented by senior securities plus preferred stock, if any, is at least 200% (or 150%, if certain requirements are met). This means that generally, a BDC can borrow up to $1 for every $1 of investor equity or, if certain requirements are met and it reduces its asset coverage ratio, it can borrow up to $2 for every $1 of investor equity. On August 7, 2018, our Adviser, as our sole shareholder, approved the application of the modified asset coverage requirements set forth in Section 61(a)(2) of the Investment Company Act, as amended by the Small Business Credit Availability Act. As a result, effective August 8, 2018, our asset coverage ratio applicable to senior securities was reduced from 200% to 150%.
In addition, while any senior securities remain outstanding, we will be required to make provisions to prohibit any dividend distribution to our shareholders on our capital stock or the repurchase of such capital stock unless we meet the applicable asset coverage ratios at the time of the dividend distribution or repurchase. We will also be permitted to borrow amounts up to 5% of the value of our total assets for temporary or emergency purposes, which borrowings would not be considered senior securities. For a discussion of the risks associated with leverage, see “ITEM 1A. RISK FACTORS — Risks Related to Business Development Companies — Regulations governing our operation as a BDC and RIC affect our ability to raise capital and the way in which we raise additional capital or borrow for investment purposes, which may have a negative effect on our growth. As a BDC, the necessity of raising additional capital may expose us to risks, including risks associated with leverage.”
Codes of Ethics. We and the Adviser have each adopted a code of ethics pursuant to Rule 17j-1 under the 1940 Act and Rule 204A-1 under the Advisers Act, respectively, that establishes procedures for personal investments and restricts certain personal securities transactions. Personnel subject to the code are permitted to invest in securities for their personal investment accounts, including securities that may be purchased or held by us, so long as such investments are made in accordance with the code’s requirements. Our code of ethics is available on the EDGAR Database on the SEC’s website at http://www.sec.gov. You may also obtain copies of the code of ethics after paying a duplicating fee, by electronic request at the following e-mail address: publicinfo@sec.gov.
Affiliated Transactions. We may be prohibited under the 1940 Act from conducting certain transactions with our affiliates without the prior approval of our directors who are not interested persons and, in some cases, the prior approval of the SEC. We rely on the Order to co-invest with other funds managed by the Adviser or certain affiliates in a manner consistent with our investment objective, positions, policies, strategies and restrictions as well as regulatory requirements and other pertinent factors. Pursuant to the Order, we are generally permitted to co-invest with certain of our affiliates if such co-investments are done on the same terms and at the same time, as further detailed in the Order. The Order requires that a “required majority” (as defined in Section 57(o) of the 1940 Act) of the Board makes certain findings (1) in most instances when we co-invest with our affiliates in an issuer where our affiliate has an existing investment in the issuer, and (2) if we dispose of an asset acquired in a transaction under the Order unless the disposition is done on a pro rata basis. Pursuant to the Order, the Board will oversee our participation in the co-investment program. As required by the Order, we have adopted, and the Board has approved, policies and procedures reasonably designed to ensure compliance with the terms of the Order, and the Adviser and our Chief Compliance Officer will provide reporting to the Board. The Blue Owl Credit Advisers’ allocation policies seek to ensure equitable allocation of investment opportunities between us and/or other funds managed by the Adviser or its affiliates. As a result of the Order, there could be significant overlap in our investment portfolio and the investment portfolio of other Blue Owl Credit Clients and other Blue Owl clients that avail themselves of the Order. In addition, the Adviser and its affiliates are permitted to allocate an investment to a number of products across platforms that it views as appropriate for the particular investment objectives, strategies and characteristics of such products.
Cancellation of the Investment Advisory Agreement. Under the 1940 Act, the Investment Advisory Agreement will automatically terminate in the event of its assignment, as defined in the 1940 Act, by the Adviser. See "Investment Advisory Agreement - Term." The Investment Advisory Agreement may be terminated at any time, without penalty, by us upon not less than 60 days’ written notice to the Adviser and may be terminated at any time, without penalty, by the Adviser upon 60 days’ written notice to us. The holders of a Majority of our Outstanding Shares may also terminate the Investment Advisory Agreement without penalty upon not less than 60 days’ written notice. Unless terminated earlier as described above, the Investment Advisory Agreement will remain in effect for a period of two years from the date it first became effective and will remain in effect from year-to-year thereafter if approved annually by our Board or by the affirmative vote of the holders of a Majority of our Outstanding Shares, and, in either case, if also approved by a majority of our directors who are not “interested persons” as defined in the 1940 Act.
Other. We have adopted an investment policy that complies with the requirements applicable to us as a BDC. We expect to be periodically examined by the SEC for compliance with the 1940 Act, and will be subject to the periodic reporting and related requirements of the Exchange Act.
We are also required to provide and maintain a bond issued by a reputable fidelity insurance company to protect against larceny and embezzlement. Furthermore, as a BDC, we are prohibited from protecting any director or officer against any liability to our shareholders arising from willful misfeasance, bad faith, gross negligence or reckless disregard of the duties involved in the conduct of such person’s office.
24
We are also required to designate a chief compliance officer and to adopt and implement written policies and procedures reasonably designed to prevent violation of the federal securities laws and to review these policies and procedures annually for their adequacy and the effectiveness of their implementation.
We are not permitted to change the nature of our business so as to cease to be, or to withdraw our election as, a BDC unless approved by a Majority of the Outstanding Shares of our common stock.
We intend to operate as a non-diversified management investment company; however, we are currently and may, from time to time, in the future, be considered a diversified management investment company pursuant to the definitions set forth in the 1940 Act.
Rule 18f-4 under the 1940 Act requires BDCs that use derivatives to, among other things, comply with a value-at-risk leverage limit, adopt a derivatives risk management program, and implement certain testing and board reporting procedures. Rule 18f-4 exempts BDCs that qualify as “limited derivatives users” from the aforementioned requirements, provided that these BDCs adopt written policies and procedures that are reasonably designed to manage the BDC’s derivatives risks and comply with certain recordkeeping requirements. We currently qualify as a “limited derivatives user” and expect to continue to do so. We have adopted a derivatives policy and comply with the recordkeeping requirements of Rule 18f-4.
Our common stock is listed on the NYSE under the symbol “OTF.” As a listed company on the NYSE, we are subject to various listing standards including corporate governance listing standards. We believe we are in material compliance with these rules.
Certain U.S. Federal Income Tax Considerations
The following discussion is a general summary of certain U.S. federal income tax considerations applicable to us and to an investment in our common stock. This discussion does not purport to be a complete description of the income tax considerations applicable to such an investment. For example, this discussion does not describe tax consequences that we have assumed to be generally known by investors or certain considerations that may be relevant to certain types of holders subject to special treatment under U.S. federal income tax laws, including persons who hold our common stock as part of a straddle or a hedging, integrated or constructive sale transaction, persons subject to the alternative minimum tax, tax-exempt organizations, insurance companies, brokers or dealers in securities, pension plans and trusts, persons whose functional currency is not the U.S. dollar, certain former citizens or long-term residents of the United States, regulated investment companies, real estate investment trusts, personal holding companies, persons required to accelerate the recognition of gross income as a result of such income being recognized on an applicable financial statement, persons who acquire an interest in the Company in connection with the performance of services, and financial institutions. Such persons should consult with their own tax advisers as to the U.S. federal income tax consequences of an investment in our common stock, which may differ substantially from those described herein. This discussion assumes that shareholders hold our common stock as capital assets (within the meaning of the Code).
The discussion is based upon the Code, U.S. Department of Treasury (“Treasury”) regulations, and administrative and judicial interpretations, each as of the date of this report and all of which are subject to change at any time, possibly retroactively, which could affect the continuing validity of this discussion and could be applied in a manner that adversely impact shareholders. We have not sought and will not seek any ruling from the IRS regarding any matter discussed herein. Prospective investors should be aware that, although we intend to adopt positions we believe are in accord with current interpretations of the U.S. federal income tax laws, the IRS may not agree with the tax positions taken by us and that, if challenged by the IRS, our tax positions might not be sustained by the courts. This summary does not discuss any aspects of U.S. estate tax, U.S. state or local taxation or non-U.S. taxation. It also does not discuss the special treatment under U.S. federal income tax laws that could result if we invested in tax-exempt securities or certain other investment assets.
For purposes of this discussion, a “U.S. Shareholder” is a beneficial owner of our common stock that is for U.S. federal income tax purposes:
•a citizen or individual resident of the United States;
•a corporation (or other entity treated as a corporation) organized in or under the laws of the United States or of any political subdivision thereof;
•a trust that is subject to the supervision of a court within the United States and the control of one or more U.S. persons or that has a valid election in effect under applicable U.S. Treasury Regulations to be treated as a U.S. person; or
•an estate, the income of which is subject to U.S. federal income tax regardless of its source.
A “Non-U.S. Shareholder” is a beneficial owner of our common stock that is neither a U.S. Shareholder nor a partnership for U.S. tax purposes.
If a partnership (including an entity or arrangement treated as a partnership for U.S. federal income tax purposes) holds our common stock, the U.S. federal income tax treatment of a partner in the partnership will generally depend upon the status of the partner and the activities of the partnership. Any partner of a partnership holding our common stock should consult his, her or its own tax advisers with respect to the U.S. federal income tax consequences of the purchase, ownership and disposition of such shares.
25
Tax matters are very complicated and the tax consequences to an investor of an investment in our common stock will depend on the facts of his, her or its particular situation. You should consult your own tax adviser regarding the specific tax consequences of the ownership and disposition of shares of our common stock to you, including tax reporting requirements, the applicability of U.S. federal, state and local tax laws and non-U.S. tax laws, eligibility for the benefits of any applicable income tax treaty and the effect of any possible changes in the tax laws.
Taxation as a Regulated Investment Company
We have elected to be treated and intend to qualify each year as a RIC under the Code; however, no assurance can be given that we will be able to maintain our RIC tax treatment. As a RIC, we generally will not be subject to U.S. federal income tax at corporate rates on any ordinary income or capital gains that we timely distribute to our shareholders as dividends. To qualify as a RIC, we must, among other things, meet certain source-of-income and asset diversification requirements (as described below). In addition, in order to obtain RIC tax benefits, we generally must distribute to our shareholders, for each taxable year, at least 90% of our “investment company taxable income,” which is generally our net ordinary income plus the excess of realized net short-term capital gains over realized net long-term capital losses (the “Annual Distribution Requirement”).
If we qualify as a RIC, and satisfy the Annual Distribution Requirement, then we will not be subject to U.S. federal income tax on the portion of our investment company taxable income and net capital gain that we timely distribute (or are deemed to distribute) to our shareholders as dividends. We will be subject to U.S. federal income tax imposed at corporate rates on any income or capital gains not distributed (or deemed distributed) to our shareholders.
We will be subject to a nondeductible 4% U.S. federal excise tax on certain undistributed income unless we distribute in a timely manner an amount at least equal to the sum of (i) 98% of our net ordinary income for each calendar year, (ii) 98.2% of the amount by which our capital gain exceeds our capital loss (adjusted for certain ordinary losses) for the one-year period ending October 31 in that calendar year and (iii) certain undistributed amounts from previous years on which we paid no U.S. federal income tax (the “Excise Tax Distribution Requirement”). While we intend to distribute sufficient income and capital gains to our shareholders in each taxable year in order to avoid imposition of this 4% U.S. federal excise tax, there can be no assurance that we will be successful in avoiding entirely the imposition of this tax.
In order to qualify as a RIC for U.S. federal income tax purposes, we must, among other things:
•continue to qualify as a BDC under the 1940 Act at all times during each taxable year;
•derive in each taxable year at least 90% of our gross income from dividends, interest, payments with respect to loans of certain securities, gains from the sale or other taxable disposition of stock or other securities or foreign currencies, net income derived from an interest in certain “qualified publicly traded partnerships” (as defined in the Code), or other income derived with respect to our business of investing in such stock or securities (the “90% Income Test”); and
•diversify our holdings so that at the end of each quarter of the taxable year:
•at least 50% of the value of our assets consists of cash, cash equivalents, U.S. government securities, securities of other RICs, and other securities if such other securities of any one issuer do not represent more than 5% of the value of our assets or more than 10% of the outstanding voting securities of the issuer; and
•no more than 25% of the value of our assets is invested in the (i) securities, other than U.S. government securities or securities of other RICs, of one issuer, (ii) securities, other than securities of other RICs, of two or more issuers that are controlled, as determined under applicable Code rules, by us and that are engaged in the same or similar or related trades or businesses or (iii) securities of one or more “qualified publicly traded partnerships” (collectively, the “Diversification Tests”).
For U.S. federal income tax purposes, we may be required to include in our taxable income certain amounts that we have not yet received in cash. For example, if we hold debt obligations that are treated under applicable tax rules as having original issue discount (such as debt instruments with PIK interest or, in certain cases, increasing interest rates or issued with warrants), we must include in our taxable income in each taxable year a portion of the original issue discount that accrues over the life of the obligation, regardless of whether cash representing such income is received by us in the same taxable year. We may also have to include in our taxable income other amounts that we have not yet received in cash, such as PIK interest and deferred loan origination fees that are paid after origination of the loan. Because any original issue discount or other amounts accrued will be included in our investment company taxable income for the year of accrual, we may be required to make a distribution to our shareholders in order to satisfy the Annual Distribution Requirement, even though we will not have received the corresponding cash amount.
26
Although we do not presently expect to do so, we are authorized to borrow funds, to sell assets and to make taxable distributions of our stock and debt securities in order to satisfy the Annual Distribution Requirement. Our ability to dispose of assets to meet our distribution requirements may be limited by (i) the illiquid nature of our portfolio and/or (ii) other requirements relating to our status as a RIC, including the Diversification Tests. If we dispose of assets in order to meet the Annual Distribution Requirement or the Excise Tax Distribution Requirement, we may make such dispositions at times that, from an investment standpoint, are not advantageous. If we are unable to obtain cash from other sources to satisfy the Annual Distribution Requirement, we may fail to qualify for tax treatment as a RIC and become subject to U.S. federal income tax.
Under the 1940 Act, we are not permitted to make distributions to our shareholders while our debt obligations and other senior securities are outstanding unless certain “asset coverage” tests are met. If we are prohibited from making distributions, we may fail to qualify for tax treatment as a RIC and become subject to U.S. federal income tax.
Certain of our investment practices may be subject to special and complex U.S. federal income tax provisions that may, among other things: (i) disallow, suspend or otherwise limit the allowance of certain losses or deductions; (ii) convert lower taxed long-term capital gain into higher taxed short-term capital gain or ordinary income; (iii) convert an ordinary loss or a deduction into a capital loss (the deductibility of which is more limited); (iv) cause us to recognize income or gain without a corresponding receipt of cash; (v) adversely affect the time as to when a purchase or sale of securities is deemed to occur; (vi) adversely alter the characterization of certain complex financial transactions; and (vii) generate income that will not be qualifying income for purposes of the 90% Income Test described above. We will monitor our transactions and may make certain tax decisions in order to mitigate the potential adverse effect of these provisions.
A RIC is limited in its ability to deduct expenses in excess of its “investment company taxable income” (which is, generally, ordinary income plus the excess of net short-term capital gains over net long-term capital losses). If our expenses in a given year exceed our investment company taxable income, we would experience a net operating loss for that year. However, a RIC is not permitted to carry forward net operating losses to subsequent years. In addition, expenses can be used only to offset investment company taxable income, not net capital gain. A RIC may not use any net capital losses (that is, realized capital losses in excess of realized capital gains) to offset the RIC’s investment company taxable income, but may carry forward such losses indefinitely, and use them to offset capital gains. Due to these limits on the deductibility of expenses, over the course of one or more taxable years we may have, for U.S. federal income tax purposes, aggregate taxable income that we are required to distribute and that is taxable to our shareholders even if such income is greater than the aggregate net income we actually earned during those years. Such required distributions may be made from our cash assets or by liquidation of investments, if necessary. We may realize gains or losses from such liquidations. In the event we realize net capital gains from such transactions, a shareholder may receive a larger capital gain distribution than it would have received in the absence of such transactions.
Investment income received from sources within foreign countries, or capital gains earned by investing in securities of foreign issuers, may be subject to foreign income taxes withheld at the source. In this regard, withholding tax rates in countries with which the United States does not have a tax treaty may be 35% or more. The United States has entered into tax treaties with many foreign countries that may entitle us to a reduced rate of or exemption from withholding tax on investment income and gains. The effective rate of foreign tax cannot be determined at this time since the amount of our assets to be invested within various countries is not now known. We do not anticipate being eligible for the special election that allows a RIC to treat foreign income taxes paid by such RIC as paid by its stockholders.
If we purchase shares in a “passive foreign investment company,” or PFIC, we may be subject to U.S. federal income tax on any “excess distribution” received on, or any gain from the disposition of such shares. Additional charges in the nature of interest generally will be imposed on us in respect of deferred taxes arising from any such excess distributions or gains. This additional tax and interest may apply even if we make a distribution as a taxable dividend by us to our shareholders in an amount equal to (1) any excess distribution, or (2) the gain from the dispositions of such shares. If we invest in a PFIC and elect to treat the PFIC as a “qualified electing fund”, or QEF, in lieu of the foregoing requirements, we will be required to include in income each year our proportionate share of the ordinary earnings and net capital gain of the QEF, even if such income is not distributed by the QEF. Alternatively, we may be able to elect to mark-to-market at the end of each taxable year our shares in a PFIC; in this case, we will recognize as ordinary income any increase in the value of such shares and as ordinary loss any decrease in such value to the extent that any such decrease does not exceed prior increases included in our income. Under either election, we may be required to recognize income in excess of distributions from PFICs and our proceeds from dispositions of PFIC stock during that year, and such income will nevertheless be subject to the Annual Distribution Requirement and will be taken into account for purposes of the Excise Tax Distribution Requirement. We intend to limit and/or manage our holdings in PFICs to minimize our liability for any taxes and related interest charges.
27
If we hold more than 10% of the shares in a foreign corporation that is treated as a controlled foreign corporation, or “CFC,” we may be treated as receiving a deemed distribution (taxable as ordinary income) each year from such foreign corporation in an amount equal to our pro rata share of certain of the corporation’s income for the tax year (including both ordinary earnings and capital gains), whether or not the corporation makes an actual distribution during such year. In general, a foreign corporation will be classified as a CFC if more than 50% of the shares of the corporation, measured by reference to combined voting power or value, is owned (directly, indirectly or by attribution) by U.S. Shareholders. A “U.S. Shareholder,” for this purpose, is any U.S. person that possesses (actually or constructively) 10% or more of the combined voting power of all classes of shares of a corporation or 10% or more of the total value of all classes of shares of a corporation. If we are treated as receiving a deemed distribution from a CFC, we will be required to include such distribution in our investment company taxable income regardless of whether we receive any actual distributions from such CFC, and such income will be subject to the Annual Distribution Requirement and will be taken into account for purposes of the Excise Tax Distribution Requirement
Income inclusions from a QEF or a CFC will be “good income” for purposes of the 90% Income Test provided that they are derived in connection with our business of investing in stocks and securities or the QEF or the CFC distributes such income to us in the same taxable year to which the income is included in our income.
Foreign exchange gains and losses realized by us in connection with certain transactions involving non-dollar debt securities, certain foreign currency futures contracts, foreign currency option contracts, foreign currency forward contracts, foreign currencies, or payables or receivables denominated in a foreign currency are subject to Code provisions that generally treat such gains and losses as ordinary income and losses and may affect the amount, timing and character of distributions to our stockholders. Any such transactions that are not directly related to our investment in securities (possibly including speculative currency positions or currency derivatives not used for hedging purposes) could, under future Treasury regulations, produce income not among the types of “qualifying income” from which a RIC must derive at least 90% of its annual gross income.
In accordance with certain applicable Treasury regulations and guidance published by the IRS, a RIC that is publicly offered may treat a distribution of its own stock as fulfilling its RIC distribution requirements if each stockholder may elect to receive his or her entire distribution in either cash or stock of the RIC, subject to a limitation that the aggregate amount of cash to be distributed to all stockholders must be at least 20% of the aggregate declared distribution. If too many stockholders elect to receive cash, the cash available for distribution must be allocated among stockholders electing to receive cash (with the balance of the distribution paid in stock). In no event will any stockholder, electing to receive cash, receive less than the lesser of (a) the portion of the distribution such stockholder elected to receive in cash, or (b) an amount equal to his or her entire distribution times the percentage limitation on cash available for distribution. If these and certain other requirements are met, for U.S. federal income tax purposes, the amount of the dividend paid in stock will be equal to the amount of cash that could have been received instead of stock. We have no current intention of paying dividends in shares of our stock in accordance with these Treasury regulations or published guidance.
If we fail to qualify for treatment as a RIC, and certain relief provisions are not applicable, we will be subject to U.S. federal income tax on all of our taxable income (including our net capital gains) imposed at regular corporate rates. We would not be able to deduct distributions to our shareholders, nor would they be required to be made. Distributions, including distributions of net long-term capital gain, would generally be taxable to our shareholders as ordinary dividend income to the extent of our current and accumulated earnings and profits. Subject to certain holding period and other limitations under the Code, our corporate shareholders would be eligible to claim a dividend received deduction with respect to such dividend and our non-corporate shareholders would generally be able to treat such dividends as “qualified dividend income,” which is subject to reduced rates of U.S. federal income tax. Distributions in excess of our current and accumulated earnings and profits would be treated first as a return of capital to the extent of the shareholder’s adjusted tax basis, and any remaining distributions would be treated as a capital gain. In order to requalify as a RIC, in addition to the other requirements discussed above, we would be required to distribute all of our previously undistributed earnings attributable to the period we failed to qualify as a RIC by the end of the first year that we intend to requalify as a RIC. If we fail to requalify as a RIC for a period greater than two taxable years, we may be subject to U.S. federal income tax at regular corporate rates on any net built-in gains with respect to certain of our assets (i.e., the excess of the aggregate gains, including items of income, over aggregate losses that would have been realized with respect to such assets if we had been liquidated) that we elect to recognize on requalification or when recognized over the next five years.
Proxy Voting Policies and Procedures
We have delegated our proxy voting responsibility to the Adviser. The Proxy Voting Policies and Procedures of the Adviser are described below. The guidelines are reviewed periodically by the Adviser and our non-interested directors, and, accordingly, are subject to change.
As an investment adviser registered under the Advisers Act, the Adviser has a fiduciary duty to act solely in the best interests of its clients. As part of this duty, the Adviser recognizes that it must vote client securities in a timely manner free of conflicts of interest and in the best interests of its clients. These policies and procedures for voting proxies for the Adviser’s investment advisory clients are intended to comply with Section 206 of, and Rule 206(4)-6 under, the Advisers Act.
28
Proxy Policies
The Adviser will seek to vote all proxies relating to our portfolio securities in the best interest of our shareholders. The Adviser reviews on a case-by-case basis each proposal submitted to a shareholder vote to determine its impact on the portfolio securities held by the Company. Although the Adviser will generally vote against proposals that may have a negative impact on its clients’ portfolio securities, the Adviser may vote for such a proposal if there exists compelling long-term reasons to do so.
The Adviser’s proxy voting decisions are made by senior officers who are responsible for monitoring each of our investments. To ensure that the Adviser’s vote is not the product of a conflict of interest, the Adviser requires that: (i) anyone involved in the decision making process disclose to the Adviser’s chief compliance officer any potential conflict that he or she is aware of and any contact that he or she has had with any interested party regarding a proxy vote; and (ii) employees involved in the decision-making process or vote administration are prohibited from revealing how the Adviser intends to vote on a proposal in order to reduce any attempted influence from interested parties.
Proxy Voting Records
You may obtain information about how the Adviser voted proxies by making a written request for proxy voting information to: Blue Owl Technology Finance Corp., Attention: Investor Relations, 399 Park Avenue, 37th Floor, New York, NY 10022, or by calling Blue Owl Technology Finance Corp. at (212) 419-3000.
Privacy Policy
We are committed to maintaining the confidentiality, integrity and security of non-public personal information relating to investors. The following information is provided to help you understand what personal information we collect, how we protect that information and why, in certain cases, we may share information with select other parties.
Generally, we do not collect any non-public personal information other than certain biographical information which is used only so that we can service your account, send you annual reports, proxy statements, and other information required by law. With regard to this information, we maintain physical, electronic and procedural safeguards designed to protect the non-public personal information of our investors.
We may share information that we collect regarding an investor with certain of our service providers for legitimate business purposes, for example, in order to process trades or mail information to investors. In addition, we may disclose information that we collect regarding an investor as required by law or in connection with regulatory or law enforcement inquiries.
Reporting Obligations
We will furnish our shareholders with annual reports containing audited financial statements, quarterly reports, and such other periodic reports as we determine to be appropriate or as may be required by law.
We make available free of charge on our website (https://www.blueowltechnologyfinance.com/) our annual reports on Form 10-K, quarterly reports on Form 10-Q and our current reports on Form 8-K, and amendments to these reports. The SEC also maintains a website (www.sec.gov) that contains such information. The reference to our website is an inactive textual reference only and the information contained on our website is not a part of this Form 10-K.
Item 1A. Risk Factors
Investing in our securities involves a number of significant risks. You should consider carefully the following information before making an investment in our securities. The risks below are not the only risks we face. Additional risks and uncertainties not
presently known to us or not presently deemed material by us may also impair our operations and performance. If any of the following events occur, our business, financial condition and results of operations could be materially and adversely affected.
The following is a summary of the principal risks that you should carefully consider before investing in our securities.
We are subject to risks related to macroeconomic factors.
•Difficult market and geopolitical conditions could have a significant adverse effect on our business, financial condition and results of operations.
•Capital markets disruption and economic uncertainty could have a material adverse effect on our business, financial condition or results of operations.
•Future increases in inflation may adversely affect the business, results of operations and financial condition of our portfolio companies.
•Fluctuations in interest rates could have a material adverse effect on our business and that of our portfolio companies.
We are subject to risks related to our business and operations.
•The lack of liquidity in our investments may adversely affect our business.
29
•We borrow money, which magnifies the potential for gain or loss and may increase the risk of investing in us.
•Defaults and provisions under our current borrowings or any future borrowing facility or notes may adversely affect our business, financial condition, results of operations and cash flows.
•If we are unable to obtain additional debt financing, or if our borrowing capacity is materially reduced, our business could be materially adversely affected.
•Our ability to achieve our investment objective depends on our Adviser’s ability to manage and support our investment process. If our Adviser were to lose a significant number of its key professionals, or terminate the Investment Advisory Agreement, our ability to achieve our investment objective could be significantly harmed.
•Our ability to achieve our investment objective also depends to a significant extent upon Blue Owl’s relationships with corporations, financial institutions and investment firms, the inability of Blue Owl to maintain or develop these relationships, or the failure of these relationships to generate investment opportunities, could adversely affect our business.
•We may face increasing competition for investment opportunities, which could delay further deployment of our capital, reduce returns and result in losses.
•Our investment portfolio is recorded at fair value as determined in good faith by our Adviser in accordance with procedures approved by our Board and, as a result, there is and will be uncertainty as to the value of our portfolio investments.
•We have adopted a policy to invest, under normal circumstances, at least 80% of the value of our assets in technology-related companies.
•Our Board may change our operating policies and strategies without prior notice or shareholder approval, the effects of which may be adverse to our shareholders.
•Cybersecurity risks and cyber data security incidents could adversely affect our business by causing a disruption to our operations, a compromise or corruption of our confidential information and confidential information in our possession and damage to our business relationships.
•Use of AI technologies by us could lead to the exposure of our data or other adverse effects and increase competitive, operational, legal, and regulatory risks in ways that we cannot predict.
•We are subject to risks in using custodians, counterparties, administrators and other agents.
We are subject to risks related to our Adviser and its affiliates.
•Our Adviser and its affiliates, including our officers and some of our directors, may face conflicts of interest caused by compensation arrangements with us and our affiliates, which could result in increased risk-taking or speculative investments, or cause our Adviser to use substantial leverage.
•The time and resources that individuals associated with our Adviser devote to us may be diverted, and we may face additional competition due to, among other things, the fact that neither our Adviser nor its affiliates is prohibited from raising money for or managing another entity that makes the same types of investments that we target.
•Our Adviser and its affiliates may face conflicts of interest with respect to services performed for their respective other accounts and clients or issuers in which we may invest.
•We may be obligated to pay our Adviser incentive fees even if we incur a net loss due to a decline in the value of our portfolio and even if our earned interest income is not payable in cash.
•Our ability to enter into transactions with our affiliates is restricted.
We are subject to risks related to business development companies.
•The requirement that we invest a sufficient portion of our assets in qualifying assets could preclude us from investing in accordance with our current business strategy; conversely, the failure to invest a sufficient portion of our assets in qualifying assets could result in our failure to maintain our status as a BDC.
•Regulations governing our operation as a BDC and RIC affect our ability to raise capital and the way in which we raise additional capital or borrow for investment purposes, which may have a negative effect on our growth. As a BDC, the necessity of raising additional capital may expose us to risks, including risks associated with leverage.
We are subject to risks related to our investments.
•Our investments in portfolio companies may be risky, and we could lose all or part of our investments.
•We have invested and may continue to invest through joint ventures, partnerships and other special purpose vehicles and our investments through these vehicles may entail greater risks, or risks that we otherwise would not incur, if we otherwise made such investments directly.
•Defaults by our portfolio companies could jeopardize a portfolio company’s ability to meet its obligations under the debt or equity investments that we hold which could harm our operating results.
30
•Subordinated liens on collateral securing debt investments that we may make to portfolio companies may be subject to control by senior creditors with first priority liens. If there is a default, the value of the collateral may not be sufficient to repay in full both the first priority creditors and us.
•We generally will not control the business operations of our portfolio companies and, due to the illiquid nature of our holdings in our portfolio companies, we may not be able to dispose of our interests in our portfolio companies.
•We and our portfolio companies are, and will continue to be, exposed to risks associated with changes in interest rates.
•International investments create additional risks.
•Our investment strategy focuses on technology companies, which are subject to many risks, including volatility, intense competition, shortened product life cycles, changes in regulatory and governmental programs and periodic downturns, and an investor could lose all or part of its investment.
We are subject to risks related to an investment in our common stock.
•The market value of our common stock may fluctuate significantly.
•The amount of any distributions we may make on our common stock is uncertain. We may not be able to pay distributions to shareholders, or be able to sustain distributions at any particular level, and our distributions per share, if any, may not grow over time, and our distributions per share may be reduced. We have not established any limits on the extent to which we may use borrowings, if any, and we may use sources other than from cash flows from operations to fund distributions (which may reduce the amount of capital we ultimately invest in portfolio companies).
We are subject to risks related to an investment in our unsecured notes.
•Our unsecured notes are effectively subordinated to any secured indebtedness we have currently incurred or may incur in the future.
•Our unsecured notes are structurally subordinated to the indebtedness and other liabilities of our subsidiaries.
•A downgrade, suspension or withdrawal of the credit rating assigned by a rating agency to us or our notes, if any, or change in the debt markets, could cause the liquidity or market value of our unsecured notes to decline significantly.
We are subject to risks related to U.S. federal income tax.
•We cannot predict how new tax legislation will affect us, our investments, or our stockholders, and any such legislation could adversely affect our business.
•We will be subject to U.S. federal income tax imposed at corporate rates if we are unable to maintain our tax treatment as a RIC under Subchapter M of the Code.
•We may have difficulty paying our required distributions if we recognize income before or without receiving cash representing such income.
We are subject to general risks.
•Changes in laws or regulations governing our operations may adversely affect our business or cause us to alter our business strategy.
•Heightened scrutiny of the financial services industry by regulators may materially and adversely affect our business.
Macroeconomic Factors
Difficult market and geopolitical conditions could have a significant adverse effect on our business, financial condition and results of operations.
Our business, financial conditions and results of operations may be affected by conditions and trends in the global financial markets and the global economic and political climate relating to, among other things, fluctuations in interest rates, the availability and cost of credit, future increases in inflation, economic uncertainty, changes in laws (including laws and regulations relating to our taxation, taxation of our clients and applicable to alternative asset managers), trade policies, commodity prices, tariffs (including retaliatory tariffs), currency exchange rates and controls, political elections and administration transitions, and national and international political events (including contract terminations or funding pauses, government agency closures, prolonged government shutdowns, wars and other forms of conflict, terrorist acts, and security operations), work stoppages, labor shortages and labor disputes, supply chain disruptions and catastrophic events such as fires, floods, earthquakes, tornadoes, hurricanes and global health pandemics.
Changes in trade policies, including the imposition of new tariffs or increases in existing tariffs between the United States, Mexico, Canada, China or other countries, or reactionary measures in response thereto including retaliatory tariffs, legal challenges, or currency manipulation, could adversely affect the market conditions in which we operate. These factors are outside of our control and
31
may negatively impact the businesses in which we invest directly or indirectly and, in turn, could have a material adverse impact on our business, operating results and financial condition. We monitor developments and seek to manage our investments in a manner consistent with achieving our investment objective, but there can be no assurance that we will be successful in doing so.
Global financial markets have experienced heightened volatility in recent periods, including as a result of economic and political events in or affecting the world’s major economies, such as the ongoing wars and conflicts between Russia and Ukraine, as well as continued political and social unrest in Venezuela, the Middle East and regions of North Africa. Concerns over economic recession, future increases in inflation, interest rate volatility, fluctuations in oil and gas prices resulting from global production and demand levels and geopolitical tension, have exacerbated market volatility. Market volatility has been further exacerbated by social unrest, changes regarding immigration and work permit policies and other political and security concerns both in the United States and across various international regions. Due to interrelationships within the global financial markets, our business may be adversely affected by such issues both within and outside of the directly affected regions.
During periods of difficult market conditions or slowdowns, which may be across one or more industries, sectors or geographies, the companies in which we invest may experience decreased revenues, financial losses, credit rating downgrades, difficulty in obtaining access to financing and increased funding costs. During such periods, those companies may also have difficulty in pursuing growth strategies, expanding their businesses and operations and be unable to meet their debt service obligations or other expenses as they become due, including obligations and expenses payable us. Negative financial results in our portfolio companies could have a material adverse effect on our business, financial condition, cash flows and results of operations and could cause the market value of our common shares and/or debt securities to decline.
Capital markets disruption and economic uncertainty could have a material adverse effect on our business, financial condition or results of operations.
In recent years, the U.S. corporate debt markets have been impacted by inflation. Uncertain market conditions caused by increased inflation or other conditions may make it difficult to extend the maturity of or refinance our existing indebtedness or obtain new indebtedness with similar terms and any failure to do so could have a material adverse effect on our business. The debt capital that will be available to us in the future, if at all, may be at a higher cost and on less favorable terms and conditions than what we currently experience, including being in an elevated interest rate environment. If we are unable to raise or refinance debt, then our equity investors may not benefit from the potential for increased returns on equity resulting from leverage and we may be limited in our ability to make new commitments or to fund existing commitments to our portfolio companies. An inability to extend the maturity of, or refinance, our existing indebtedness or obtain new indebtedness could have a material adverse effect on our business, financial condition or results of operations.
Significant disruption or volatility in the capital markets may also have a negative effect on the valuations of our investments. While most of our investments are not publicly traded, applicable accounting standards require us to assume as part of our valuation process that our investments are sold in a principal market to market participants (even if we plan on holding an investment through its maturity). Significant disruption or volatility in the capital markets may also affect the pace of our investment activity and the potential for liquidity events involving our investments. Thus, the illiquidity of our investments may make it difficult for us to sell such investments to access capital if required, and as a result, we could realize significantly less than the value at which we have recorded our investments if we were required to sell them for liquidity purposes. An inability to raise or access capital could have a material adverse effect on our business, financial condition or results of operations and cause our net asset value to decline. In addition, unfavorable economic conditions may require us to modify the payment terms of our investments, including changes in “payment in kind” or “PIK” interest provisions and/or cash interest rates, and also could increase our funding costs, limit our access to the capital markets or result in a decision by lenders not to extend credit to us on terms we deem acceptable.
Future increases in inflation may adversely affect the business, results of operations and financial condition of our portfolio companies.
Certain of our portfolio companies operate in industries that have been, or may be, impacted by inflation. Ongoing inflationary pressures have increased the costs of labor, energy and raw materials and have adversely affected consumer spending, economic growth and our portfolio companies’ operations. If such portfolio companies are unable to pass any increases in the costs of their operations along to their customers, it could adversely affect their operating results. Such conditions would increase the risk of default on their obligations as a borrower. In addition, any projected future decreases in our portfolio companies’ operating results due to inflation could adversely impact the fair value of those investments. Any decreases in the fair value of our investments could result in future unrealized losses and therefore reduce our net assets resulting from operations. Any decreases in the fair value of our investments could result in future realized or unrealized losses.
Fluctuations in interest rates could have a material adverse effect on our business and that of our portfolio companies.
Fluctuations in interest rates could have a dampening effect on overall economic activity, the financial condition of our portfolio companies and the financial condition of the end customers who ultimately create demand for the capital we supply, all of which could negatively affect our business, financial condition or results of operations. In addition, lower interest rates may increase prepayment
32
risk for our portfolio company investments with higher interest rates. The Federal Reserve decreased the federal funds rate three times in 2025. Although the Federal Reserve has signaled the potential for additional federal funds rate cuts, there remains uncertainty around the rate and timing of decreases. Uncertainty surrounding future Federal Reserve actions may have a material effect on our business making it particularly difficult for us to obtain financing at attractive rates, impacting our ability to execute on our growth strategies or future acquisitions.
Risks Related to Our Business
The lack of liquidity in our investments may adversely affect our business.
We may acquire a significant percentage of our investments from privately held companies in directly negotiated transactions. Substantially all of these investments are subject to legal and other restrictions on resale or are otherwise less liquid than exchange-listed securities or other securities for which there is an active trading market.
We typically would be unable to exit these investments unless and until the portfolio company has a liquidity event such as a sale, refinancing, or initial public offering.
The illiquidity of our investments may make it difficult or impossible for us to sell such investments if the need arises. In addition, if we are required to liquidate all or a portion of our portfolio quickly, we may realize significantly less than the value at which we have previously recorded our investments, which could have a material adverse effect on our business, financial condition and results of operations.
Moreover, investments purchased by us that are liquid at the time of purchase may subsequently become illiquid due to events relating to the issuer, market events, economic conditions or investor perceptions.
We borrow money, which magnifies the potential for gain or loss and may increase the risk of investing in us.
The use of borrowings, also known as leverage, increases the volatility of investments by magnifying the potential for gain or loss on invested equity capital. We currently borrow under our credit facilities and have issued or assumed other senior securities, and in the future may borrow from, or issue additional senior securities to, banks, insurance companies, funds, institutional investors and other lenders and investors. Holders of these senior securities have fixed-dollar claims on our assets that are superior to the claims of our shareholders. If the value of our assets decreases, leverage would cause our net asset value to decline more sharply than it otherwise would have if we did not employ leverage. Similarly, any decrease in our income would cause net income to decline more sharply than it would have had we not borrowed. Such a decline could negatively affect our ability to service our debt or make distributions to our shareholders. In addition, our shareholders will bear the burden of any increase in our expenses as a result of our use of leverage, including interest expenses and any increase in the base management or incentive fees payable to our Adviser attributable to the increase in assets purchased using leverage. There can be no assurance that a leveraging strategy will be successful.
Our ability to service any borrowings that we incur will depend largely on our financial performance and will be subject to prevailing economic conditions and competitive pressures. Moreover, the management fee will be payable based on our average gross assets excluding cash and cash equivalents but including assets purchased with borrowed amounts, which may give our Adviser an incentive to use leverage to make additional investments. See “—Our Adviser and its affiliates, including our officers and some of our directors, may face conflicts of interest caused by compensation arrangements with us and our affiliates, which could result in increased risk-taking or speculative investments, or cause our Adviser to use substantial leverage.” The amount of leverage that we employ will depend on our Adviser’s and our Board’s assessment of market and other factors at the time of any proposed borrowing. We cannot assure you that we will be able to obtain credit at all or on terms acceptable to us, which could affect our return on capital. However, to the extent that we use leverage to finance our assets, our financing costs will reduce cash available for distributions to shareholders. Moreover, we may not be able to meet our financing obligations and, to the extent that we cannot, we risk the loss of some or all of our assets to liquidation or sale to satisfy the obligations. In such an event, we may be forced to sell assets at significantly depressed prices due to market conditions or otherwise, which may result in losses.
In addition to having fixed-dollar claims on our assets that are superior to the claims of our common shareholders, obligations to lenders may be secured by a first priority security interest in our portfolio of investments and cash.
As a BDC, generally, the ratio of our total assets (less total liabilities other than indebtedness represented by senior securities) to our total indebtedness represented by senior securities plus any preferred stock, if any, must be at least 200%; however, the Small Business Credit Availability Act has modified the 1940 Act by allowing a BDC to increase the maximum amount of leverage it may incur from an asset coverage ratio of 200% to an asset coverage ratio of 150%, if certain requirements are met. On August 7, 2018, our Adviser, as our sole initial shareholder, approved the application of the modified asset coverage requirements set forth in Section 61(a)(2) of the 1940 Act, as amended by the Small Business Credit Availability Act. As a result, effective August 8, 2018, our asset coverage ratio applicable to senior securities was reduced from 200% to 150%, and the risks associated with an investment in us may increase. If this ratio declines below 150%, we cannot incur additional debt and could be required to sell a portion of our investments
33
to repay some indebtedness when it may be disadvantageous to do so. This could have a material adverse effect on our operations, and we may not be able to service our debt or make distributions.
The following table illustrates the effect of leverage on returns from an investment in our common stock assuming various annual returns on our portfolio, net of expenses. Leverage generally magnifies the return of shareholders when the portfolio return is positive and magnifies their losses when the portfolio return is negative. The calculations in the table below are hypothetical, and actual returns may be higher or lower than those appearing in the table below.
| Assumed Return on Our Portfolio (Net of Expenses) | |||||||||||||||||||||||||||||
| -10% | -5% | 0% | 5% | 10% | |||||||||||||||||||||||||
Corresponding return to common shareholder(1) | - | - | - | ||||||||||||||||||||||||||
(1)Assumes, as of December 31, 2025, (i) $14.7 billion in total assets, (ii) $6.3 billion in outstanding indebtedness, (iii) $8.0 billion in net assets and (iv) weighted average interest rate, excluding fees (such as fees on undrawn amounts and amortization of financing costs) of 6.0%.
See “ITEM 7 — MANAGEMENT’S DISCUSSION AND ANALYSIS OF FINANCIAL CONDITION AND RESULTS OF OPERATIONS — Financial Condition, Liquidity and Capital Resources” for more information regarding our borrowings.
Defaults and provisions under our current borrowings or any future borrowing facility or notes may adversely affect our business, financial condition, results of operations and cash flows.
Our borrowings may include customary covenants, including certain limitations on our incurrence of additional indebtedness and on our ability to make distributions to our shareholders, or redeem, repurchase or retire shares of stock, upon the occurrence of certain events and certain financial covenants related to asset coverage and liquidity and other maintenance covenants, as well as customary events of default. In the event we default under the terms of our current or future borrowings, our business could be adversely affected as we may be forced to sell a portion of our investments quickly and prematurely at what may be disadvantageous prices to us in order to meet our outstanding payment obligations and/or support working capital requirements under the terms of our current or future borrowings, any of which would have a material adverse effect on our business, financial condition, results of operations and cash flows. An event of default under the terms of our current or any future borrowings could result in an accelerated maturity date for all amounts outstanding thereunder, and in some instances, lead to a cross-default under other borrowings. This could reduce our liquidity and cash flow and impair our ability to grow our business.
Any security interests and/or negative covenants required by a credit facility we enter into or notes we issue may limit our ability to create liens on assets to secure additional debt and may make it difficult for us to restructure or refinance indebtedness at or prior to maturity or obtain additional debt or equity financing.
A credit facility may be backed by all or a portion of our loans and securities on which the lenders will have a security interest. We may pledge up to 100% of our assets and may grant a security interest in all of our assets under the terms of any debt instrument we enter into with lenders. If we were to default under the terms of any debt instrument, the agent for the applicable lenders would be able to assume control of the timing of disposition of any or all of our assets securing such debt, which would have a material adverse effect on our business, financial condition, results of operations and cash flows.
In addition, if our borrowing base under a credit facility were to decrease, we may be required to secure additional assets in an amount sufficient to cure any borrowing base deficiency. In the event that all of our assets are secured at the time of such a borrowing base deficiency, we could be required to repay advances under a credit facility or make deposits to a collection account, either of which could have a material adverse impact on our ability to fund future investments and to make distributions.
In addition, we may be subject to limitations as to how borrowed funds may be used, which may include restrictions on geographic and industry concentrations, loan size, payment frequency and status, average life, collateral interests and investment ratings, as well as regulatory restrictions on leverage which may affect the amount of funding that may be obtained. There may also be certain requirements relating to portfolio performance, including required minimum portfolio yield and limitations on delinquencies and charge-offs, a violation of which could limit further advances and, in some cases, result in an event of default.
Under the terms of the Revolving Credit Facility, we have agreed not to incur any additional secured indebtedness other than in certain limited circumstances in which the incurrence is permitted under the Revolving Credit Facility. In addition, if our borrowing base under the Revolving Credit Facility were to decrease, we would be required to secure additional assets or repay advances under
34
the Revolving Credit Facility which could have a material adverse impact on our ability to fund future investments and to make distributions.
In addition, under the terms of our credit facilities, we are subject to limitations as to how borrowed funds may be used, as well as regulatory restrictions on leverage which may affect the amount of funding that we may obtain. There may also be certain requirements relating to portfolio performance, a violation of which could limit further advances and, in some cases, result in an event of default. This could reduce our liquidity and cash flow and impair our ability to grow our business.
If we are unable to obtain additional debt financing, or if our borrowing capacity is materially reduced, our business could be materially adversely affected.
We may want to obtain additional debt financing, or need to do so upon maturity of our credit facilities, in order to obtain funds which may be made available for investments. Our credit facilities, notes and CLOs currently expire between June 2026 and January 2039. If we are unable to increase, renew or replace any such facilities and enter into new debt financing facilities or other debt financing on commercially reasonable terms, our liquidity may be reduced significantly. In addition, if we are unable to repay amounts outstanding under any such facilities and are declared in default or are unable to renew or refinance these facilities, we may not be able to make new investments or operate our business in the normal course. These situations may arise due to circumstances that we may be unable to control, such as lack of access to the credit markets, a severe decline in the value of the U.S. dollar, an economic downturn or an operational problem that affects us or third parties, and could materially damage our business operations, results of operations and financial condition. See “Capital markets disruption and economic uncertainty could have a material adverse effect on our business, financial condition or results of operations.”
Our ability to achieve our investment objective depends on our Adviser’s ability to manage and support our investment process. If our Adviser were to lose a significant number of its key professionals, or terminate the Investment Advisory Agreement, our ability to achieve our investment objective could be significantly harmed.
We do not have any employees. Additionally, we have no internal management capacity other than our appointed executive officers and will be dependent upon the investment expertise, skill and network of business contacts of our Adviser to achieve our investment objective. Our Adviser evaluates, negotiates, executes, monitors, and services our investments. Our success depends to a significant extent on the continued service and coordination of our Adviser, including its key professionals. The departure of a significant number of key professionals from our Adviser could have a material adverse effect on our ability to achieve our investment objective.
Our ability to achieve our investment objective also depends on the ability of our Adviser to identify, analyze, invest in, finance, and monitor companies that meet our investment criteria. Our Adviser’s capabilities in structuring the investment process, and providing competent, attentive and efficient services to us depend on the involvement of investment professionals of adequate number and sophistication to match the corresponding flow of transactions. Any failure to find, hire, train, supervise and manage new investment professionals could have a material adverse effect on our business, financial condition and results of operations.
In addition, the Investment Advisory Agreement has a termination provision that allows the agreement to be terminated by us on 60 days’ notice without penalty by the vote of a Majority of the Outstanding Shares of our common stock or by the vote of our independent directors and generally may be terminated at any time, without penalty, by our Adviser upon 60 days' notice to us. Furthermore, the Investment Advisory Agreement automatically terminates in the event of its assignment, as defined in the 1940 Act, by the Adviser. If the Adviser resigns or is terminated, or if we do not obtain the requisite approvals of shareholders and our Board to approve an agreement with the Adviser after an assignment, we may not be able to find a new investment adviser or hire internal management with similar expertise and ability to provide the same or equivalent services on acceptable terms prior to the termination of the Investment Advisory Agreement, or at all. If we are unable to do so quickly, our operations are likely to experience a disruption and costs under any new agreements that we enter into could increase. Our financial condition, business and results of operations, as well as our ability to meet our payment obligations under our indebtedness and pay distributions, are likely to be adversely affected, and the value of our common stock may decline.
Our ability to achieve our investment objective also depends to a significant extent upon Blue Owl’s relationships with corporations, financial institutions and investment firms, the inability of Blue Owl to maintain or develop these relationships, or the failure of these relationships to generate investment opportunities, could adversely affect our business.
Blue Owl depends on its relationships with corporations, financial institutions and investment firms, and we rely to a significant extent upon these relationships to provide us with potential investment opportunities. The investment management business is intensely competitive, with competition based on a variety of factors, including investment performance, business relationships, quality of service provided to clients, fund investor liquidity, fund terms (including fees and economic sharing arrangements), brand recognition and business reputation. If Blue Owl fails to maintain its reputation it may not be able to maintain its existing relationships
35
or develop new relationships or sources of investment opportunities, and we may not be able to grow our investment portfolio. In addition, there is no assurance that such relationships will generate investment opportunities for us.
Our cash and cash equivalents could be adversely affected if the financial institutions in which we hold our cash and cash equivalents fail.
We regularly maintain cash balances at third-party financial institutions in excess of the Federal Deposit Insurance Corporation insurance limits. If a depository institution fails to return these deposits or is otherwise subject to adverse conditions in the financial or credit markets, our access to invested cash or cash equivalents could be limited which adversely impact our results of operations or financial condition.
We may face increasing competition for investment opportunities, which could delay further deployment of our capital, reduce returns and result in losses.
We may compete for investments with other BDCs and investment funds (including registered investment companies, private equity funds and mezzanine funds), including the other Blue Owl Clients or other funds managed by our Adviser or its affiliates comprising Blue Owl’s Credit platform (including Blue Owl’s alternative credit products), the private funds managed by Blue Owl’s GP Strategic Capital platform, the funds and accounts managed by Blue Owl’s Real Assets platform, as well as traditional financial services companies such as commercial banks and other sources of funding. Moreover, alternative investment vehicles, such as hedge funds, continue to increase their investment focus in our target market of privately owned U.S. companies. We may experience increased competition from banks and investment vehicles who may continue to lend to the middle market. Additionally, the U.S. Federal Reserve and other bank regulators may periodically provide incentives to U.S. commercial banks to originate more loans to U.S. middle-market private companies. As a result of these market participants and regulatory incentives, competition for investment opportunities in privately owned U.S. companies is strong and may intensify. Many of our competitors are substantially larger and have considerably greater financial, technical, and marketing resources than we do. For example, some competitors may have a lower cost of capital and access to funding sources that are not available to us. In addition, some competitors may have higher risk tolerances or different risk assessments than us. These characteristics could allow our competitors to consider a wider variety of investments, establish more relationships and offer better pricing and more flexible structuring than we are able to do.
Numerous factors increase our competitive risks, including, but not limited to:
•Some of our competitors may have or are perceived to have more expertise or financial, technical, marketing and other resources and more personnel than we do;
•We may not perform as well as competitors’ funds or other available investment products;
•Some of our competitors have raised significant amounts of capital, and many of them have similar investment objectives to ours, which may create additional competition for investment opportunities;
•Some of our competitors may have lower fees or alternative fee arrangements;
•Some of our competitors may have a lower cost of capital and access to funding sources that are not available to us, which may create competitive disadvantages for us;
•Some of our competitors may have higher risk tolerances, different risk assessments or lower return thresholds than us, which could allow them to consider a wider variety of investments and to bid more aggressively than us or to agree to less restrictive legal terms and protections for investments that we want to make; and
•Some of our competitors may be subject to less regulation or fewer conflicts of interest and, accordingly, may have more flexibility to undertake and execute certain businesses or investments than we do, bear less compliance expense than we do or be viewed differently in the marketplace.
We may lose investment opportunities if we do not match our competitors’ pricing, terms, and investment structure criteria. If we are forced to match these competitors’ investment terms criteria, we may not be able to achieve acceptable returns on our investments or may bear substantial risk of capital loss. A significant increase in the number and/or the size of our competitors in our target market could force us to accept less attractive investment terms. Furthermore, many competitors are not subject to the regulatory restrictions that the 1940 Act imposes on us as a BDC or the source of income, asset diversification and distribution requirements we must satisfy to maintain our RIC tax treatment. The competitive pressures we face, and the manner in which we react or adjust to competitive pressures, may have a material adverse effect on our business, financial condition, results of operations, effective yield on investments, investment returns, leverage ratio, and cash flows. As a result of this competition, we may not be able to take advantage of attractive
36
investment opportunities from time to time. Also, we may not be able to identify and make investments that are consistent with our investment objective.
Our investment portfolio is recorded at fair value as determined in good faith by our Adviser in accordance with procedures approved by our Board and, as a result, there is and will be uncertainty as to the value of our portfolio investments.
Under the 1940 Act, we are required to carry our portfolio investments at market value or, if there is no readily available market value, at fair value as determined in accordance with procedures established by our Adviser and approved by our Board. There is not a public market or active secondary market for many of the types of investments in privately held companies that we hold and intend to make. Our investments may not be publicly traded or actively traded on a secondary market but, instead, may be traded on a privately negotiated over-the-counter secondary market for institutional investors, if at all. As a result, we will value these investments quarterly at fair value as determined in good faith in accordance with valuation policy and procedures approved by our Board.
The determination of fair value, and thus the amount of unrealized appreciation or depreciation we may recognize in any reporting period, is to a degree subjective, and our Adviser has a conflict of interest in determining fair value. We will value our investments quarterly at fair value as determined in good faith by our Adviser, based on, among other things, input of our Audit Committee and independent third-party valuation firm(s) engaged at the direction of our Adviser. The types of factors that may be considered in determining the fair values of our investments include the nature and realizable value of any collateral, the portfolio company’s ability to make payments and its earnings, the markets in which the portfolio company does business, comparison to publicly traded companies, discounted cash flow, current market interest rates and other relevant factors. Because such valuations, and particularly valuations of private securities and private companies, are inherently uncertain, the valuations may fluctuate significantly over short periods of time due to changes in current market conditions. The determinations of fair value in accordance with procedures approved by our Board may differ materially from the values that would have been used if an active market and market quotations existed for such investments. Our net asset value could be adversely affected if the determinations regarding the fair value of the investments were materially higher than the values that we ultimately realize upon the disposal of such investments.
We have adopted a policy to invest, under normal circumstances, at least 80% of the value of our assets in technology-related companies.
Any unrealized depreciation we experience on our portfolio may be an indication of future realized losses, which could reduce our income available for distribution.
As a BDC, we are required to carry our investments at market value or, if no market value is ascertainable, at the fair value as determined in good faith in accordance with procedures approved by our Board. Decreases in the market values or fair values of our investments relative to amortized cost will be recorded as unrealized depreciation. Any unrealized losses in our portfolio could be an indication of a portfolio company’s inability to meet its repayment obligations to us with respect to the affected loans. This could result in realized losses in the future and ultimately in reductions of our income available for distribution in future periods. In addition, decreases in the market value or fair value of our investments will reduce our net asset value. See “ITEM 7 — MANAGEMENT’S DISCUSSION AND ANALYSIS OF FINANCIAL CONDITION AND RESULTS OF OPERATIONS — Critical Accounting Policies — Investments at Fair Value.”
We are not limited with respect to the portion of our assets that may be invested in a single issuer.
Beyond the asset diversification requirements associated with our qualification as a RIC for U.S. federal income tax purposes, we do not have fixed guidelines for diversification. We have adopted a policy to invest, under normal circumstances, at least 80% of the value of our assets in technology-related companies. To the extent that we hold large positions in a small number of issuers, or within a particular industry, our net asset value may fluctuate as a result of changes in the issuer’s financial condition or the market’s assessment of the issuer. We may also be more susceptible to any single economic or regulatory occurrence or a downturn in particular industry in which we may invest significantly than a diversified investment company otherwise would be.
Cybersecurity risks and cyber data security incidents could adversely affect our business by causing a disruption to our operations, a compromise or corruption of our confidential information and confidential information in our possession and damage to our business relationships.
There has been an increase in the frequency and sophistication of the cyber and security threats we face, with attacks ranging from those common to businesses generally to those that are more advanced and persistent, which may target us because, as an alternative asset management firm, we hold confidential and other price sensitive information about existing and potential investments. Malicious cyber activity involving ransomware, extortion, business email compromise, social engineering and other security threats could
37
originate from a wide variety of sources, including cyber criminals, nation state hackers, hacktivists and other outside parties. Additionally, cyber-attacks and other security threats have become increasingly complex as a result of the emergence of new AI technologies, which are able to identify and target new vulnerabilities in information technology systems. As a result, we may face a heightened risk of a security breach or disruption with respect to confidential information resulting from an attack by computer hackers, foreign governments or cyber terrorists.
The efficient operation of our business is dependent on computer hardware and software systems, as well as data processing systems and the secure processing, storage and transmission of information, which, despite implementation of a variety of security measures, are vulnerable to security breaches and cyber-attacks. A cyber-attack is considered to be an intentional attack or an unintentional event or series of events and involves gaining unauthorized access to our information systems for purposes of misappropriating assets, stealing confidential information, corrupting data or causing operational disruption or otherwise compromising the confidentiality, integrity or availability of our systems or infrastructure. Some factors that could create a heightened risk of a cyber incident include the use of remote work tools and/or third-party service providers, including cloud-based service providers. In addition, we may be the target of social engineering, fraudulent emails or other targeted attempts to gain unauthorized access to proprietary or sensitive information. In addition to cyber-related threats, our and our affiliates’ information systems and those of our third-party service providers may be subject to failures or interruptions arising from other causes beyond our control, including sudden electrical or telecommunications outages, natural disasters such as earthquakes, tornadoes or hurricanes, disease pandemics, social unrest and geopolitical events including wars and acts of terrorism. Any such events could materially disrupt our operations and adversely affect our business and financial results. The result of any cyber-attack may include disrupted operations, including in our, our affiliates’, our investors’, our counterparties’, or third parties’ operations, misstated or unreliable financial data, fraudulent transfers or requests for transfers of money, liability for stolen or improperly accessed assets or information (including personal information), increased cybersecurity protection and insurance costs, litigation or damage to our business relationships and reputation, in each case causing our business and results of operations to suffer.
The rapid evolution and increased availability of artificial intelligence and machine learning technologies (collectively, “AI technologies”) may also intensify cybersecurity risks by making such attacks and other cybersecurity incidents more difficult to detect, contain, and mitigate. For example, threat actors could impersonate Blue Owl or its employees, including through the use of AI technologies. Such technologies make such impersonation more likely to occur or appear more credible.
As our reliance on technology has increased, so have the risks posed to our information systems, both internal and those provided by third-party service providers, including increased risks resulting from remote work. We cannot guarantee that third parties and infrastructure in our networks or our partners’ networks have not been compromised or that they do not contain exploitable defects or bugs that could result in a breach of or disruption to our information technology systems or the third-party information technology systems that support our services. Our ability to monitor these third parties’ information security practices is limited, and they may not have adequate information security measures in place. Outages of and interruptions to third-party software vendors’ services, including as a result of the termination of an agreement with a third-party service provider, have previously resulted in and could in the future result in temporary disruptions to our and our affiliates’ normal operations. We have implemented processes, procedures and internal controls designed to mitigate cybersecurity risks and cyber intrusions and rely on industry accepted security measures and technology to securely maintain confidential and proprietary information maintained on our information systems. However, these measures, as well as our increased awareness of the nature and extent of a risk of a cyber-attack, do not guarantee that a cyber-attack will not occur or that our financial results, operations or confidential information will not be negatively impacted by such an incident, especially because the cyber-attack techniques change frequently or are not recognized until launched and because cyber-attacks can originate from a wide variety of sources.
Cybersecurity risks are exacerbated by the rapidly increasing volume of highly sensitive data, including our proprietary business information and intellectual property, personally identifiable information of our clients and others and other sensitive information that we collect and store in our data centers, on our cloud environments and on our networks. Our products may also invest in strategic assets having a national or regional profile or in infrastructure assets, the nature of which could expose them to a greater risk of being subject to a terrorist attack or security breach than other assets or businesses. The secure processing, maintenance and transmission of this information are critical to our operations. A significant actual or potential theft, loss, corruption, exposure, fraudulent use or misuse of personally identifiable, proprietary business data or other sensitive information, by third parties, as a result of the negligence or malfeasance of third party service providers that have access to such confidential information or otherwise, non-compliance with our contractual or other legal obligations regarding such data or intellectual property or a violation of our privacy and security policies with respect to such data could result in significant remediation and other costs, fines, litigation or regulatory actions against us and significant reputational harm, any of which could harm our business and results of operations.
Use of AI technologies by us could lead to the exposure of our data or other adverse effects and increase competitive, operational, legal, and regulatory risks in ways that we cannot predict.
Recent technological advances in AI technologies, as well as the rapid growth and widespread use thereof, present risks to our business, products, portfolio companies and investments. AI technologies may result in significant and disruptive changes in companies, sectors or industries, including those in which we invest, and any such changes could render our Adviser’s underwriting models obsolete or create new and unpredictable operational, legal and/or regulatory risks. To the extent our competitors make more
38
We are subject to risks in using custodians, counterparties, administrators and other agents.
Our business is dependent on our and third parties’ communications and information systems. Any failure or interruption of those systems, including as a result of the termination of an agreement with any third-party service providers, could cause delays or other problems in our activities. Our financial, accounting, data processing, portfolio monitoring, backup or other operating systems and facilities may fail to operate properly or become disabled or damaged as a result of a number of factors including events that are wholly or partially beyond our control. There could be:
•sudden electrical or telecommunications outages;
•natural disasters such as earthquakes, tornadoes and hurricanes;
•disease pandemics;
•events arising from local or larger scale political or social matters, including terrorist acts;
•outages due to idiosyncratic issues at specific service providers; and
•cyber-attacks.
These events, in turn, could have a material adverse effect on our operating results and negatively affect the net asset value of our common stock and our ability to pay distributions to our shareholders.
Increased data protection regulation may result in increased complexities and risk in connection with the operation of our business.
Our business is highly dependent on information systems and technology. The costs related to cyber or other security threats or disruptions may not be fully insured or indemnified by other means. Cybersecurity has become a priority for regulators in the U.S. and around the world. The SEC has also particularly focused on cybersecurity, and we expect increased scrutiny of our policies and systems designed to manage our cybersecurity risks and our related disclosures as a result. In May 2024, the SEC adopted amendments to Regulation S-P that require covered institutions, such as investment companies, to develop, implement, and maintain written policies and procedures for an incident response program that is reasonably designed to detect, respond to, and recover from unauthorized access to or use of customer information. The amendments also require that the response program include procedures for, with certain limited exceptions, covered institutions to provide notice to individuals whose sensitive customer information was or is reasonably likely to have been accessed or used without authorization. The amendments took effect on August 2, 2024, and had a compliance deadline of December 3, 2025 for large entities. We also face and expect to continue to face increased costs to comply with the new SEC rules, including increased costs for cybersecurity training and management.
Many jurisdictions in which we operate have laws and regulations relating to data privacy, cybersecurity and/or information security to which we may be subject (collectively, “Privacy Laws”). Compliance with applicable Privacy Laws may require adhering to stringent legal and operational requirements, which could increase compliance costs for us and require the dedication of additional time and resources to compliance. A failure to comply with applicable Data Protection Legislation could result in fines, sanctions, enforcement actions or other penalties or reputational damage. In addition, the SEC has indicated in recent periods that one of its examination priorities for the Division of Examinations is to continue to examine cybersecurity procedures and controls, including testing the implementation of these procedures and controls.
There may be substantial financial penalties or fines for a failure to comply with applicable Privacy Laws (which may include insufficient security for our personal or other sensitive information). For example, failure to comply with Regulation (EU) 2016/679 (the “GDPR”) .
Our operations will be impacted by a growing movement to adopt comprehensive privacy and data protection laws, where such laws focus on privacy as an individual right in general. Further, the Company’s portfolio companies and/or each of their affiliates are subject to regulations related to privacy, data protection and information security in the jurisdictions in which they do business. Such laws and regulations vary from jurisdiction to jurisdiction, thus increasing costs, operational and legal burdens and the potential for significant liability on regulated entities.
39
Non-compliance with any applicable Privacy Laws represents a serious risk to our business. Some jurisdictions have also enacted laws requiring companies to notify individuals of data security breaches involving certain types of personal information. For example, the SEC’s most recent amendments to Regulation S-P require notification of affected customers no later than 30 days after becoming aware of a security incident that compromises their sensitive customer information. Breaches in security could potentially jeopardize our, our employees’ or our product investors’ or counterparties’ confidential or other information processed and stored in, or transmitted through, our computer systems and networks (or those of our third party vendors), or otherwise cause interruptions or malfunctions in our, our employees’, our product investors’, our counterparties’ or third parties’ operations, which could result in significant losses, increased costs, disruption of our business, liability to our product investors and other counterparties, fines or penalties, litigation, regulatory intervention or reputational damage, which could also lead to loss of product investors or clients.
We and our portfolio companies are subject to increasing scrutiny from certain investors, third party assessors, regulators and our shareholders with respect to ESG-related topics.
We and our portfolio companies face increasing scrutiny from certain investors, third party assessors that measure companies’ ESG performance, regulators and our shareholders related to ESG-related topics, including in relation to diversity and inclusion, human rights, environmental stewardship, support for local communities, corporate governance and transparency. For example, we and the companies in which we invest risk damage to our brands and reputations if we or they do not act (or are perceived to not act) responsibly either with respect to responsible investing processes or ESG-related practices. Adverse incidents related to ESG practices could impact the value of our brand or the companies in which we invest, or the cost of our or their operations and relationships with investors, all of which could adversely affect our business and results of operations. Further, there can be no assurance that any of our Adviser’s ESG initiatives, or commitments will meet the standards or expectations of our shareholders or other stakeholders. There can be no assurance that our Adviser will be able to accomplish any goals related to responsible investing or ESG practices, as statements regarding its ESG and responsible investing commitments and priorities reflect its current estimates, plans and/or aspirations and are not guarantees that it will be able to achieve them within the timelines announced or at all. Additionally, the Adviser may determine in its discretion that it is not feasible or practical to implement or complete certain aspects of its responsible investing program or ESG initiatives based on cost, timing or other considerations.
In recent years, certain investors have placed increasing importance on policies and practices related to responsible investing and ESG for the products to which they commit capital, and investors may decide not to commit capital to future fundraises based on their assessment of the Adviser’s approach to and consideration of ESG-related issues or risks. Similarly, a variety of organizations measure the performance of companies on ESG topics, and the results of these assessments are widely publicized. If the Adviser’s responsible investing or ESG-related practices or ratings do not meet the standards set by such investors or organizations, or if the Adviser receives a negative rating or assessment from any such organization, or if the Adviser fails, or is perceived to fail, to demonstrate progress toward its ESG priorities and initiatives, they may choose not to invest in us, and we may face reputational damage. Similarly, it is expected that investor and/or shareholder demands will require the Adviser to spend additional resources on and place continued importance on business relevant ESG factors in its review of prospective investments and management of existing ones. Devoting additional resources to our responsible investing or ESG-related practices could increase the amount of expenses we or our investments are required to bear. For example, collecting, measuring, and reporting ESG information and metrics can be costly, difficult and time consuming, is subject to evolving reporting standards, and can present numerous operational, reputational, financial, legal and other risks. To the extent our access to capital from investors focused on ESG ratings or ESG-related matters is impaired, we may not be able to maintain or increase the size of our existing products or raise sufficient capital for new products, which may adversely affect our revenues. Further, interest on the part of investors and regulators in ESG-related topics and themes and increased demand for, and scrutiny of, ESG-related disclosure by asset managers, has also increased the risk that asset managers could be perceived as, or accused of, making inaccurate or misleading statements regarding the ESG-related investment strategies of their and their funds’ responsible investing or ESG-related efforts or initiatives, or “greenwashing.” This risk may also materialize where ESG-related statements and/or disclosures made by our portfolio companies are materially inconsistent with our ESG-related statements or disclosures, including those made on a voluntary basis or pursuant to any applicable regulation, such as Regulation EU 2019/2088 on sustainability-related disclosures in the financial services sector (the “SFDR”). Such perception or accusation could damage our reputation, result in litigation or regulatory actions and adversely impact our ability to raise capital.
At the same time, various stakeholders may have differing approaches to responsible investing activities or divergent views on the consideration of ESG topics, including in the countries in which our Adviser operates and invests, as well as in the states and localities where our Adviser serves public sector clients. These differing views increase the risk that any action or lack thereof with respect to our Adviser’s consideration of responsible investing or ESG-related practices will be perceived negatively. Several states, the executive branch, federal agencies and Congress have enacted or proposed “anti-ESG” policies, legislation or initiatives, issued related legal opinions and engaged in related investigations and litigation. For example: (i) boycott bills target financial institutions that “boycott” or “discriminate against” companies in certain industries (e.g., energy and mining) and prohibit state entities from doing business with such institutions and/or investing the state’s assets (including pension plan assets) through such institutions and (ii) ESG investment prohibitions require that state entities or managers/administrators of state investments make investments based solely on pecuniary factors without consideration of ESG factors. If investors subject to such legislation view our responsible investing or ESG
40
practices as being in contradiction of such “anti-ESG” policies, legislation or legal opinions, such investors may not invest in us and it could negatively affect the results of operations, cash flow or price of our common stock. Further, asset managers have been subject to scrutiny related to ESG-focused industry working groups, initiatives and associations, including organizations advancing action to address climate change or climate-related risk. In addition, state attorneys general, among others, have asserted that the Supreme Court’s decision striking down race-based affirmative action in higher education in June 2023 should be analogized to private employment matters and private contract matters. Cases alleging discrimination based on similar arguments have been filed since that decision, with scrutiny of certain corporate DEI practices increasing throughout 2025. Additionally, in January 2025, the current U.S. Presidential administration signed a number of executive orders focused on DEI (the “Executive Orders”), which include a broad mandate to eliminate federal DEI programs and a caution to the private sector to end what may be viewed as illegal DEI discrimination and preferences. The Executive Orders have resulted in compliance investigations of private entities, including publicly traded companies, and changes to federal contracting regulations. If the Adviser does not successfully manage expectations across these varied stakeholder interests, it could erode stakeholder trust, impact our reputation and/or constrain our investment and fundraising opportunities. Such scrutiny of both ESG and DEI related practices could expose the Adviser to additional compliance obligations, the risk of litigation, investigations or challenges by federal or state authorities, result in reputational harm and/or discourage certain investors from investing in us.
We are subject to increasing scrutiny from regulators with respect to ESG-related issues and the regulatory disclosure landscape surrounding related topics continues to evolve.
Responsible investing, ESG practices and ESG-related disclosures have been the subject of increased focus by certain regulators, and regulatory initiatives related to ESG-specific topics that are applicable to us, our products and our products’ portfolio companies could adversely affect our business. There has been a growing regulatory interest across jurisdictions in improving transparency regarding the definition, measurement and disclosure of ESG factors in order to allow investors to validate and better understand sustainability claims, including in the United States, the European Union and the United Kingdom.
For example, the SEC sometimes reviews compliance with ESG commitments in examinations, and it has taken enforcement actions against registered investment advisers for not establishing adequate or consistently implementing ESG policies and procedures to meet ESG commitments to investors.
In addition, in October 2023, California enacted legislation that will ultimately require certain companies that (i) do business in California to publicly disclose their Scopes 1, 2 and 3 greenhouse gas emissions, with third party assurance of such data (Climate Corporate Data Accountability Act, or “SB 253”), and issue public reports on their climate-related financial risk and related mitigation measures (Climate-Related Financial Risk Act, or “SB 261”) and (ii) operate in California and make certain climate-related claims to provide enhanced disclosures around the achievement of climate-related claims, including the use of voluntary carbon credits to achieve such claims. Pending litigation against SB 253 and SB 261 creates ongoing uncertainty around the enforceability of related disclosure obligations and may result in additional compliance burdens, increased legal and compliance costs, and enhanced disclosure obligations. From a European perspective, the European Union has in place regulation aimed at increasing transparency for investors of sustainability-related policies, processes, performance and commitments which apply to certain of our products, including , without limitation: (a) the SFDR, for which most rules took effect beginning on March 10, 2021 and (b) Regulation (EU) 2020/852 on the establishment of a framework to facilitate sustainable investment, and amending the SFDR. In November 2025, the European Commission published a draft legislative proposal to revise SFDR to introduce, among others, new categories for sustainability-related financial products with related criteria that are required to be met for each category. Relatedly, the European Securities and Markets Authority (“ESMA”) has identified promoting transparency through effective sustainability disclosures and addressing greenwashing as one of its key priorities per ESMA’s sustainable finance roadmap and strategy. ESMA has also introduced guidelines on funds with ESG, impact, transition or sustainability-related terms in their names.
There are still some uncertainties regarding the operation of some of these requirements and how they might evolve, and an established market practice is still being developed in certain cases, which can lead to diverging implementation and/or operationalization, data gaps or methodological challenges which may affect our ability to collect relevant data. These regimes continue to evolve and there is still a lack of clarity and established practice around the approach to their supervision and enforcement, which may vary across national competent authorities. There is a risk that a development or reorientation in the regulatory requirements or market practice in this respect could be adverse to our investments if they are perceived to be less valuable as a consequence of, among other things, their carbon footprint or perceived “greenwashing.” Compliance with requirements of this nature may also increase risks relating to financial supervision and enforcement action. There is also a risk that market expectations in relation to the SFDR categorization of financial products, could adversely affect our ability to raise capital, especially from EEA investors.
In November 2023, the Sustainability Labelling and Disclosure of Sustainability-Related Financial Information Instrument 2023 (“SDR”) introduced sustainability disclosure requirements, voluntary investment product labels and an ‘anti-greenwashing’ rule. The anti-greenwashing rule applies to all UK-authorized firms in relation to sustainability-related claims made in their communications, and/or communications of financial promotions with, clients in the UK. The balance of the new regime is currently directed at UK investment funds and UK-regulated asset management firms as well as distributors of such funds.
41
In Asia, examples of ESG-related regulations including those by regulators in Singapore and Hong Kong have released guidelines for asset managers to integrate climate risk considerations in investment and risk management processes, together with enhanced disclosure and reporting and have also issued enhanced rules for certain ESG funds on general ESG risk management and disclosure.
As a result of these and other legislative and regulatory initiatives, we or the Adviser may be required to provide additional disclosure to our investors with respect to ESG matters. This exposes us to increased disclosure risks, for example due to a lack of available or credible data, and the potential for conflicting disclosures may also expose us to an increased risk of misstatement litigation or miss-selling allegations. Failure to manage these risks could result in a material adverse effect on our business in a number of ways. Compliance with frameworks of this nature may create an additional compliance burden and increased legal, compliance, governance, reporting and other costs to funds and/or fund managers because of the need to collect certain information to meet the disclosure requirements. In addition, where there are uncertainties regarding the operation of the framework, a lack of official, conflicting or inconsistent regulatory guidance, a lack of established market practice and/or data gaps or methodological challenges affecting the ability to collect relevant data, funds and/or fund managers may be required to engage third party advisers and/or service providers to fulfil the requirements, thereby exacerbating any increase in compliance burden and costs. To the extent that any applicable jurisdictions enact similar laws and/or frameworks, there is a risk that we may not be able to maintain alignment of a particular investment with such frameworks, and/or may be subject to additional compliance burdens and costs, which might adversely affect us.
We may be the target of litigation or similar proceedings in the future and we are subject to public perception risks.
We could generally be subject to litigation or similar proceedings in the future, including securities litigation and derivative actions by our stockholders. Any litigation or similar proceedings could result in substantial costs, divert management’s attention and resources from our business or otherwise have a material adverse effect on our business, financial condition and results of operations. In addition, in recent periods, there has been increased negative publicity with respect to the private credit industry, which could in the future harm our reputation.
Risks Related to Our Adviser and Its Affiliates
Our Adviser and its affiliates, including our officers and some of our directors, may face conflicts of interest caused by compensation arrangements with us and our affiliates, which could result in increased risk-taking or speculative investments, or cause our Adviser to use substantial leverage.
Our Adviser and its affiliates receive fees from us in return for their services. These fees may include certain incentive fees based on the amount of appreciation of our investments and arrangement, structuring or similar fees from portfolio companies in which we invest. These fees could influence the advice provided to us or create an incentive for our Adviser to make investments on our behalf that are risky or more speculative than would be the case in the absence of such incentive fees. Generally, the more equity we sell in public offerings and the greater the risk assumed by us with respect to our investments, including through the use of leverage, the greater the potential for growth in our assets and profits, and, correlatively, the fees payable by us to our Adviser. The way in which the incentive fee is determined may encourage our Adviser to use leverage to increase the leveraged return on our investment portfolio.
In addition, the fact that our base management fee is payable based upon our average gross assets (which includes any borrowings used for investment purposes) may encourage our Adviser to use leverage to make additional investments. Such a practice could make such investments more risky than would otherwise be the case, which could result in higher investment losses, particularly during cyclical economic downturns. Under certain circumstances, the use of substantial leverage (up to the limits prescribed by the 1940 Act) may increase the likelihood of our defaulting on our borrowings, which would be detrimental to holders of our securities.
The time and resources that individuals associated with our Adviser devote to us may be diverted, and we may face additional competition due to, among other things, the fact that neither our Adviser nor its affiliates is prohibited from raising money for or managing another entity that makes the same types of investments that we target.
Blue Owl is not prohibited from raising money for and managing future investment entities, in addition to the Blue Owl Clients, that make the same or similar types of investments as those we target. As a result, the time and resources that our Adviser devotes to us may be diverted, and during times of intense activity in other investment programs they may devote less time and resources to our business than is necessary or appropriate. In addition, we may compete with any such investment entity also managed by our Adviser or its affiliates for the same investors and investment opportunities. Furthermore, certain members of the Technology Lending Investment Committee or our affiliates are officers of Blue Owl and will devote a portion of their time to the operations of Blue Owl, including with respect to public company compliance.
42
Our Adviser and its affiliates may face conflicts of interest with respect to services performed for their respective other accounts and clients or issuers in which we may invest.
Our Adviser and its affiliates may provide a broad range of financial services to companies in which we may invest, including providing arrangement, syndication, origination structuring and other services to portfolio companies, and will generally be paid fees for such services, in compliance with applicable law, by the portfolio company. Any compensation received by our Adviser or its affiliates for providing these services will not be shared with us and may be received before we realize a return on our investment. In addition, we may invest in companies managed by entities in which funds managed by GP Strategic Capital have acquired a minority interest. Our Adviser and its affiliates may face conflicts of interest with respect to services performed for these companies, on the one hand, and investments recommended to us, on the other hand and could, in certain instances, have an incentive not to pursue actions against a portfolio company that would be in our best interest.
Additionally, because our Adviser and its affiliates manage assets for, or may in the future manage assets for, other investment companies, pooled investment vehicles and/or other accounts (including institutional clients, pension plans, insurance companies, co-invest vehicles and certain high net worth individuals), including the Blue Owl Clients, and we may compete for capital and investment opportunities with these entities, certain of which may have investment objectives that overlap with ours. As a result, conflicts may arise with respect to the allocation of investment opportunities among those products. For example, the Adviser is permitted to allocate an investment to a number of products across its platforms that it views as appropriate for the particular investment objectives, strategies and characteristics of such products. These conflicts include conflicts of interest relating to the allocation of investment opportunities by our Adviser and its affiliates; compensation to our Adviser; services that may be provided by our Adviser and its affiliates to issuers in which we may invest; investments by us and other clients of our Adviser, subject to the limitations of the 1940 Act; the formation of additional investment funds managed by our Adviser; differing recommendations given by our Adviser to us versus other clients; our Adviser’s use of information gained from issuers in our portfolio for investments by other clients, subject to applicable law; restrictions on our Adviser’s use of “inside information” with respect to potential investments by us; the allocation of certain expenses; and cross transactions.
For instance, our Adviser and its affiliates may receive asset management performance-based, or other fees from certain accounts that are higher than the fees received by our Adviser from us. In addition, certain members of Blue Owl’s Credit platform’s investment committees and other executives and employees of our Adviser or its affiliates will hold and receive interest in Blue Owl and its affiliates, in addition to cash and carried interest compensation. In these instances, a portfolio manager for our Adviser may have an incentive to favor the higher fee and/or performance-based fee accounts over us and/or to favor Blue Owl. In addition, a conflict of interest exists to the extent our Adviser, its affiliates, or any of their respective executives, portfolio managers or employees have proprietary or personal investments in other investment companies or accounts or when certain other investment companies or accounts are investment options in our Adviser’s or its affiliates’ employee benefit plans or employee offerings. In these circumstances, personnel of our Adviser may have incentive to favor these other investment companies or accounts over us. In addition, investments by more than one Blue Owl product in a portfolio company also have the potential to raise the risk of using assets of one Blue Owl product to support positions taken by another.
To mitigate these conflicts, the Blue Owl Credit Advisers will seek to execute such transactions for all of the participating investment accounts, including us, on a fair and equitable basis and in accordance with the Blue Owl Credit Advisers’ investment allocation policies, taking into account such factors as differences with respect to available capital; the current or anticipated size of a product; minimum investment amounts; the remaining life of a product; differences in investment objectives, guidelines or strategies; diversification; portfolio construction considerations; liquidity needs; legal, tax and regulatory requirements and other considerations deemed relevant to the Adviser and in accordance with its policies and procedures. We may be prohibited under the 1940 Act from participating in certain transactions with our affiliates without the prior approval of our directors who are not interested persons and, in some cases, the prior approval of the SEC. We, our Adviser and certain affiliates have been granted exemptive relief by the SEC to permit us to co-invest with other funds managed by our Adviser or certain of its affiliates in a manner consistent with our positions, policies, strategies and restrictions as well as regulatory requirements and other pertinent factors. See “—Our ability to enter into transactions with our affiliates is restricted.”
Actions taken by our Adviser and its affiliates on behalf of the Blue Owl Clients as a result of any conflict of interest may be adverse to us, which could harm our performance. For example, we may invest in the same credit obligations as other Blue Owl Clients, although, to the extent permitted under the 1940 Act, our investments may include different obligations or levels of the capital structure of the same issuer. The interests of Blue Owl Clients invested in different levels of the capital structure of a portfolio company may not always be aligned and actions taken for one Blue Owl Client may be adverse to one or more other products, which may give rise to conflicts of interest. The interests of these different Blue Owl Clients may diverge significantly particularly in the case of financial distress of the portfolio company. For example, in a bankruptcy proceeding or out-of-court restructuring, the interests of a Blue Owl Client owning equity or subordinated debt securities may be subordinated or otherwise adversely affected by virtue of a different Blue Owl Client's actions in respect of its own interests as a senior debt holder. While the Blue Owl Credit Advisers and their affiliates have developed general guidelines regarding when two or more funds can invest in different parts of the same company’s capital structure and created a process that they employ to handle those conflicts when they arise, their decision to permit the investments to occur in the first instance or their judgment on how to mitigate the conflict could be challenged or deemed insufficient.
43
If the Blue Owl Credit Advisers and their affiliates fail to appropriately address those conflicts, it could negatively impact their reputation and ability to raise additional funds and the willingness of counterparties to do business with them or result in potential litigation against them.
From time to time, fees and expenses generated in connection with potential portfolio investments that are not consummated and other investment related expenses may be allocable to us and one or more Blue Owl Clients. These expenses will be allocated in a manner that is fair and equitable over time and in accordance with policies adopted by the Blue Owl Credit Advisers and the Investment Advisory Agreement; however, the method for allocation expenses may vary depending on the nature of the expense and such determinations involve inherent discretion.
Our Adviser and its affiliates may give advice and recommend securities to other clients which may differ from advice given to, or securities recommended or bought for, us even though such other clients’ investment objectives may be similar to ours, which could have an adverse effect on our business, financial condition and results of operations.
In addition, from time to time, our Adviser could cause us to purchase a security or other investment from, or sell a security or other investment to, another Blue Owl Client. Such cross transaction would be in accordance with applicable regulations and our and our Adviser’s valuation and cross-trades policies; however, such cross transactions could give rise to additional conflicts of interest.
Our Board will seek to monitor these conflicts but there can be no assurances that such monitoring will fully mitigate any such conflicts.
Reductions, waivers or absorptions of fees and costs can temporarily result in higher returns to shareholders than they would otherwise receive if full fees and costs were charged.
The Adviser and its affiliates are permitted to reduce, waive or absorb some of the fees or costs otherwise due by us. While this activity can be seen as friendly to shareholders, reductions, waivers and absorptions of fees and costs result in higher returns to shareholders than such shareholders would receive if full fees and costs were charged. There is no guarantee that any reductions, waivers or absorptions will occur in the future, and any reductions, waivers and absorptions are entirely at the discretion of the Adviser.
Products within Blue Owl’s Real Assets platform may enter into sale lease-back transactions with our portfolio companies or with borrowers under our credit facilities.
From time to time, companies in which we have invested or may invest, may enter into sale-leaseback transactions with products within Blue Owl’s Real Assets platform. As a result of these arrangements we could be a creditor to, or equity owners of, a company at the same time that company is a tenant of a product within Blue Owl’s Real Assets platform. If such a company were to encounter financial difficulty or default on its obligations as a borrower, our Adviser could be required to take actions that may be adverse to those of Blue Owl’s Real Assets platform in enforcing our rights under the relevant facilities or agreements, or vice versa. This could lead to actual or perceived conflicts of interest.
Our access to confidential information may restrict our ability to take action with respect to some investments, which, in turn, may negatively affect our results of operations.
We, directly or through our Adviser, may obtain confidential information about the companies in which we have invested or may invest or be deemed to have such confidential information. Our Adviser may come into possession of material, non-public information through its members, officers, directors, employees, principals or affiliates. In addition, funds managed by GP Strategic Capital may invest in entities that manage our portfolio companies and, as a result, may obtain additional confidential information about our portfolio companies. The possession of such information may, to our detriment, limit the ability of us and our Adviser to buy or sell a security or otherwise to participate in an investment opportunity. In certain circumstances, employees of our Adviser may serve as board members or in other capacities for portfolio or potential portfolio companies, which could restrict our ability to trade in the securities of such companies. For example, if personnel of our Adviser come into possession of material non-public information with respect to our investments, such personnel will be restricted by our Adviser’s information-sharing policies and procedures or by law or contract from sharing such information with our management team, even where the disclosure of such information would be in our best interests or would otherwise influence decisions taken by the members of the management team with respect to that investment. This conflict and these procedures and practices may limit the freedom of our Adviser to enter into or exit from potentially profitable investments for us, which could have an adverse effect on our results of operations. Accordingly, there can be no assurance that we will be able to fully leverage the resources and industry expertise of our Adviser in the course of its duties. Additionally, there may be circumstances in which one or more individuals associated with our Adviser will be precluded from providing services to us because of certain confidential information available to those individuals or to other parts of our Adviser.
We may be obligated to pay our Adviser incentive fees even if we incur a net loss due to a decline in the value of our portfolio and even if our earned interest income is not payable in cash.
The Investment Advisory Agreement entitles our Adviser to receive an incentive fee based on our pre-incentive fee net investment income regardless of any capital losses. In such case, we may be required to pay our Adviser an incentive fee for a fiscal quarter even if there is a decline in the value of our portfolio or if we incur a net loss for that quarter.
44
Any incentive fee payable by us that relates to the pre-incentive fee net investment income may be computed and paid on income that may include interest that has been accrued but not yet received or interest in the form of securities received rather than cash (“payment-in-kind” or “PIK” income”). PIK income will be included in the pre-incentive fee net investment income used to calculate the incentive fee to our Adviser even though we do not receive the income in the form of cash. If a portfolio company defaults on a loan that is structured to provide accrued interest income, it is possible that accrued interest income previously included in the calculation of the incentive fee will become uncollectible. Our Adviser is not obligated to reimburse us for any part of the incentive fee it received that was based on accrued interest income that we never receive as a result of a subsequent default.
The quarterly incentive fee on income is recognized and paid without regard to: (i) the trend of pre-incentive fee net investment income as a percent of adjusted capital over multiple quarters in arrears which may in fact be consistently less than the quarterly preferred return, or (ii) the net income or net loss in the current calendar quarter, the current year or any combination of prior periods.
For U.S. federal income tax purposes, we may be required to recognize taxable income in some circumstances in which we do not receive a corresponding payment in cash and to make distributions with respect to such income to maintain our tax treatment as a RIC and/or minimize U.S. federal income or excise tax. Under such circumstances, we may have difficulty meeting the Annual Distribution Requirement necessary to maintain RIC tax treatment under the Code. This difficulty in making the required distribution may be amplified to the extent that we are required to pay the incentive fee on income with respect to such accrued income. As a result, we may have to sell some of our investments at times and/or at prices we would not consider advantageous, raise additional debt or equity capital, or forgo new investment opportunities for this purpose. If we are not able to obtain cash from other sources, we may fail to qualify for RIC tax treatment and thus become subject to U.S. federal income tax imposed at corporate rates.
Our ability to enter into transactions with our affiliates is restricted.
We are prohibited under the 1940 Act from participating in certain transactions with certain of our affiliates without the prior approval of a majority of our independent directors and, in some cases, the SEC. Any person that owns, directly or indirectly, 5% or more of our outstanding voting securities will be our affiliate for purposes of the 1940 Act, and we will generally be prohibited from buying or selling any securities from or to such affiliate on a principal basis, absent the prior approval of our Board and, in some cases, the SEC. The 1940 Act also prohibits certain “joint” transactions with certain of our affiliates, including other funds or clients advised by our Adviser or its affiliates, which in certain circumstances could include investments in the same portfolio company (whether at the same or different times to the extent the transaction involves a joint investment), without prior approval of our Board and, in some cases, the SEC. If a person acquires more than 25% of our voting securities, we will be prohibited from buying or selling any security from or to such person or certain of that person’s affiliates, or entering into prohibited joint transactions with such persons, absent the prior approval of the SEC. Similar restrictions limit our ability to transact business with our officers or directors or their affiliates or anyone who is under common control with us. The SEC has interpreted the BDC regulations governing transactions with affiliates to prohibit certain joint transactions involving entities that share a common investment adviser. As a result of these restrictions, we may be prohibited from buying or selling any security from or to any portfolio company that is controlled by a fund managed by either of our Adviser or its affiliates without the prior approval of the SEC, which may limit the scope of investment or disposition opportunities that would otherwise be available to us.
We rely on an order for exemptive relief (as amended, the “Order”) from the SEC, to co-invest with other funds managed by our Adviser or its affiliates in a manner consistent with our positions, policies, strategies and restrictions as well as regulatory requirements and other pertinent factors. The Order requires that a “required majority” (as defined in Section 57(o) of the 1940 Act) of the Board make certain findings (1) in most instances when we co-invest with our affiliates in an issuer where our affiliate has an existing investment in the issuer, and (2) if we dispose of an asset acquired in a transaction under the Order unless the disposition is done on a pro rata basis. Pursuant to the Order, the Board will oversee our participation in the co-investment program. As required by the Order, we have adopted, and the Board has approved, policies and procedures reasonably designed to ensure compliance with the terms of the Order, and the Adviser and our Chief Compliance Officer will provide reporting to the Board.
We may make investments that could give rise to a conflict of interest.
We do not expect to invest in, or hold securities of, companies that are controlled by an affiliate’s other clients. However, our Adviser or an affiliate’s other clients may invest in, and gain control over, one of our portfolio companies. If our Adviser or an affiliate’s other client, or clients, gains control over one of our portfolio companies, it may create conflicts of interest and may subject us to certain restrictions under the 1940 Act. As a result of these conflicts and restrictions our Adviser may be unable to implement our investment strategies as effectively as they could have in the absence of such conflicts or restrictions. For example, as a result of a conflict or restriction, our Adviser may be unable to engage in certain transactions that it would otherwise pursue. In order to avoid these conflicts and restrictions, our Adviser may choose to exit such investments prematurely and, as a result, we may forego any positive returns associated with such investments. In addition, to the extent that an affiliate’s other client holds a different class of securities than us as a result of such transactions, our interests may not be aligned.
45
Our Adviser’s liability is limited under the Investment Advisory Agreement, and we are required to indemnify our Adviser against certain liabilities, which may lead our Adviser to act in a riskier manner on our behalf than it would when acting for its own account.
Our Adviser has not assumed any responsibility to us other than to render the services described in the Investment Advisory Agreement (and, separately, under the Administration Agreement), and it will not be responsible for any action of our Board in declining to follow our Adviser’s advice or recommendations. Pursuant to the Investment Advisory Agreement, our Adviser and its directors, officers, shareholders, members, agents, employees, controlling persons, and any other person or entity affiliated with, or acting on behalf of our Adviser will not be liable to us for their acts under the Investment Advisory Agreement, absent criminal conduct, willful misfeasance, bad faith or gross negligence in the performance of their duties. We have also agreed to indemnify, defend and protect our Adviser and its directors, officers, shareholders, members, agents, employees, controlling persons and any other person or entity affiliated with, or acting on behalf of our Adviser with respect to all damages, liabilities, costs and expenses resulting from acts of our Adviser not arising out of criminal conduct, willful misfeasance, bad faith or gross negligence in the performance of their duties. However, in accordance with Section 17(i) of the 1940 Act, neither our Adviser nor any of its affiliates, directors, officers, members, employees, agents, or representatives may be protected against any liability to us or our investors to which it would otherwise be subject by reason of criminal conduct, willful misfeasance, bad faith, gross negligence or reckless disregard of the duties involved in the conduct of its office. These protections may lead our Adviser to act in a riskier manner when acting on our behalf than it would when acting for its own account.
There are risks associated with any potential merger with or purchase of assets of another fund.
Our Adviser may in the future recommend to our Board that we merge with or acquire all or substantially all of the assets of one or more funds including a fund that could be managed by our Adviser or its affiliates (including another BDC). We do not expect that our Adviser would recommend any such merger or asset purchase unless it determines that it would be in our best interests, with such determination dependent on factors it deems relevant, which may include our historical and projected financial performance and that of any proposed merger partner, portfolio composition, potential synergies from the merger or asset sale, available alternative options and market conditions. In addition, no such merger or asset purchase would be consummated absent the meeting of various conditions required by applicable law or contract, at such time, which may include approval of the board of directors and common equity holders of both funds. If our Adviser is the investment adviser of both funds, various conflicts of interest would exist with respect to any such transaction. Such conflicts of interest may potentially arise from, among other things, differences between the compensation payable to our Adviser by us and by the entity resulting from such a merger or asset purchase or efficiencies or other benefits to our Adviser as a result of managing a single, larger fund instead of two separate funds.
Our Adviser’s failure to comply with pay-to-play laws, regulations and policies could have an adverse effect on our Adviser, and thus, us.
A number of U.S. states and municipal pension plans have adopted so-called “pay-to-play” laws, regulations or policies which prohibit, restrict or require disclosure of payments to (and/or certain contacts with) state officials by individuals and entities seeking to do business with state entities, including those seeking investments by public retirement funds. The SEC has adopted a rule that, among other things, prohibits an investment adviser from providing advisory services for compensation to a government client for two years after the adviser or certain of its executives or employees makes a contribution to certain elected officials or candidates. If our Adviser, any of its employees or affiliates or any service provider acting on its behalf, fails to comply with such laws, regulations or policies, such non-compliance could have an adverse effect on our Adviser, and thus, us.
Risks Related to Business Development Companies
The requirement that we invest a sufficient portion of our assets in qualifying assets could preclude us from investing in accordance with our current business strategy; conversely, the failure to invest a sufficient portion of our assets in qualifying assets could result in our failure to maintain our status as a BDC.
As a BDC, the 1940 Act prohibits us from acquiring any assets other than certain qualifying assets unless, at the time of and after giving effect to such acquisition, at least 70% of our total assets are qualifying assets. Therefore, we may be precluded from investing in what we believe are attractive investments if such investments are not qualifying assets. Conversely, if we fail to invest a sufficient portion of our assets in qualifying assets, we could lose our status as a BDC, which would have a material adverse effect on our business, financial condition and results of operations. Similarly, these rules could prevent us from making additional investments in existing portfolio companies, which could result in the dilution of our position, or could require us to dispose of investments at an inopportune time to comply with the 1940 Act. If we were forced to sell non-qualifying investments in the portfolio for compliance purposes, the proceeds from such sale could be significantly less than the current value of such investments.
46
Failure to maintain our status as a BDC would reduce our operating flexibility.
If we do not remain a BDC, we might be regulated as a closed-end investment company under the 1940 Act, which would subject us to substantially more regulatory restrictions, including a greater required asset coverage ratio and additional restrictions on transactions with affiliates, and correspondingly decrease our operating flexibility.
Regulations governing our operation as a BDC and RIC affect our ability to raise capital and the way in which we raise additional capital or borrow for investment purposes, which may have a negative effect on our growth. As a BDC, the necessity of raising additional capital may expose us to risks, including risks associated with leverage.
As a result of the Annual Distribution Requirement to qualify for tax treatment as a RIC, we may need to access the capital markets periodically to raise cash to fund new investments in portfolio companies. Currently, we may issue “senior securities,” including borrowing money from banks or other financial institutions only in amounts such that the ratio of our total assets (less total liabilities other than indebtedness represented by senior securities) to our total indebtedness represented by senior securities plus preferred stock, if any, equals at least 150% after such incurrence or issuance. If we issue senior securities, we will be exposed to risks associated with leverage, including an increased risk of loss. Our ability to issue different types of securities is also limited. Compliance with RIC distribution requirements may unfavorably limit our investment opportunities and reduce our ability in comparison to other companies to profit from favorable spreads between the rates at which we can borrow and the rates at which we can lend. Therefore, we intend to seek to continuously issue equity securities, which may lead to shareholder dilution.
If the value of our assets declines, we may be unable to satisfy the asset coverage test under the 1940 Act, which would prohibit us from paying distributions and could prevent us from qualifying for tax treatment as a RIC, which would generally result in U.S. federal income tax imposed at corporate rates on any income and net gains. If we cannot satisfy the asset coverage test, we may be required to sell a portion of our investments and, depending on the nature of our debt financing, repay a portion of our indebtedness at a time when such sales may be disadvantageous. Also, any amounts that we use to service our indebtedness would not be available for distribution to our shareholders.
Risks Related to Our Investments
Our investments in portfolio companies may be risky, and we could lose all or part of our investments.
Our strategy focuses primarily on originating and making loans to, and making debt and equity investments in, U.S. middle market companies in a broad range of technology-related industries, with a focus on originated transactions sourced through the networks of our Adviser. Short transaction closing timeframes associated with originated transactions coupled with added tax or accounting structuring complexity and international transactions may result in higher risk in comparison to non-originated transactions.
Most debt securities in which we intend to invest will not be rated by any rating agency and, if they were rated, they would be rated as below investment grade quality and are commonly referred to as “high yield” or “junk.” Debt securities rated below investment grade quality are generally regarded as having predominantly speculative characteristics and may carry a greater risk with respect to a borrower’s capacity to pay interest and repay principal. In addition, some of the loans in which we may invest may be “covenant-lite” loans. We use the term “covenant-lite” loans to refer generally to loans that do not have a complete set of financial maintenance covenants. Generally, “covenant-lite” loans provide borrower companies more freedom to negatively impact lenders because their covenants are incurrence-based, which means they are only tested and can only be breached following an affirmative action of the borrower, rather than by a deterioration in the borrower’s financial condition. Accordingly, to the extent we invest in “covenant-lite” loans, we may have fewer rights against a borrower and may have a greater risk of loss on such investments as compared to investments in or exposure to loans with financial maintenance covenants.
First-Lien Debt. When we make a first-lien loan, we generally take a security interest in the available assets of the portfolio company, including the equity interests of its subsidiaries, which we expect to help mitigate the risk that we will not be repaid. However, there is a risk that the collateral securing our loans may decrease in value over time, may be difficult to sell in a timely manner, may be difficult to appraise, and may fluctuate in value based upon the success of the business and market conditions, including as a result of the inability of the portfolio company to raise additional capital. In some circumstances, our lien is, or could become, subordinated to claims of other creditors. Consequently, the fact that a loan is secured does not guarantee that we will receive
47
principal and interest payments according to the loan’s terms, or at all, or that we will be able to collect on the loan should we need to enforce our remedies.
Unitranche Loans. In addition, in connection with any unitranche loans (including “last out” portions of such loans) in which we may invest, we would enter into agreements among lenders. Under these agreements, our interest in the collateral of the first-lien loans may rank junior to those of other lenders in the loan under certain circumstances. This may result in greater risk and loss of principal on these loans.
Second-Lien and Mezzanine Debt. Our investments in second-lien and mezzanine debt generally are subordinated to senior loans and will either have junior security interests or be unsecured. As such, other creditors may rank senior to us in the event of insolvency. This may result in greater risk and loss of principal.
Equity Investments. When we invest in first-lien debt, second-lien debt or mezzanine debt, we may acquire equity securities, such as warrants, options and convertible instruments, as well. In addition, we may invest directly in the equity securities of portfolio companies. We may structure such equity investments to include provisions protecting our rights as a minority-interest holder, as well as a “put,” or right to sell such securities back to the issuer, upon the occurrence of specified events. In many cases, we may also seek to obtain registration rights in connection with these equity interests, which may include demand and “piggyback” registration rights, which grants us the right to register our equity interest when either the portfolio company or another investor in the portfolio company files a registration statement with the SEC to issue securities. We seek to dispose of these equity interests and realize gains upon our disposition of these interests. However, the equity interests we receive may not appreciate in value and, in fact, may decline in value. Accordingly, we may not be able to realize gains from our equity interests, and any gains that we do realize on the disposition of any equity interests may not be sufficient to offset any other losses we experience.
We have invested and may continue to invest through joint ventures, partnerships and other special purpose vehicles and our investments through these vehicles may entail greater risks, or risks that we otherwise would not incur, if we otherwise made such investments directly.
We may make indirect investments in portfolio companies through joint ventures, partnerships or other special purpose vehicles (“Investment Vehicles”). In general, the risks associated with indirect investments in portfolio companies through a joint venture, partnership or other special purpose vehicle are similar to those associated with a direct investment in a portfolio company; however, if we are not the sole investor in such Investment Vehicle, the investment may involve risks not present in investments where a third party is not involved.
For any such investments, the optimization of the joint venture may be a complex, costly and time-consuming process and if we experience difficulties in this process, the anticipated benefits may not be realized fully or at all, or may take longer to realize than expected, which could have an adverse effect on us for an undetermined period after any such acquisition. There can be no assurances that we will realize any potential operating efficiencies, synergies and other benefits anticipated in connection with such joint ventures.
While we intend to analyze the credit and business of a potential portfolio company in determining whether to make an investment in an Investment Vehicle, we will nonetheless be exposed to the creditworthiness of the Investment Vehicle and any third party. In the event of a bankruptcy proceeding against the portfolio company, the assets of the portfolio company may be used to satisfy its obligations prior to the satisfaction of our investment in the Investment Vehicle (i.e., our investment in the Investment Vehicle could be structurally subordinated to the other obligations of the portfolio company). If a third party is involved, we are subject to the risk that such third-party could have financial difficulties resulting in a negative impact on the Investment Vehicle, could have economic or business interests or goals which are inconsistent with ours, or could be in a position to take (or block) action in a manner contrary to our investment objective or the increased possibility of default by, diminished liquidity or insolvency of, the third party, due to a sustained or general economic downturn. In addition, if we are not the sole investor in an Investment Vehicle, we may be required to rely on our partners in the Investment Vehicle when making decisions regarding such Investment Vehicle’s investments, accordingly, the value of the investment could be adversely affected if our interests diverge from those of our partners in the Investment Vehicle.
Any strategic investments that we pursue are subject to risks and uncertainties.
We have pursued and may continue to pursue growth through strategic investments in new businesses, including through investments in our specialty finance vehicles. Completion and timing of any such strategic investments may be subject to a number of contingencies, including the uncertainty in reaching a commercial agreement with our counterparty, our ability to obtain required board, shareholder and regulatory approvals, as well as any required financing (or the risk that these are obtained subject to terms and conditions that are not anticipated). We may not be required to announce an acquisition or strategic transaction until a definitive agreement is reached and the announcement or consummation of any such transaction may adversely impact our business relationships or engender competitive responses.
In addition, the proposal and negotiation of strategic investments, whether or not completed, as well as the integration of those businesses into our existing portfolio, could result in substantial expenses and the diversion of our Adviser’s time, attention and resources from our day-to-day operations.
48
Our ability to manage our growth through strategic investments will depend, in part, on our success in addressing these risks. Any failure to effectively implement our acquisition or strategic investment strategies could have a material adverse effect on our business, financial condition or results of operations.
An investment strategy focused primarily on privately held companies presents certain challenges, including the lack of available information about these companies.
We invest primarily in privately held companies. Investments in private companies pose certain incremental risks as compared to investments in public companies including that they generally:
•have reduced access to the capital markets, resulting in diminished capital resources and ability to withstand financial distress;
•may have limited financial resources and may be unable to meet their obligations under their debt obligations that we hold, which may be accompanied by a deterioration in the value of any collateral and a reduction in the likelihood of our realizing any guarantees we may have obtained in connection with our investment;
•may have shorter operating histories, narrower product lines and smaller market shares than larger businesses, which tend to render them more vulnerable to competitors’ actions and changing market conditions, as well as general economic downturns;
•are more likely to depend on the management talents and efforts of a small group of persons and, therefore, the death, disability, resignation or termination of one or more of these persons could have a material adverse impact on the company and, in turn, on us; and
•have less predictable operating results, may from time to time be parties to litigation, may be engaged in rapidly changing businesses with products subject to a substantial risk of obsolescence, and may require substantial additional capital to support their operations, finance expansion or maintain their competitive position.
In addition, investments in private companies tend to be less liquid. The securities of private companies are not publicly traded or actively traded on the secondary market and are, instead, traded on a privately negotiated over-the-counter secondary market for institutional investors. These over-the-counter secondary markets may be inactive during an economic downturn or a credit crisis and in any event often have lower volumes than publicly traded securities even in normal market conditions. In addition, the securities in these companies will be subject to legal and other restrictions on resale or will otherwise be less liquid than publicly traded securities.
If there is no readily available market for these investments, we are required to carry these investments at fair value as determined by our Board. As a result, if we are required to liquidate all or a portion of our portfolio quickly, we may realize significantly less than the value at which we had previously recorded these investments. We may also face other restrictions on our ability to liquidate an investment in a portfolio company to the extent that we, our Adviser or any of its affiliates have material nonpublic information regarding such portfolio company or where the sale would be an impermissible joint transaction under the 1940 Act. The reduced liquidity of our investments may make it difficult for us to dispose of them at a favorable price, and, as a result, we may suffer losses.
Finally, little public information generally exists about private companies and these companies may not have third-party credit ratings or audited financial statements. We must therefore rely on the ability of our Adviser to obtain adequate information through due diligence to evaluate the creditworthiness and potential returns from investing in these companies, and to monitor the activities and performance of these investments. To the extent that we (or other clients of our Adviser) may hold a larger number of investments, greater demands will be placed on our Adviser’s time, resources and personnel in monitoring such investments, which may result in less attention being paid to any individual investment and greater risk that our investment decisions may not be fully informed. Additionally, these companies and their financial information will not generally be subject to the Sarbanes-Oxley Act of 2002 and other rules that govern public companies. If we are unable to uncover all material information about these companies, we may not make a fully informed investment decision, and we may lose money on our investments.
Investing in publicly traded companies can involve a high degree of risk and can be speculative.
We may invest a portion of our portfolio in publicly traded companies or companies that are in the process of completing their initial public offering (“IPO”). If we invest in instruments issued by publicly-held companies, we may be subject to risks that differ in type or degree from those involved with investments in privately-held companies. Such risks include, without limitation, greater volatility in the valuation of such companies, increased obligations to disclose information regarding such companies, limitations on our ability to dispose of such instruments at certain times, increased likelihood of shareholder litigation against such companies’ board members and increased costs associated with each of the aforementioned risks. In addition, to the extent we invest in publicly traded debt instruments, we may not be able to obtain financial covenants or other contractual rights that we might otherwise be able to obtain when making privately-negotiated investments. We may not have the same access to information in connection with investments in public debt instruments that we would expect to have in connection with privately-negotiated investments.
As publicly traded companies, the securities of these companies may not trade at high volumes, and prices can be volatile, particularly during times of general market volatility, which may restrict our ability to sell our positions and may have a material adverse impact on us. If we or our Adviser were deemed to have material, nonpublic information regarding the issuer of a publicly
49
traded instrument in which we have invested, we may be limited in our ability to make new investments or sell existing investments in such issuer. All of these factors may restrict our ability to sell our positions and may have a material adverse impact on us.
Broadly syndicated loans, including “covenant-lite” loans, may expose us to different risks, including with respect to liquidity, price volatility, ability to restructure loans, credit risks and less protective loan documentation, than is the case with loans that contain financial maintenance covenants.
Our investments may consist of broadly syndicated loans that were not originated by us. Under the documentation for such loans, a financial institution or other entity typically is designated as the administrative agent and/or collateral agent. This agent is granted a lien on any collateral on behalf of the other lenders and distributes payments on the indebtedness as they are received. The agent is the party responsible for administering and enforcing the loan and generally may take actions only in accordance with the instructions of a majority or two-thirds in commitments and/or principal amount of the associated indebtedness. Accordingly, we may be precluded from directing such actions unless we or our investment adviser is the designated administrative agent or collateral agent or we act together with other holders of the indebtedness. If we are unable to direct such actions, we cannot assure shareholders that the actions taken will be in our best interests.
There is also a risk that a loan agent may become bankrupt or insolvent. Such an event would delay, and possibly impair, any enforcement actions undertaken by holders of the associated indebtedness, including attempts to realize upon the collateral securing the associated indebtedness and/or direct the agent to take actions against the related obligor or the collateral securing the associated indebtedness and actions to realize on proceeds of payments made by obligors that are in the possession or control of any other financial institution. In addition, we may be unable to remove the agent in circumstances in which removal would be in our best interests. Moreover, agented loans typically allow for the agent to resign with certain advance notice.
In addition, a significant number of high yield loans in the market, in particular the broadly syndicated loan market, may consist of “covenant-lite” loans. Generally, “covenant-lite” loans provide borrower companies more freedom to negatively impact lenders because their covenants are incurrence-based, which means they are only tested and can only be breached following an affirmative action of the borrower, rather than by a deterioration in the borrower’s financial condition. Ownership of “covenant-lite” loans may expose us to different risks, including with respect to liquidity, price volatility, ability to restructure loans, credit risks and less protective loan documentation, than is the case with loans that contain financial maintenance covenants.
Our investments are concentrated in technology-related industries, some of which are subject to extensive government regulation, which exposes us to the risk of significant loss if any of these industry sectors experiences a downturn.
A consequence of our investment strategy is that our investment returns will be materially and adversely affected if the companies or the industries we target perform poorly. Beyond the asset diversification requirements to which we will be subject as a RIC and the policy we expect to adopt to invest, under normal circumstances, at least 80% of the value of our assets in technology-related companies, we do not have fixed guidelines for diversification or limitations on the size of our investments in any one company and our investments could be concentrated in relatively few industries.
Our investments may be subject to extensive regulation by U.S. and foreign federal, state and/or local agencies. Changes in existing laws, rules or regulations, or judicial or administrative interpretations thereof, or new laws, rules or regulations could have an adverse impact on the business and industries of our portfolio companies. In addition, changes in government priorities or limitations on government resources could also adversely impact our portfolio companies. We are unable to predict whether any such changes in laws, rules or regulations will occur and, if they do occur, the impact of these changes on our portfolio companies and our investment returns.
Furthermore, if any of our portfolio companies were to fail to comply with applicable regulations, they could be subject to significant penalties and claims that could materially and adversely affect their operations. Our portfolio companies may be subject to the expense, delay and uncertainty of the regulatory approval process for their products and, even if approved, these products may not be accepted in the marketplace.
As of December 31, 2025, our investments in systems software and application software represented 17.9% and 13.6% of our portfolio at fair value, respectively. Our investments in these industries are subject to substantial risks, including, but not limited to, the risk that the laws and regulations governing these industries and, and interpretations thereof, may change frequently, the risk of defending against litigation claims based on allegations of infringement or other violations of intellectual property, the risk that portfolio companies may be unable to attract and retain qualified skilled IT personnel and software developers, the risk that rapid technological change, evolving industry standards and practices, and changing customer needs may negatively affect our portfolio companies and sensitivity to general economic conditions and cyclical demand.
As of December 31, 2025, our investments in health care technology represented 13.9% of our portfolio at fair value. Our investments in health care technology are subject to substantial risks, including, but not limited to, the risk that the laws and regulations governing the business of health care companies, and interpretations thereof, may change frequently. Current or future laws and regulations could force our portfolio companies engaged in health care to change their policies related to how they operate, restrict revenue, change costs, change reserve levels and change business practices.
50
As of December 31, 2025, our investments in diversified financial services represented 9.8% of our portfolio at fair value. Our investments in diversified financial services are subject to a variety of risks, including, but not limited to, market uncertainty, additional or changing government regulations, disclosure requirements, limits on fees, increasing borrowing costs or limits on the terms or availability of credit to such portfolio companies, and other regulatory requirements, each of which may impact the conduct of such portfolio companies. Compliance with changing regulatory requirements will likely impose staffing, legal, compliance and other costs, and administrative burdens upon our investments in diversified financial services.
Our investments may be in portfolio companies that have limited operating histories and resources.
Our portfolio may include investments in companies that may have relatively limited operating histories. These companies may be particularly vulnerable to U.S. and foreign economic downturns may have more limited access to capital and higher funding costs, may have a weaker financial position and may need more capital to expand or compete. These businesses also may experience substantial variations in operating results. They may face intense competition, including from larger, more established companies with greater financial, technical and marketing resources. Furthermore, some of these companies do business in regulated industries and could be affected by changes in government regulation applicable to their given industry. Accordingly, these factors could impair their cash flow or result in other events, such as bankruptcy, which could limit their ability to repay their obligations to us, and may adversely affect the return on, or the recovery of, our investment in these companies. We cannot assure you that any of our investments in our portfolio companies will be successful. We may lose our entire investment in any or all of our portfolio companies.
A lack of IPO or merger and acquisition opportunities may cause companies to stay in our portfolio longer, leading to lower returns, unrealized depreciation, or realized losses.
A lack of IPO or merger and acquisition (“M&A”) opportunities for venture capital-backed companies could lead to companies staying longer in our portfolio as private entities still requiring funding. This situation may adversely affect the amount of available funding for early-stage companies in particular as, in general, venture-capital firms are being forced to provide additional financing to late-stage companies that cannot complete an IPO or M&A transaction. In the best case, such stagnation would dampen returns, and in the worst case, could lead to unrealized depreciation and realized losses as some companies run short of cash and have to accept lower valuations in private fundings or are not able to access additional capital at all. A lack of IPO or M&A opportunities for venture capital-backed companies can also cause some venture capital firms to change their strategies, leading some of them to reduce funding of their portfolio companies and making it more difficult for such companies to access capital and to fulfill their potential, which can result in unrealized depreciation and realized losses in such companies by other companies such as ourselves who are co-investors in such companies.
The inability of our portfolio companies to commercialize their technologies or create or develop commercially viable products or businesses would have a negative impact on our investment returns.
The possibility that our portfolio companies will not be able to commercialize their technology, products or business concepts presents significant risks to the value of our investments. Additionally, although some of our portfolio companies may already have a commercially successful product or product line when we invest, technology-related products and services often have a more limited market- or life-span than products in other industries. Thus, the ultimate success of these companies often depends on their ability to continually innovate, or raise additional capital, in increasingly competitive markets. Their inability to do so could affect our investment return. In addition, the intellectual property held by our portfolio companies often represents a substantial portion of the collateral, if any, securing our investments. We cannot assure you that any of our portfolio companies will successfully acquire or develop any new technologies, or that the intellectual property the companies currently hold will remain viable. Even if our portfolio companies are able to develop commercially viable products, the market for new products and services is highly competitive and rapidly changing. Neither our portfolio companies nor we have any control over the pace of technology development. Commercial success is difficult to predict, and the marketing efforts of our portfolio companies may not be successful.
If our portfolio companies are unable to protect their intellectual property rights, or are required to devote significant resources to protecting their intellectual property rights, then our investments could be harmed.
Our success and competitive position depend in part upon the ability of our portfolio companies to obtain and maintain proprietary technology used in their products and services, which will often represent a significant portion of the collateral, if any, securing our investment. The portfolio companies will rely, in part, on patent, trade secret and trademark law to protect that technology, but competitors may misappropriate their intellectual property, and disputes as to ownership of intellectual property may arise. Portfolio companies may, from time to time, be required to institute litigation in order to enforce their patents, copyrights or other intellectual property rights, to protect their trade secrets, to determine the validity and scope of the proprietary rights of others or to defend against claims of infringement. Such litigation could result in substantial costs and diversion of resources.
Similarly, if a portfolio company is found to infringe upon or misappropriate a third party’s patent or other proprietary rights, that portfolio company could be required to pay damages to such third party, alter its own products or processes, obtain a license from the third party and/or cease activities utilizing such proprietary rights, including making or selling products utilizing such proprietary rights. Any of the foregoing events could negatively affect both the portfolio company’s ability to service our debt investment and the value of any related debt and equity securities that we own, as well as any collateral securing our investment.
51
Our relationship with certain portfolio companies may expose us to our portfolio companies’ trade secrets and confidential information which may require us to be parties to non-disclosure agreements and restrict us from engaging in certain transactions.
Our relationship with some of our portfolio companies may expose us to our portfolio companies’ trade secrets and confidential information (including transactional data and personal data about their employees and clients) that may require us to be parties to nondisclosure agreements and restrict us from engaging in certain transactions. Unauthorized access or disclosure of such information may occur, resulting in theft, loss or other misappropriation. Any theft, loss, improper use, such as insider trading or other misappropriation of confidential information could have a material adverse impact on our competitive positions, our relationship with our portfolio companies and our reputation and could subject us to regulatory inquiries, enforcement and fines, civil litigation and possible financial liability or costs.
We may be subject to risks associated with our investments in bank loans.
We may invest in bank loans and participations. These obligations are subject to unique risks, including:
•the possible invalidation of an investment transaction as a fraudulent conveyance under relevant creditors’ rights laws,
•so-called lender-liability claims by the issuer of the obligations,
•environmental liabilities that may arise with respect to collateral securing the obligations, and
•limitations on our ability to directly enforce its rights with respect to participations.
In addition, the illiquidity of bank loans may make it difficult for us to sell such investments to access capital if required. As a result, we could realize significantly less than the value at which we have recorded our investments if we were required to sell them for liquidity purposes. Compared to securities and to certain other types of financial assets, purchases and sales of loans take relatively longer to settle. This extended settlement process can (i) increase the counterparty credit risk borne by us; (ii) leave us unable to timely vote, or otherwise act with respect to, loans it has agreed to purchase; (iii) delay us from realizing the proceeds of a sale of a loan; (iv) inhibit our ability to re-sell a loan that it has agreed to purchase if conditions change (leaving us more exposed to price fluctuations); (v) prevent us from timely collecting principal and interest payments; and (vi) expose us to adverse tax or regulatory consequences. To the extent the extended loan settlement process gives rise to short-term liquidity needs, we may hold cash, sell investments or temporarily borrow from banks or other lenders.
In purchasing participations, we generally will have no right to enforce compliance by the borrower with the terms of the loan agreement, nor any rights of set-off against the borrower, and we may not directly benefit from the collateral supporting the debt obligation in which we have purchased the participation. As a result, we will assume the credit risk of both the borrower and the institution selling the participation.
In analyzing each bank loan or participation, our Adviser compares the relative significance of the risks against the expected benefits of the investment. Successful claims by third parties arising from these and other risks will be borne by us.
If the assets securing the loans that we make decrease in value, then we may lack sufficient collateral to cover losses.
To attempt to mitigate credit risks, we intend to take a security interest in the available assets of our portfolio companies. There is no assurance that we will obtain sufficient collateral to cover losses or properly perfect our liens.
There is a risk that the collateral securing our loans may decrease in value over time, may be difficult to sell in a timely manner, may be difficult to appraise and may fluctuate in value based upon the success of the business and market conditions, including as a result of the inability of a portfolio company to raise additional capital. In some circumstances, our lien could be subordinated to claims of other creditors. Consequently, the fact that a loan is secured does not guarantee that we will receive principal and interest payments according to the loan’s terms, or that we will be able to collect on the loan should we be forced to enforce our remedies.
In addition, because we invest in technology-related companies, a substantial portion of the assets securing our investment may be in the form of intellectual property, if any, inventory and equipment and, to a lesser extent, cash and accounts receivable. Intellectual property, if any, that is securing our loan could lose value if, among other things, the company’s rights to the intellectual property are challenged or if the company’s license to the intellectual property is revoked or expires, the technology fails to achieve its intended results or a new technology makes the intellectual property functionally obsolete. Inventory may not be adequate to secure our loan if our valuation of the inventory at the time that we made the loan was not accurate or if there is a reduction in the demand for the inventory.
Similarly, any equipment securing our loan may not provide us with the anticipated security if there are changes in technology or advances in new equipment that render the particular equipment obsolete or of limited value, or if the company fails to adequately maintain or repair the equipment. Any one or more of the preceding factors could materially impair our ability to recover earned interest and principal in a foreclosure.
52
We may suffer a loss if a portfolio company defaults on a loan and the underlying collateral is not sufficient.
In the event of a default by a portfolio company on a secured loan, we will only have recourse to the assets collateralizing the loan. If the underlying collateral value is less than the loan amount, we will suffer a loss. In addition, we may make loans that are unsecured, which are subject to the risk that other lenders may be directly secured by the assets of the portfolio company. In the event of a default, those collateralized lenders would have priority over us with respect to the proceeds of a sale of the underlying assets. In cases described above, we may lack control over the underlying asset collateralizing our loan or the underlying assets of the portfolio company prior to a default, and as a result the value of the collateral may be reduced by acts or omissions by owners or managers of the assets.
In the event of bankruptcy of a portfolio company, we may not have full recourse to its assets in order to satisfy our loan, or our loan may be subject to “equitable subordination.” This means that depending on the facts and circumstances, including the extent to which we actually provided significant “managerial assistance,” if any, to that portfolio company, a bankruptcy court might re-characterize our debt holding and subordinate all or a portion of our claim to that of other creditors. In addition, certain of our loans are subordinate to other debt of the portfolio company. If a portfolio company defaults on our loan or on debt senior to our loan, or in the event of a portfolio company bankruptcy, our loan will be satisfied only after the senior debt receives payment. Where debt senior to our loan exists, the presence of intercreditor arrangements may limit our ability to amend our loan documents, assign our loans, accept prepayments, exercise our remedies (through “standstill” periods) and control decisions made in bankruptcy proceedings relating to the portfolio company. Bankruptcy and portfolio company litigation can significantly increase collection losses and the time needed for us to acquire the underlying collateral in the event of a default, during which time the collateral may decline in value, causing us to suffer losses.
Borrowers of broadly syndicated loans may be permitted to designate unrestricted subsidiaries under the terms of their financing agreements, which would exclude such unrestricted subsidiaries from restrictive covenants under the financing agreement with the borrower. Without restriction under the financing agreement, the borrower could take various actions with respect to the unrestricted subsidiary including, among other things, incur debt, grant security on its assets, sell assets, pay dividends or distribute shares of the unrestricted subsidiary to the borrower’s shareholders. Any of these actions could increase the amount of leverage that the borrower is able to incur and increase the risk involved in our investments in broadly syndicated loans accordingly.
If the value of collateral underlying our loan declines or interest rates increase during the term of our loan, a portfolio company may not be able to obtain the necessary funds to repay our loan at maturity through refinancing.
Decreasing collateral value and/or increasing interest rates may hinder a portfolio company’s ability to refinance our loan because the underlying collateral cannot satisfy the debt service coverage requirements necessary to obtain new financing. In some instances a borrower may engage in liability management exercises with certain of its investors who agree to provide additional capital or capital on modified terms in exchange for a superior position in the portfolio company’s capital structure. In such instances, the collateral securing our investment may be reduced or our lien may be further subordinated. If a borrower is unable to repay our loan at maturity, we could suffer a loss which may adversely impact our financial performance.
We may not realize any income or gains from our equity investments.
We have invested in and may continue to invest in equity-related securities, including common equity, warrants, preferred stock and convertible preferred securities. These equity interests we acquire may not appreciate in value and, in fact, may decline in value if the company fails to perform financially or achieve its growth objectives. We will generally have little, if any, control over the timing of any gains we may realize from our equity investments since these securities may have restrictions on their transfer or may not have an active trading market. Equity investments also have experienced significantly more volatility in their returns and may under-perform relative to fixed income securities during certain periods. An adverse event, such as an unfavorable earnings report, may depress the value. Also, prices of equity investments are sensitive to general movements in the stock market and a drop in the stock market may depress the price of common stock investments to which we have exposure. Equity prices fluctuate for several reasons including changes in investors’ perceptions of the financial condition of an issuer or the general condition of the relevant stock market, or when political or economic events affecting the issuers occur. In addition, common stock prices may be particularly sensitive to rising interest rates, as the cost of capital rises and borrowing costs increase.
Although we expect to receive current income in the form of dividend payments on any convertible preferred equity investments, a substantial portion of the gains we expect to receive from our investments in such securities will likely be from the capital gains generated from the sale of our equity investments upon conversion of our convertible securities, the timing of which we cannot predict and we cannot guarantee that such sale will happen at all. We do not expect to generate capital gains from the sale of our portfolio investments on a level or uniform basis from quarter to quarter. In addition, any convertible preferred stock instruments will generally provide for conversion upon the portfolio companies’ achievement of certain milestone events, including a qualified public offering and/or a senior exchange listing for their common stock. However, there can be no assurance that our portfolio companies will obtain either a junior or senior exchange listing or, even if a listing is obtained, that an active trading market will ever develop in the common stock of our publicly traded portfolio companies. In addition, even if our portfolio companies obtain an exchange listing, we may be subject to lock-up provisions that prohibit us from selling our investments into the public market for specified periods of time after
53
such listing. As a result, the market price of securities that we hold may decline substantially before we are able to sell these securities following an exchange listing.
Accordingly, we may not be able to realize gains from our equity interests, and any gains that we do realize on the disposition of any equity interests may not be sufficient to offset any other losses we experience. Furthermore, due to the expected growth of our portfolio companies, we do not generally expect to receive dividend income from our common stock investments. In the case of cumulative preferred stock, there is no assurance that any dividends will ever be paid by a portfolio company. Dividends to any equity holders may be suspended or cancelled at any time. Investments in equity securities can carry additional risks and may have other characteristics that require investments to be made indirectly through blocker entities or otherwise. In addition, if an issuer of equity securities in which we have invested sells additional shares of its equity securities, our interest in the issuer may be diluted and the value of our investment could decrease.
We may invest, to the extent permitted by law, in the equity securities of investment funds that are operating pursuant to certain exceptions to the 1940 Act and in advisers to similar investment funds and, to the extent we so invest, will bear our ratable share of any such company’s expenses, including management and performance fees. We will also remain obligated to pay the base management fee, income based fee and capital gains incentive fee to our investment adviser with respect to the assets invested in the securities and instruments of such companies. With respect to each of these investments, each of our common stockholders will bear his or her share of the base management fee, income based fee and capital gains incentive fee due to our investment adviser as well as indirectly bearing the management and performance fees and other expenses of any such investment funds or advisers.
For the foregoing reasons, investments in equity securities can be highly speculative and carry a substantial risk of loss of investment.
The credit ratings of certain of our investments may not be indicative of the actual credit risk of such rated instruments.
Rating agencies rate debt securities based upon their assessment of the likelihood of the receipt of principal and interest payments. Rating agencies do not consider the risks of fluctuations in market value or other factors that may influence the value of debt securities. Therefore, the credit rating assigned to a particular instrument may not fully reflect the true risks of an investment in such instrument. Credit rating agencies may change their methods of evaluating credit risk and determining ratings. These changes may occur quickly and often. While we may give some consideration to ratings, ratings may not be indicative of the actual credit risk of our investments in rated instruments.
Prepayments of our debt investments by our portfolio companies could adversely impact our results of operations and reduce our return on equity.
We are subject to the risk that the investments we make in our portfolio companies may be repaid prior to maturity. When this occurs, we will generally reinvest these proceeds in temporary investments, pending their future investment in new portfolio companies. These temporary investments will typically have substantially lower yields than the debt being prepaid and we could experience significant delays in reinvesting these amounts. Any future investment in a new portfolio company may also be at lower yields than the debt that was repaid. As a result, our results of operations could be materially adversely affected if one or more of our portfolio companies elect to prepay amounts owed to us. Additionally, prepayments, net of prepayment fees, could negatively impact our return on equity. This risk will be more acute when interest rates decrease, as we may be unable to reinvest at rates as favorable as when we made our initial investment.
A redemption of convertible securities held by us could have an adverse effect on our ability to achieve our investment objective.
A convertible security may be subject to redemption at the option of the issuer at a price established in the convertible security’s governing instrument. If a convertible security held by us is called for redemption, we will be required to permit the issuer to redeem the security, convert it into the underlying common stock or sell it to a third party. Any of these actions could have an adverse effect on our ability to achieve our investment objective.
To the extent original issue discount (“OID”) and payment-in-kind (“PIK”) interest income constitute a portion of our income, we will be exposed to risks associated with the deferred receipt of cash representing such income.
Our investments may include OID and PIK instruments. To the extent OID and PIK constitute a portion of our income, we will be exposed to risks associated with such income being required to be included in income for financial reporting purposes in accordance with U.S. generally accepted accounting principles (“U.S. GAAP”) and taxable income prior to receipt of cash, including the following:
•Original issue discount instruments may have unreliable valuations because the accruals require judgments about collectability or deferred payments and the value of any associated collateral;
•Original issue discount instruments may create heightened credit risks because the inducement to the borrower to accept higher interest rates in exchange for the deferral of cash payments typically represents, to some extent, speculation on the part of the borrower;
54
•For U.S. GAAP purposes, cash distributions to shareholders that include a component of OID income do not come from paid-in capital, although they may be paid from the offering proceeds. Thus, although a distribution of OID income may come from the cash invested by the shareholders, the 1940 Act does not require that shareholders be given notice of this fact;
•The presence of OID and PIK creates the risk of non-refundable cash payments to our Adviser in the form of incentive fees on income based on non-cash OID and PIK accruals that may never be realized; and
•In the case of PIK, “toggle” debt, which gives the issuer the option to defer an interest payment in exchange for an increased interest rate in the future, the PIK election has the simultaneous effect of increasing the investment income, thus increasing the potential for realizing incentive fees.
Our portfolio companies may incur debt that ranks equally with, or senior to, our investments in such companies.
Our strategy focuses on investing primarily in the debt of privately owned U.S. companies in a broad range of technology-related industries with a focus on originated transactions sourced through the networks of our Adviser. Our portfolio companies may have, or may be permitted to incur, other debt that ranks equally with, or senior to, the debt in which we invest. By their terms, such debt instruments may entitle the holders to receive payment of interest or principal on or before the dates on which we are entitled to receive payments with respect to the debt instruments in which we invest. Also, in the event of insolvency, liquidation, dissolution, reorganization or bankruptcy of a portfolio company, any holders of debt instruments ranking senior to our investment in that portfolio company would typically be entitled to receive payment in full before we receive any distribution. After repaying such senior creditors, such portfolio company may not have any remaining assets to use for repaying its obligation to us. In the case of debt ranking equally with debt instruments in which we invest, we would have to share on an equal basis any distributions with other creditors holding such debt in the event of an insolvency, liquidation, dissolution, reorganization or bankruptcy of the relevant portfolio company and our portfolio company may not have sufficient assets to pay all equally ranking credit even if we hold senior, first-lien debt.
Our portfolio companies may be highly leveraged.
Some of our portfolio companies may be highly leveraged, which may have adverse consequences to these companies and to us as an investor. These companies may be subject to restrictive financial and operating covenants and the leverage may impair these companies’ ability to finance their future operations and capital needs. As a result, these companies’ flexibility to respond to changing business and economic conditions and to take advantage of business opportunities may be limited. Further, a leveraged company’s income and net assets will tend to increase or decrease at a greater rate than if borrowed money were not used.
If we cannot obtain debt financing or equity capital on acceptable terms, our ability to acquire investments and to expand our operations will be adversely affected.
Any working capital reserves we maintain may not be sufficient for investment purposes, and we may require additional debt financing or equity capital to operate. We generally are required to distribute at least 90% of our net ordinary income and net short-term capital gains in excess of net long-term capital losses, if any, to our shareholders to maintain our tax treatment as a RIC. Accordingly, in the event that we need additional capital in the future for investments or for any other reason we may need to access the capital markets periodically to issue debt or equity securities or borrow from financial institutions in order to obtain such additional capital. These sources of funding may not be available to us due to unfavorable economic conditions, which could increase our funding costs, limit our access to the capital markets or result in a decision by lenders not to extend credit to us. Consequently, if we cannot obtain further debt or equity financing on acceptable terms, our ability to acquire additional investments and to expand our operations will be adversely affected. As a result, we would be less able to diversify our portfolio and achieve our investment objective, which may negatively impact our results of operations and reduce our ability to make distributions to our shareholders. See “—If we are unable to obtain additional debt financing, or if our borrowing capacity is materially reduced, our business could be materially adversely affected.”
Defaults by our portfolio companies could jeopardize a portfolio company’s ability to meet its obligations under the debt or equity investments that we hold which could harm our operating results.
A portfolio company’s failure to satisfy financial or operating covenants imposed by us or other lenders could lead to defaults and, potentially, termination of its debt financing and foreclosure on its secured assets, which could trigger cross-defaults under other agreements and jeopardize a portfolio company’s ability to meet its obligations under the debt or equity investments that we hold. We may incur expenses to the extent necessary to seek recovery upon default or to negotiate new terms, which may include the waiver of certain financial covenants, with a defaulting portfolio company. In addition, some of the loans in which we may invest may be “covenant-lite” loans. We use the term “covenant-lite” loans to refer generally to loans that do not have a complete set of financial maintenance covenants. Generally, “covenant-lite” loans provide borrower companies more freedom to negatively impact lenders because their covenants are incurrence-based, which means they are only tested and can only be breached following an affirmative action of the borrower, rather than by a deterioration in the borrower’s financial condition. Accordingly, to the extent we invest in “covenant-lite” loans, we may have fewer rights against a borrower and may have a greater risk of loss on such investments as compared to investments in or exposure to loans with financial maintenance covenants.
55
As part of our lending activities, we may in certain opportunistic circumstances originate loans to companies that are experiencing significant financial or business difficulties, including companies involved in bankruptcy or other reorganization and liquidation proceedings. Any such investment would involve a substantial degree of risk. In any reorganization or liquidation proceeding relating to a company that we fund, we may lose all or part of the amounts advanced to the borrower or may be required to accept collateral with a value less than the amount of the loan advanced by us to the borrower.
Subordinated liens on collateral securing debt investments that we may make to portfolio companies may be subject to control by senior creditors with first priority liens. If there is a default, the value of the collateral may not be sufficient to repay in full both the first priority creditors and us.
Certain debt investments that we will make in portfolio companies will be secured on a second priority lien basis by the same collateral securing senior debt of such companies. We also make debt investments in portfolio companies secured on a first priority basis. The first priority liens on the collateral will secure the portfolio company’s obligations under any outstanding senior debt and may secure certain other future debt that may be permitted to be incurred by the portfolio company under the agreements governing the debt. In the event of a default, the holders of obligations secured by the first priority liens on the collateral will generally control the liquidation of and be entitled to receive proceeds from any realization of the collateral to repay their obligations in full before us.
In addition, the value of the collateral in the event of liquidation will depend on market and economic conditions, the availability of buyers and other factors. There can be no assurance that the proceeds, if any, from the sale or sales of all of the collateral would be sufficient to satisfy the debt obligations secured by the first priority or second priority liens after payment in full of all obligations secured by the first priority liens on the collateral. If such proceeds are not sufficient to repay amounts outstanding under the debt obligations secured by the first priority or second priority liens, then we, to the extent not repaid from the proceeds of the sale of the collateral, will only have an unsecured claim against the portfolio company’s remaining assets, if any.
We may also make unsecured debt investments in portfolio companies, meaning that such investments will not benefit from any interest in collateral of such companies. Liens on any such portfolio company’s collateral, if any, will secure the portfolio company’s obligations under its outstanding secured debt and may secure certain future debt that is permitted to be incurred by the portfolio company under its secured debt agreements. The holders of obligations secured by such liens will generally control the liquidation of, and be entitled to receive proceeds from, any realization of such collateral to repay their obligations in full before us. In addition, the value of such collateral in the event of liquidation will depend on market and economic conditions, the availability of buyers and other factors. There can be no assurance that the proceeds, if any, from sales of such collateral would be sufficient to satisfy our unsecured debt obligations after payment in full of all secured debt obligations. If such proceeds were not sufficient to repay the outstanding secured debt obligations, then our unsecured claims would rank equally with the unpaid portion of such secured creditors’ claims against the portfolio company’s remaining assets, if any.
The rights we may have with respect to the collateral securing the debt investments we make in our portfolio companies with senior debt outstanding may also be limited pursuant to the terms of one or more inter-creditor agreements that we enter into with the holders of senior debt. Under such an inter-creditor agreement, at any time obligations that have the benefit of the first priority liens are outstanding, any of the following actions that may be taken in respect of the collateral will be at the direction of the holders of the obligations secured by the first priority liens: the ability to cause the commencement of enforcement proceedings against the collateral; the ability to control the conduct of such proceedings; the approval of amendments to collateral documents; releases of liens on the collateral; and waivers of past defaults under collateral documents. We may not have the ability to control or direct such actions, even if our rights are adversely affected.
Certain of our investments may be adversely affected by laws relating to fraudulent conveyance or voidable preferences.
Certain of our investments could be subject to federal bankruptcy law and state fraudulent transfer laws, which vary from state to state, if the debt obligations relating to certain investments were issued with the intent of hindering, delaying or defrauding creditors or, in certain circumstances, if the issuer receives less than reasonably equivalent value or fair consideration in return for issuing such debt obligations. If the debt proceeds are used for a buyout of shareholders, this risk is greater than if the debt proceeds are used for day-to-day operations or organic growth. If a court were to find that the issuance of the debt obligations was a fraudulent transfer or conveyance, the court could void or otherwise refuse to recognize the payment obligations under the debt obligations or the collateral supporting such obligations, further subordinate the debt obligations or the liens supporting such obligations to other existing and future indebtedness of the issuer or require us to repay any amounts received by us with respect to the debt obligations or collateral. In the event of a finding that a fraudulent transfer or conveyance occurred, we may not receive any repayment on such debt obligations.
Under certain circumstances, payments to us and distributions by us to our shareholders may be reclaimed if any such payment or distribution is later determined to have been a fraudulent conveyance, preferential payment or similar transaction under applicable bankruptcy and insolvency laws. Furthermore, investments in restructurings may be adversely affected by statutes relating to, among other things, fraudulent conveyances, voidable preferences, lender liability and the court’s discretionary power to disallow, subordinate or disenfranchise particular claims or re-characterize investments made in the form of debt as equity contributions.
56
There may be circumstances where our debt investments could be subordinated to claims of other creditors or we could be subject to lender liability claims.
Although we intend to structure certain of our investments as senior debt, if one of our portfolio companies were to go bankrupt, depending on the facts and circumstances, including the extent to which we provided managerial assistance to that portfolio company or a representative of us or our Adviser sat on the board of directors of such portfolio company, a bankruptcy court might re-characterize our debt investment and subordinate all or a portion of our claim to that of other creditors. In situations where a bankruptcy carries a high degree of political significance, our legal rights may be subordinated to other creditors.
In addition, a number of U.S. judicial decisions have upheld judgments obtained by borrowers against lending institutions on the basis of various evolving legal theories, collectively termed “lender liability.” Generally, lender liability is founded on the premise that a lender has violated a duty (whether implied or contractual) of good faith, commercial reasonableness and fair dealing, or a similar duty owed to the borrower or has assumed an excessive degree of control over the borrower resulting in the creation of a fiduciary duty owed to the borrower or its other creditors or shareholders. Because of the nature of our investments in portfolio companies (including that, as a BDC, we may be required to provide managerial assistance to those portfolio companies if they so request upon our offer), we may be subject to allegations of lender liability.
We generally will not control the business operations of our portfolio companies and, due to the illiquid nature of our holdings in our portfolio companies, we may not be able to dispose of our interests in our portfolio companies.
We do not currently, and do not expect in the future to control most of our portfolio companies, although we may have board representation or board observation rights, and our debt agreements may impose certain restrictive covenants on our borrowers. As a result, we are subject to the risk that a portfolio company in which we invest may make business decisions with which we disagree and the management of such company, as representatives of the holders of their common equity, may take risks or otherwise act in ways that do not serve our interests as a debt investor. Due to the lack of liquidity for our investments in private companies, we may not be able to dispose of our interests in our portfolio companies as readily as we would like or at a favorable value. As a result, a portfolio company may make decisions that could decrease the value of our portfolio holdings.
We and our portfolio companies are, and will continue to be, exposed to risks associated with changes in interest rates.
General interest rate fluctuations and changes in credit spreads on floating rate loans may have a substantial negative impact on our portfolio company investments and our investment opportunities and, accordingly, may have a material adverse effect on our rate of return on invested capital, our net investment income and our net asset value. The majority of our debt investments have, and are expected to have, variable interest rates that reset periodically based on benchmarks such as the SOFR, the SONIA, the Euro Interbank Offered Rate, the Federal Funds rate or Prime rate. The Federal Reserve decreased the federal funds rate three times in 2025. A reduction in the interest rates on new investments relative to interest rates on current investments could have an adverse impact on our net investment income. On the other hand, increases in interest rates have made and may continue to make it more difficult for our portfolio companies to service their obligations under the debt investments that we will hold and may increase defaults even where our investment income increases. Elevated interest rates could also cause borrowers to shift cash from other productive uses to the payment of interest, which may have a material adverse effect on their business and operations and could, over time, lead to increased defaults. Additionally, higher interest rate loans may be less liquid as fewer investors may be willing to purchase such loans in the secondary market in light of the increased risk of a default by the borrower and the heightened risk of a loss of an investment in such loans. All of these risks may be exacerbated when interest rates rise rapidly and/or significantly. Decreases in credit spreads on debt that pays a floating rate of return would have an impact on the income generation of our floating rate assets. Trading prices for debt that pays a fixed rate of return tend to fall as interest rates rise. Trading prices tend to fluctuate more for fixed rate securities that have longer maturities.
Conversely, when interest rates decline, borrowers may refinance their loans at lower interest rates, which could shorten the average life of the loans and reduce the associated returns on the investment, as well as require our Adviser and the Adviser’s personnel to incur management time and expense to re-deploy such proceeds, including on terms that may not be as favorable as our existing loans.
In addition, because we borrow money to make investments, our net investment income will depend, in part, upon the difference between the rate at which we borrow funds and the rate at which we invest those funds. In periods of declining interest rates, we may earn less interest income from investments and our cost of funds will also decrease, to a lesser extent, given certain of our currently outstanding indebtedness bears interest at fixed rates, resulting in lower net investment income. Conversely, in periods of rising interest rates, our interest income will increase as the majority of our portfolio bears interest at variable rates while our cost of funds will also increase, to a lesser extent, resulting in an increase to our net investment income. In addition, in periods of elevated interest rates, our cost of funds increases, which tends to reduce our net investment income. We can offer no assurance that a significant change in market interest rates will not have a material adverse effect on our net investment income.
We may hedge against interest rate fluctuations by using standard hedging instruments such as interest rate swap agreements, futures, options and forward contracts, subject to applicable legal requirements, including all necessary registrations (or exemptions from registration) with the Commodity Futures Trading Commission. In addition, our interest expense may not decrease at the same
57
rate as overall interest rates because of our fixed rate borrowings, which could lead to greater declines in our net investment income. These activities may limit our ability to participate in the benefits of lower interest rates with respect to the hedged borrowings. Adverse developments resulting from changes in interest rates or hedging transactions could have a material adverse effect on our business, financial condition and results of operations.
We do not have a policy governing the maturities of our investments. This means that we are subject to greater risk (other things being equal) than a fund invested solely in shorter-term securities. A decline in the prices of the debt we own could adversely affect our net asset value. Also, an increase in interest rates available to investors could make an investment in our common stock less attractive if we are not able to increase our dividend rate.
International investments create additional risks.
We may make investments in portfolio companies that are domiciled outside of the United States. Pursuant to our investment policies, we will not invest more than 20% of our total assets in companies whose principal place of business is outside the United States, although we do not generally intend to invest in companies whose principal place of business is an emerging market. Our investments in foreign portfolio companies are deemed “non-qualifying assets,” which means that, as required by the 1940 Act, such investments, along with other investments in non-qualifying assets, may not constitute more than 30% of our total assets at the time of our acquisition of any such asset, after giving effect to the acquisition. Notwithstanding the limitation on our ownership of foreign portfolio companies, such investments subject us to many of the same risks as our domestic investments, as well as certain additional risks, including the following:
•foreign governmental laws, rules and policies, including those relating to taxation and bankruptcy and restricting the ownership of assets in the foreign country or the repatriation of profits from the foreign country to the United States and any adverse changes in these laws;
•foreign currency devaluations that reduce the value of and returns on our foreign investments;
•adverse changes in the availability, cost and terms of investments due to the varying economic policies of a foreign country in which we invest;
•adverse changes in tax rates, the tax treatment of transaction structures and other changes in operating expenses of a particular foreign country in which we invest;
•the assessment of foreign-country taxes (including withholding taxes, transfer taxes and value added taxes, any or all of which could be significant) on income or gains from our investments in the foreign country;
•changes that adversely affect the social, political and/or economic stability of a foreign country in which we invest;
•high inflation in the foreign countries in which we invest, which could increase the costs to us of investing in those countries;
•deflationary periods in the foreign countries in which we invest, which could reduce demand for our assets in those countries and diminish the value of such investments and the related investment returns to us; and
•legal and logistical barriers in the foreign countries in which we invest that materially and adversely limit our ability to enforce our contractual rights with respect to those investments.
In addition, we may make investments in countries whose governments or economies may prove unstable. Certain of the countries in which we may invest may have political, economic and legal systems that are unpredictable, unreliable or otherwise inadequate with respect to the implementation, interpretation and enforcement of laws protecting asset ownership and economic interests. In some of the countries in which we may invest, there may be a risk of nationalization, expropriation or confiscatory taxation, which may have an adverse effect on our portfolio companies in those countries and the rates of return that we are able to achieve on such investments. We may also lose the total value of any investment which is nationalized, expropriated or confiscated. The financial results and investment opportunities available to us, particularly in developing countries and emerging markets, may be materially and adversely affected by any or all of these political, economic and legal risks.
We may expose ourselves to risks if we engage in risk management activities.
We have entered, and may in the future enter, into hedging transactions, which may expose us to risks associated with such transactions. We may seek to utilize instruments such as forward contracts, currency options and interest rate swaps, caps, collars and floors to seek to hedge against fluctuations in the relative values of our portfolio positions from changes in currency exchange rates and market interest rates and the relative value of certain debt securities from changes in market interest rates. Use of these hedging instruments may include counter-party credit risk. The scope of risk management activities we undertake varies based on the level of interest rates, prevailing foreign currency exchange rates, the types of investments that are made and other changing market conditions. To the extent we have non-U.S. investments, particularly investments denominated in non-U.S. currencies, our hedging costs will increase.
Hedging against a decline in the values of our portfolio positions would not eliminate the possibility of fluctuations in the values of such positions or prevent losses if the values of such positions were to decline. However, such hedging can establish other positions designed to gain from those same developments, thereby offsetting the decline in the value of such portfolio positions. Such hedging
58
transactions may also limit the opportunity for gain if the values of the underlying portfolio positions were to increase. It also may not be possible to hedge against an exchange rate or interest rate fluctuation that is so generally anticipated that we are not able to enter into a hedging transaction at an acceptable price.
The success of our hedging strategy will depend on our ability to correctly identify appropriate exposures for hedging. In connection with the March 2028 and April 2029 Notes, which bear interest at fixed rates, we entered into interest rate swaps to continue to align the interest rates of our liabilities with our investment portfolio, which consists of predominately floating rate loans. However, unanticipated changes in currency exchange rates or other exposures that we might hedge may result in poorer overall investment performance than if we had not engaged in any such hedging transactions. In addition, the degree of correlation between price movements of the instruments used in a hedging strategy and price movements in the portfolio positions being hedged may vary, as may the time period in which the hedge is effective relative to the time period of the related exposure.
For a variety of reasons, we may not seek to (or be able to) establish a perfect correlation between such hedging instruments and the positions being hedged. Any such imperfect correlation may prevent us from achieving the intended hedge and expose us to risk of loss. In addition, it may not be possible to hedge fully or perfectly against currency fluctuations affecting the value of securities denominated in non-U.S. currencies because the value of those securities is likely to fluctuate as a result of factors not related to currency fluctuations. Income derived from hedging transactions also is not eligible to be distributed to non-U.S. stockholders free from withholding taxes. Changes to the regulations applicable to the financial instruments we use to accomplish our hedging strategy could affect the effectiveness of that strategy. See “—The market structure applicable to derivatives imposed by the Dodd-Frank Act, the U.S. Commodity Futures Trading Commission (“CFTC”) and the SEC may affect our ability to use over-the-counter (“OTC”) derivatives for hedging purposes” and “We and our portfolio companies are, and will continue to be, exposed to risks associated with changes in interest rates.”
The market structure applicable to derivatives imposed by the Dodd-Frank Act, the U.S. Commodity Futures Trading Commission (“CFTC”) and the SEC may affect our ability to use over-the-counter (“OTC”) derivatives for hedging purposes.
The CFTC and the SEC have issued final rules establishing that certain swap transactions are subject to CFTC regulation. Engaging in such swap or other commodity interest transactions such as futures contracts or options on futures contracts may cause us to fall within the definition of “commodity pool” under the Commodity Exchange Act and related CFTC regulations. Our Adviser has claimed relief from CFTC registration and regulation as a commodity pool operator with respect to our operations, with the result that we are limited in our ability to use futures contracts or options on futures contracts or engage in swap transactions. Specifically, we are subject to strict limitations on using such derivatives other than for hedging purposes, whereby the use of derivatives not used solely for hedging purposes is generally limited to situations where (i) the aggregate initial margin and premiums required to establish such positions does not exceed five percent of the liquidation value of our portfolio, after taking into account unrealized profits and unrealized losses on any such contracts we have entered into; or (ii) the aggregate net notional value of such derivatives does not exceed 100% of the liquidation value of our portfolio. The Dodd-Frank Act also imposed requirements relating to real-time public and regulatory reporting of OTC derivative transactions, enhanced documentation requirements, position limits on an expanded array of derivatives, and recordkeeping requirements. Taken as a whole, these changes could significantly increase the cost of using uncleared OTC derivatives to hedge risks, including interest rate and foreign exchange risk; reduce the level of exposure we are able to obtain for risk management purposes through OTC derivatives (including as the result of the CFTC imposing position limits on additional products); reduce the amounts available to us to make non-derivatives investments; impair liquidity in certain OTC derivatives; and adversely affect the quality of execution pricing obtained by us, all of which could adversely impact our investment returns.
In addition, as a result of rules adopted by U.S. and foreign regulators concerning certain financial contracts, including OTC derivatives, entered into with counterparties that have been designated as global systemically important banking organizations, we may be restricted in our ability to terminate such contracts following the occurrence of certain insolvency-related default events. Transactions with these counterparties, therefore, carry heightened risk in the event that the counterparty defaults on its obligations to us.
Our ability to enter into transactions involving derivatives and financial commitment transactions may be limited.
Rule 18f-4 requires a BDC (or a registered investment company) that uses derivatives to, among other things, comply with a value-at-risk leverage limit, adopt a derivatives risk management program and implement certain testing and board reporting requirements. Rule 18f-4 exempts BDCs that qualify as “limited derivatives users” from the aforementioned requirements, provided that these BDCs adopt written policies and procedures that are reasonably designed to manage the BDC’s derivatives risks and comply with certain recordkeeping requirements. Under Rule 18f-4, a BDC may enter into an unfunded commitment agreement that is not a derivatives transaction, such as an agreement to provide financing to a portfolio company, if the BDC has, among other things, a reasonable belief, at the time it enters into such an agreement, that it will have sufficient cash and cash equivalents to meet its obligations with respect to all of its unfunded commitment agreements, in each case as it becomes due. Collectively, these requirements may limit our ability to use derivatives and/or enter into certain other financial contracts.
59
We may enter into total return swaps that would expose us to certain risks, including market risk, liquidity risk and other risks similar to those associated with the use of leverage.
A total return swap is a contract in which one party agrees to make periodic payments to another party based on the change in the market value of the assets underlying the total return swap, which may include a specified security or loan, basket of securities or loans or securities or loan indices during the specified period, in return for periodic payments based on a fixed or variable interest rate. A total return swap is typically used to obtain exposure to a security, loan or market without owning or taking physical custody of such security or loan or investing directly in such market. A total return swap may effectively add leverage to our portfolio because, in addition to our total net assets, we would be subject to investment exposure on the amount of securities or loans subject to the total return swap. A total return swap is also subject to the risk that a counterparty will default on its payment obligations thereunder or that we will not be able to meet our obligations to the counterparty. In addition, because a total return swap is a form of synthetic leverage, such arrangements are subject to risks similar to those associated with the use of leverage.
Our investment strategy focuses on technology-related companies, which are subject to many risks, including volatility, intense competition, shortened product life cycles, changes in regulatory and governmental programs and periodic downturns, and you could lose all or part of your investment.
We have adopted a policy to invest, under normal circumstances, at least 80% of the value of our assets in technology-related companies, many of which may have narrow product lines and small market shares, which tend to render them more vulnerable to competitors’ actions and market conditions, as well as to general economic downturns. The revenues, income (or losses), and valuations of technology-related companies can and often do fluctuate suddenly and dramatically. In addition, technology-related industries are generally characterized by abrupt business cycles and intense competition. Overcapacity in technology-related industries, together with cyclical economic downturns, may result in substantial decreases in the market capitalization of many technology-related companies. Such decreases in market capitalization may occur again, and any future decreases in technology-related company valuations may be substantial and may not be temporary in nature. Therefore, our portfolio companies may face considerably more risk of loss than do companies in other industry sectors.
Because of rapid technological change, the average selling prices of products and some services provided by technology-related companies have historically decreased over their productive lives. As a result, the average selling prices of products and services offered by technology-related companies may decrease over time, which could adversely affect their operating results, their ability to meet obligations under their debt securities and the value of their equity securities. This could, in turn, materially adversely affect our business, financial condition and results of operations.
We may invest in technology -related companies that are reliant on U.S. and foreign regulatory and governmental program. Any material changes or discontinuation, due to change in administration or U.S. Congress or otherwise could have a material adverse effect on the operations of a portfolio company in these industries and, in turn, impair our ability to timely collect principal and interest payments owed to us to the extent applicable.
Our investments in life sciences-related companies may be subject to extensive government regulation, litigation risk and certain other risks particular to that industry.
We may invest in life sciences-related that may be subject to extensive regulation by federal, state and other foreign agencies. If any of these portfolio companies fail to comply with applicable regulations, they could be subject to significant penalties and claims that could materially and adversely affect their operations. Portfolio companies that produce medical devices or drugs are subject to the expense, delay and uncertainty of the regulatory approval process for their products and, even if approved, these products may not be accepted in the marketplace. In addition, governmental budgetary constraints effecting the regulatory approval process, new laws, regulations or judicial interpretations of existing laws and regulations might adversely affect a portfolio company in this industry.
Life sciences-related portfolio companies may also have a limited number of suppliers of necessary components or a limited number of manufacturers for their products, and therefore face a risk of disruption to their manufacturing process if they are unable to find alternative suppliers when needed. Any of these factors could materially and adversely affect the operations of a life sciences-related portfolio company and, in turn, impair our ability to timely collect principal and interest payments owed to us.
We may be subject to risks associated with our investments in the software industry.
Portfolio companies in the software industry are subject to a number of risks. The revenue, income (or losses) and valuations of software and other technology-related companies can and often do fluctuate suddenly and dramatically. In addition, because of rapid technological change, the average selling prices of software products have historically decreased over their productive lives. As a result, the average selling prices of software offered by our portfolio companies may decrease over time, which could adversely affect their operating results and, correspondingly, the value of any securities that we may hold. Additionally, companies operating in the software industry are subject to vigorous competition, changing technology, changing client and end-consumer needs, evolving industry standards and frequent introductions of new products and services. Our portfolio companies in the software industry may compete with other companies that operate in the global, regional and local software industries, and those competitors may be engaged in a greater range of businesses, have a larger installed base of customers for their existing products and services or have greater financial, technical, sales or other resources than our portfolio companies do. Our portfolio companies may lose market share if their
60
competitors introduce or acquire new products that compete with their software and related services or add new features to their products. Any of this could, in turn, materially adversely affect our business, financial condition and results of operations.
We cannot guarantee that we will be able to obtain various required licenses in U.S. states or in any other jurisdiction where they may be required in the future.
We are required to have and may be required in the future to obtain various state licenses to, among other things, originate commercial loans, and may be required to obtain similar licenses from other authorities, including outside of the United States, in the future in connection with one or more investments. Applying for and obtaining required licenses can be costly and take several months. We cannot assure you that we will maintain or obtain all of the licenses that we need on a timely basis. We also are and will be subject to various information and other requirements to maintain and obtain these licenses, and we cannot assure you that we will satisfy those requirements. Our failure to maintain or obtain licenses that we require, now or in the future, might restrict investment options and have other adverse consequences.
Certain investment analyses and decisions by our Adviser may be required to be undertaken on an expedited basis.
Investment analyses and decisions by our Adviser may be required to be undertaken on an expedited basis to take advantage of certain investment opportunities. While we generally will not seek to make an investment until our Adviser has conducted sufficient due diligence to make a determination as to the acceptability of the credit quality of the investment and the underlying issuer, in such cases, the information available to our Adviser at the time of making an investment decision may be limited. Therefore, no assurance can be given that our Adviser will have knowledge of all circumstances that may adversely affect an investment. In addition, our Adviser may rely upon independent consultants and others in connection with its evaluation of proposed investments. No assurance can be given as to the accuracy or completeness of the information provided by such independent consultants and we may incur liability as a result of such consultants’ actions, many of whom we will have limited recourse against in the event of any such inaccuracies.
We may not have the funds or ability to make additional investments in our portfolio companies.
After our initial investment in a portfolio company, we may be called upon from time to time to provide additional funds to such company or have the opportunity to increase our investment through the exercise of a warrant or other right to purchase common stock. There is no assurance that we will make, or will have sufficient funds to make, follow-on investments. Even if we do have sufficient capital to make a desired follow-on investment, we may elect not to make a follow-on investment because we may not want to increase our level of risk, we prefer other opportunities, we are limited in our ability to do so by compliance with BDC requirements, or in order to maintain our RIC status. Our ability to make follow-on investments may also be limited by our Adviser’s allocation policies. Any decision not to make a follow-on investment or any inability on our part to make such an investment may have a negative impact on a portfolio company in need of such an investment, may result in a missed opportunity for us to increase our participation in a successful investment or may reduce the expected return to us on the investment.
We are subject to certain risks as a result of our interests in the CLO Preferred Shares.
Under the terms of the loan sale agreements entered into in connection with our debt securitization transactions with respect to the CLOs (collectively, the “CLO Transactions”), we and certain financing subsidiaries sold and/or contributed to the respective issuers in connection with the particular CLO Transaction (the "CLO Issuers"), all of the ownership interest in the portfolio loans and participations held by the CLO Issuers on the closing date for the CLO Transaction for the purchase price and other consideration set forth in such loan sale agreements. As a result of the CLO Transactions, we hold all of the preferred shares issued by the CLO Issuers (collectively, the “CLO Preferred Shares”), which comprise 100% of the equity interests (other than, in the case of CLO Issuers domiciled in the Cayman Islands, certain nominal interests held by a charitable trust for purposes of limiting the ability of the CLO Issuers to file for bankruptcy) in the CLO Issuers and in the case of certain CLO Transactions which have a Delaware limited liability company as co-issuer (the "CLO Co-Issuers"), such CLO Issuer in turn owns 100% of the equity of such CLO Co-Issuer. In the case of CLO Issuers organized in Delaware, we own the equity interests of such CLO Issuer (i.e., the CLO Preferred Shares). As a result, we expect to consolidate the financial statements of the CLO Issuers in our consolidated financial statements. However, once sold or contributed to a CLO, the underlying loans and participation interests have been securitized and are no longer our direct investment, and the risk return profile has been altered. In general, rather than holding interests in the underlying loans and participation interests, the CLO Transactions resulted in us holding equity interests in the CLO Issuers, with the CLO Issuers holding the underlying loans. As a result, we are subject both to the risks and benefits associated with the Preferred Shares and, indirectly, the risks and benefits associated with the underlying loans and participation interests held by the CLO Issuers. In addition, our ability to sell, amend or otherwise modify an underlying loan held by a CLO Issuer is subject to certain conditions and restrictions under the applicable CLO Transactions, which may prevent us from taking actions that we would take if we held such underlying loan directly.
The subordination of the CLO Preferred Shares will affect our right to payment.
The respective CLO Preferred Shares are subordinated to the notes issued and amounts borrowed by the CLO Issuers and CLO Co-Issuers, as applicable (collectively, the “CLO Debt”), respectively, and certain fees and expenses. If an overcollateralization test or an interest coverage test is not satisfied as of a determination date, the proceeds from the underlying loans otherwise payable to a CLO Issuer (which such CLO Issuer could have distributed with respect to the CLO Preferred Shares of such CLO Issuer) will be diverted
61
to the payment of principal on the CLO Debt of such CLO Issuer. See “—The CLO Indentures require mandatory redemption of the respective CLO Debt for failure to satisfy coverage tests, which would reduce the amounts available for distribution to us.”
On the scheduled maturity of the CLO Debt of a CLO Issuer or if such CLO Debt is accelerated after an event of default, proceeds available after the payment of certain administrative expenses will be applied to pay both principal of and interest on the such CLO Debt until such CLO Debt is paid in full before any further payment will be made on the CLO Preferred Shares of such CLO Issuer. As a result, such CLO Preferred Shares would not receive any payments until such CLO Debt is paid in full and under certain circumstances may not receive payments at any time.
In addition, if an event of default occurs and is continuing with respect to the CLO Debt of a CLO Issuer, the holders of such CLO Debt will be entitled to determine the remedies to be exercised under the indenture pursuant to which such CLO Debt was issued (each a “CLO Indenture” and collectively, the “CLO Indentures”). Remedies pursued by the holders of CLO Debt could be adverse to our interests as the holder of CLO Preferred Shares, and the holders of CLO Debt will have no obligation to consider any possible adverse effect on such our interest or the interest of any other person. See “ —The holders of certain CLO Debt will control many rights under the CLO Indentures and therefore, we will have limited rights in connection with an event of default or distributions thereunder.”
The CLO Preferred Shares represent leveraged investments in the underlying loan portfolio of the applicable CLO Issuer, which is a speculative investment technique that increases the risk to us as the owner of the CLO Preferred Shares. As the junior interest in a leveraged capital structure, the CLO Preferred Shares will bear the primary risk of deterioration in the performance of the applicable CLO Issuer and its portfolio of underlying loans.
The holders of certain CLO Debt will control many rights under the CLO Indentures and therefore, we will have limited rights in connection with an event of default or distributions thereunder.
Under each CLO Indenture, as long as any CLO Debt of the applicable CLO Issuer is outstanding, the holders of the senior-most outstanding class of such CLO Debt will have the right to direct the trustee or the applicable CLO Issuer to take certain actions under the applicable CLO Indenture or any related credit agreement. For example, these holders will have the right, following an event of default, to direct certain actions and control certain decisions, including the right to accelerate the maturity of applicable CLO Debt and, under certain circumstances, the liquidation of the collateral. Remedies pursued by such holders upon an event of default could be adverse to our interests.
Although we, as the holder of the CLO Preferred Shares, will have the right, subject to the conditions set forth in the CLO Indentures, to purchase assets in any liquidation of assets by the collateral trustee, if an event of default has occurred and is continuing, we will not have any creditors’ rights against the applicable CLO Issuer and will not have the right to determine the remedies to be exercised under the applicable CLO Indenture. There is no guarantee that any funds will remain to make distributions to us as the holder of the CLO Preferred Shares following any liquidation of assets and the application of the proceeds from such assets to pay the applicable CLO Debt and the fees, expenses, and other liabilities payable by the applicable CLO Issuer.
The CLO Indentures require mandatory redemption of the respective CLO Debt for failure to satisfy coverage tests, which would reduce the amounts available for distribution to us.
Under the CLO Indentures governing the CLO Transactions, there are two coverage tests applicable to CLO Debt. These tests apply to each CLO Transaction separately. If either coverage test with respect to a CLO Transaction is not satisfied on any determination date on which such test is applicable, the applicable CLO Issuer must apply available amounts to redeem its CLO Debt in an amount necessary to cause such test to be satisfied. This would reduce or eliminate the amounts otherwise available to make distributions to us as the holder of the CLO Preferred Shares of such CLO Issuer.
Climate change and climate-related effects may expose us to systemic, global, macroeconomic risks and could adversely affect our business and the businesses of our products’ portfolio companies.
Global climate change is widely considered to be a significant threat to the global economy. We and the companies in which we invest may face risks associated with climate change, including physical risks such as an increased frequency or severity of extreme weather events and rising sea levels and temperatures. In addition, climate change may also impact our profitability and costs, as well as pose systemic risks for our businesses and those of the companies in which we invest. For example, to the extent weather conditions are affected by climate change, energy use by us or the companies in which we invest could increase or decrease depending on the duration and magnitude of any changes. Increases in the cost of energy could adversely affect the cost of operations of us or the companies in which we invest. On the other hand, a decrease in energy use due to weather changes may affect the financial condition of some of the companies in which we invest through decreased revenues. Additionally, extreme weather conditions in general require more system backup, adding to costs, including costs of insurance (particularly for real estate in certain regions), and can contribute to increased system stresses, including service interruptions.
While the United States has withdrawn from the Paris Agreement, various other regulatory and voluntary initiatives launched by international, federal, state, and regional policymakers and regulatory authorities as well as private actors seeking to reduce greenhouse gas emissions may expose our business operations, products and products’ portfolio companies to other types of transition risks, such as: (i) political and policy risks, (including changing regulatory incentives, and legal requirements including with respect to
62
greenhouse gas emissions that could result in increased costs or changes in business operations), (ii) regulatory and litigation risks (including changing legal requirements that could result in increased permitting, tax and compliance costs, enhanced disclosure obligations, changes in business operations, or the discontinuance of certain operations, and litigation seeking monetary or injunctive relief related to impacts related to climate change), (iii) technology and market risks (including declining market for investments in industries seen as greenhouse gas intensive or less effective than alternatives in reducing greenhouse gas emissions), (iv) business trend risks (including requirements for certain portfolio companies related to capital expenditures, product or service redesigns, and changes to operations and supply chains to meet changing customer expectations, and the increased attention to ESG considerations by our investors including in connection with their determination of whether to invest), and (v) potential harm to our reputation if our shareholders believe that we are not adequately or appropriately responding to climate change and/or climate risk management, including through the way in which we operate our business, the composition of portfolio, our new investments or the decisions we make to continue to conduct or change our activities in response to climate change considerations.
Risks Related to an Investment in Our Common Stock
The market value of our common stock may fluctuate significantly.
In the past, shares of BDCs, including at times shares of our common stock, have traded at prices per share below net asset value per share. We cannot predict whether our common stock will trade at a price per share above, at or below net asset value per share. The value and liquidity, if any, of the market for shares of our common stock may be significantly affected by numerous factors, some of which are beyond our control and may not be directly related to our operating performance. These factors include:
•changes in the value of our portfolio of investments and derivative instruments as a result of changes in market factors, such as interest rate shifts, and also portfolio specific performance, such as portfolio company defaults, among other reasons;
•changes in regulatory policies or tax guidelines, particularly with respect to RICs or BDCs;
•loss of RIC tax treatment or BDC status;
•distributions that exceed our net investment income and net income as reported according to U.S. GAAP;
•changes in earnings or variations in operating results;
•changes in accounting guidelines governing valuation of our investments;
•adverse publicity about the investment management industry generally or individual scandals specifically;
•a breach of our computer systems, software or networks, or misappropriation of our proprietary information;
•any shortfall in revenue or net income or any increase in losses from levels expected by investors;
•departure of our Adviser or certain of its key personnel;
•general economic trends and other external factors; and
•loss of a major funding source.
Sales of substantial amounts of our common stock in the public market may have an adverse effect on the market price of our common stock.
Sales of substantial amounts of our common stock or the perception that such sales could occur could adversely affect the prevailing market prices for our common stock. If this occurs, it could impair our ability to raise additional capital through the sale of equity securities should we desire to do so. We cannot predict what effect, if any, future sales of securities or the availability of securities for future sales will have on the market price of our common stock prevailing from time to time.
Our stock repurchase program could affect the price of our common stock and increase volatility and may be suspended or terminated at any time, which may result in a decrease in the trading price of our common stock.
Our Board has approved a share repurchase program for us to repurchase shares of our common stock and may approve additional share repurchase programs in the future. On May 27, 2025, our Board approved the 2025 Stock Repurchase Program under which we may repurchase up to $200 million of our outstanding common stock. Under the 2025 Stock Repurchase Program, purchases may be made at management’s discretion from time to time in open-market transactions, in accordance with all applicable securities laws and regulations. Unless extended by our Board, the 2025 Stock Repurchase Program will terminate 18-months from the date of the Exchange Listing.
The 2025 Stock Repurchase Program is discretionary and whether purchases will be made under the 2025 Stock Repurchase Program and how much will be purchased at any time is uncertain, dependent on prevailing market prices and trading volumes, all of which we cannot predict. These activities and activities under any future stock repurchase programs may have the effect of maintaining the market price of our common stock or retarding a decline in the market price of the common stock, and, as a result, the price of our common stock may be higher than the price that otherwise might exist in the open market. Repurchases pursuant to the 2025 Stock Repurchase Program and any future stock repurchase programs could affect the price of our common stock and increase its volatility. The existence of the 2025 Stock Repurchase Program could also cause the price of our common stock to be higher than it
63
would be in the absence of such a plan and could potentially reduce the market liquidity for our common stock. There can be no assurance that any stock repurchases will enhance stockholder value because the market price of our common stock may decline below the levels at which we repurchased such shares. Any failure to repurchase shares after we have announced our intention to do so may negatively impact our reputation and investor confidence in us and may negatively impact our stock price. Although the 2025 Stock Repurchase Program is intended to enhance long-term stockholder value, short-term stock price fluctuations could reduce the 2025 Stock Repurchase Program’s effectiveness.
A shareholder’s interest in us will be diluted if we issue additional shares, which could reduce the overall value of an investment in us.
Our shareholders do not have preemptive rights to purchase any shares we issue in the future. Our charter authorizes us to issue up to 1 billion shares of common stock. Pursuant to our charter, a majority of our entire Board may amend our charter to increase the number of shares of common stock we may issue without shareholder approval. Our Board may elect to sell additional shares in the future or issue equity interests in private offerings. To the extent we issue additional equity interests at or below net asset value, your percentage ownership interest in us may be diluted. In addition, depending upon the terms and pricing of any additional offerings and the value of our investments, you may also experience dilution in the book value and fair value of your shares.
Under the 1940 Act, we generally are prohibited from issuing or selling our common stock at a price below net asset value per share, which may be a disadvantage as compared with certain public companies. We may, however, sell our common stock, or warrants, options, or rights to acquire our common stock, at a price below the current net asset value of our common stock if our Board and independent directors determine that such sale is in our best interests and the best interests of our shareholders, and our shareholders, including a majority of those shareholders that are not affiliated with us, approve such sale. In any such case, the price at which our securities are to be issued and sold may not be less than a price that, in the determination of our Board, closely approximates the fair value of such securities (less any distributing commission or discount). If we raise additional funds by issuing common stock or senior securities convertible into, or exchangeable for, our common stock, then the percentage ownership of our shareholders at that time will decrease and you will experience dilution.
Certain provisions of our charter and actions of our Board could deter takeover attempts and have an adverse impact on the value of shares of our common stock.
Our charter, as well as certain statutory and regulatory requirements, contain certain provisions that may have the effect of discouraging a third party from attempting to acquire us. Our Board is divided into three classes of directors serving staggered three-year terms, which could prevent shareholders from removing a majority of directors in any given election. Our Board may, without shareholder action, authorize the issuance of shares in one or more classes or series, including shares of preferred stock; and our Board may, without shareholder action, amend our charter to increase the number of shares of our common stock, of any class or series, that we will have authority to issue. These anti-takeover provisions may inhibit a change of control in circumstances that could give the holders of shares of our common stock the opportunity to realize a premium over the value of shares of our common stock.
Investing in our securities involves a high degree of risk.
The investments we make in accordance with our investment objective may result in a higher amount of risk than alternative investment options, including volatility or loss of principal. Our investments in portfolio companies may be highly speculative and aggressive and, therefore, an investment in our common stock may not be suitable for someone with lower risk tolerance.
We may experience fluctuations in our quarterly results.
We could experience fluctuations in our quarterly operating results due to a number of factors, including our ability or inability to make investments in companies that meet our investment criteria, the interest rate payable on the loans or other debt securities we originate or acquire, the level of our expenses (including our borrowing costs), variations in and the timing of the recognition of realized and unrealized gains or losses, the degree to which we encounter competition in our markets and general economic conditions. As a result of these factors, results for any previous period should not be relied upon as being indicative of performance in future periods or the full fiscal year.
The amount of any distributions we may make on our common stock is uncertain. We may not be able to pay distributions to shareholders, or be able to sustain distributions at any particular level, and our distributions per share, if any, may not grow over time, and our distributions per share may be reduced. We have not established any limits on the extent to which we may use borrowings, if any, and we may use sources other than cash flows from operations to fund distributions (which may reduce the amount of capital we ultimately invest in portfolio companies).
Subject to our Board’s discretion and applicable legal restrictions, we intend to authorize and declare cash distributions on a monthly or quarterly basis and pay such distributions on a monthly or quarterly basis. We expect to pay distributions out of assets legally available for distribution. However, we cannot assure you that we will achieve investment results that will allow us to make a consistent targeted level of cash distributions or year-to-year increases in cash distributions. Our ability to pay distributions might be adversely affected by the impact of the risks described herein. In addition, the inability to satisfy the asset coverage test applicable to us as a BDC under the 1940 Act can limit our ability to pay distributions. Distributions from sources other than cash flows from
64
operations also could reduce the amount of capital we ultimately invest in debt or equity securities of portfolio companies. We cannot assure you that we will pay distributions to our shareholders in the future.
Distributions on our common stock may exceed our taxable earnings and profits. Therefore, portions of the distributions that we pay may represent a return of capital to you. A return of capital is a return of a portion of your original investment in shares of our common stock. As a result, a return of capital will (i) lower your adjusted tax basis in your shares and thereby increase the amount of capital gain (or decrease the amount of capital loss) realized upon a subsequent sale or redemption of such shares, and (ii) reduce the amount of funds we have for investment in portfolio companies. We have not established any limit on the extent to which we may use offering proceeds to fund distributions.
We may pay our distributions from offering proceeds in anticipation of future cash flow, which may constitute a return of your capital and will lower your adjusted tax basis in your shares, thereby increasing the amount of capital gain (or decreasing the amount of capital loss) realized upon a subsequent sale or redemption of such shares, even if such shares have not increased in value or have, in fact, lost value. Distributions from offering proceeds also could reduce the amount of capital we ultimately have available to invest in portfolio companies.
Our stockholders could receive shares of our common stock as dividends, which could result in adverse tax consequences to them.
Although we currently do not intend to do so, we are permitted to declare a large portion of a dividend in shares of common stock instead of cash at the election of each stockholder. Revenue procedures issued by the IRS allow a publicly offered RIC to distribute its own stock as a dividend for the purpose of fulfilling its distribution requirements, if certain conditions are satisfied. Among other things, the aggregate amount of cash available to be distributed to all stockholders is required to be at least 20% of the aggregate declared distribution. The Internal Revenue Service has also issued private letter rulings on cash/stock dividends paid by RICs and real estate investment trusts where the cash component is limited to 20% of the total distribution if certain requirements are satisfied. Stockholders receiving such dividends will be required to include the full amount of the dividend (including the portion payable in stock) as ordinary income (or, in certain circumstances, long-term capital gain) to the extent of our current and accumulated earnings and profits for U.S. federal income tax purposes. As a result, stockholders could be required to pay income taxes with respect to such dividends in excess of the cash dividends received. It is unclear to what extent we will be able to pay taxable dividends in cash and common stock (whether pursuant to IRS Revenue Procedures, a private letter ruling or otherwise).
Shareholders will experience dilution in their ownership percentage if they do not participate in our distribution reinvestment plan.
All distributions declared in cash payable to shareholders that are participants in our distribution reinvestment plan will generally be automatically reinvested in shares of our common stock unless the investor opts out of the plan. As a result, shareholders that do not elect to participate in our distribution reinvestment plan will experience dilution over time.
Preferred stock could be issued with rights and preferences that would adversely affect holders of our common stock.
Under the terms of our charter, our Board is authorized to issue shares of preferred stock in one or more series without shareholder approval, which could potentially adversely affect the interests of existing shareholders. In particular, holders of preferred stock are required to have certain voting rights when there are unpaid dividends and priority over other classes of securities as to distribution of assets or payment of dividends.
If we issue preferred stock or convertible debt securities, the net asset value of our common stock may become more volatile.
We cannot assure you that the issuance of preferred stock and/or convertible debt securities would result in a higher yield or return to the holders of our common stock. The issuance of preferred stock or convertible debt would likely cause the net asset value of our common stock to become more volatile. If the dividend rate on the preferred stock, or the interest rate on the convertible debt securities, were to approach the net rate of return on our investment portfolio, the benefit of such leverage to the holders of our common stock would be reduced. If the dividend rate on the preferred stock, or the interest rate on the debt securities, were to exceed the net rate of return on our portfolio, the use of leverage would result in a lower rate of return to the holders of common stock than if we had not issued the preferred stock or convertible debt securities. Any decline in the net asset value of our investment would be borne entirely by the holders of our common stock. Therefore, if the market value of our portfolio were to decline, the leverage would result in a greater decrease in net asset value to the holders of our common stock than if we were not leveraged through the issuance of preferred stock or debt securities. This decline in net asset value would also tend to cause a greater decline in the market price, if any, for our common stock.
There is also a risk that, in the event of a sharp decline in the value of our net assets, we would be in danger of failing to maintain required asset coverage ratios, which may be required by the preferred stock or convertible debt, or our current investment income might not be sufficient to meet the dividend requirements on the preferred stock or the interest payments on the debt securities. In order to counteract such an event, we might need to liquidate investments in order to fund the redemption of some or all of the preferred stock or convertible debt. In addition, we would pay (and the holders of our common stock would bear) all costs and expenses relating to the issuance and ongoing maintenance of the preferred stock, convertible debt, or any combination of these securities. Holders of preferred stock or convertible debt may have different interests than holders of common stock and may at times have disproportionate influence over our affairs.
65
Holders of any preferred stock that we may issue will have the right to elect certain members of the Board and have class voting rights on certain matters.
The 1940 Act requires that holders of shares of preferred stock must be entitled as a class to elect two directors at all times and to elect a majority of the directors if dividends on such preferred stock are in arrears by two years or more, until such arrearage is eliminated. In addition, certain matters under the 1940 Act require the separate vote of the holders of any issued and outstanding preferred stock, including changes in fundamental investment restrictions and conversion to open end status and, accordingly, preferred shareholders could veto any such changes. Restrictions imposed on the declarations and payment of dividends or other distributions to the holders of our common stock and preferred stock, both by the 1940 Act and by requirements imposed by rating agencies, might impair our ability to maintain our tax treatment as a RIC for U.S. federal income tax purposes.
Risks Related to an Investment in our Unsecured Notes
Our unsecured notes are effectively subordinated to any secured indebtedness we have currently incurred or may incur in the future.
We have issued notes that are unsecured by any of our assets or any of the assets of our subsidiaries. As a result, these notes are effectively subordinated, or junior, to any secured indebtedness or other obligations we or our subsidiaries have currently incurred and may incur in the future (or any indebtedness that is initially unsecured that we later secure) to the extent of the value of the assets securing such indebtedness. Substantially all of our subsidiaries’ assets are currently pledged as collateral under our credit facilities or in connection with our CLOs. In any liquidation, dissolution, bankruptcy or other similar proceeding, the holders of any of our existing or future secured indebtedness and the secured indebtedness of our subsidiaries may assert rights against the assets pledged to secure that indebtedness in order to receive full payment of their indebtedness before the assets may be used to pay other creditors, including the holders of the unsecured notes. Secured indebtedness is effectively senior to the unsecured notes to the extent of the value of the assets securing such indebtedness.
Our unsecured notes are structurally subordinated to the indebtedness and other liabilities of our subsidiaries.
The unsecured notes are exclusively our obligations and not of any of our subsidiaries. None of our subsidiaries are a guarantor of the unsecured notes and the unsecured notes are not required to be guaranteed by any subsidiaries we may acquire or create in the future. Except to the extent we are a creditor with recognized claims against our subsidiaries, all claims of creditors (including trade creditors) and holders of preferred stock, if any, of our subsidiaries will have priority over our equity interests in such subsidiaries (and therefore the claims of our creditors, including holders of the unsecured notes) with respect to the assets of such subsidiaries. Even if we are recognized as a creditor of one or more of our subsidiaries, our claims would still be effectively subordinated to any security interests in the assets of any such subsidiary and to any indebtedness or other liabilities of any such subsidiary senior to our claims. Consequently, the unsecured notes will be structurally subordinated, or junior, to our SPV Asset Facilities and CLOs and all existing and future indebtedness and other obligations (including trade payables) incurred by any of our subsidiaries, financing vehicles or similar facilities and any subsidiaries, financing vehicles or similar facilities that we may in the future acquire or establish. Our subsidiaries may incur indebtedness in the future, all of which would be structurally senior to the unsecured notes.
A downgrade, suspension or withdrawal of the credit rating assigned by a rating agency to us or our notes, if any, or change in the debt markets, could cause the liquidity or market value of our notes to decline significantly.
Our credit ratings are an assessment by rating agencies of our ability to pay our debts when due. Consequently, real or anticipated changes in our credit ratings will generally affect the market value of our notes. These credit ratings may not reflect the potential impact of risks relating to the structure or marketing of our notes. Credit ratings are not a recommendation to buy, sell or hold any security, and may be revised or withdrawn at any time by the issuing organization in its sole discretion.
An increase in market interest rates could result in a decrease in the market value of our unsecured notes.
The condition of the financial markets and prevailing interest rates have fluctuated in the past and are likely to fluctuate in the future, which could have an adverse effect on the market prices of our unsecured notes. In general, as market interest rates rise, debt securities bearing interest at fixed rates of interest decline in value. We cannot predict the future level of market interest rates.
The indenture under which the unsecured notes were issued contains limited protection for holders of our unsecured notes.
The indenture offers limited protection to holders of our unsecured notes. The terms of the indenture and the unsecured notes do not restrict our or any of our subsidiaries’ ability to engage in, or otherwise be a party to, a variety of corporate transactions, circumstances or events that could have an adverse impact on your investment in the unsecured notes. In particular, the terms of the indenture and the unsecured notes will not place any restrictions on our or our subsidiaries’ ability to:
•issue securities or otherwise incur additional indebtedness or other obligations other than an incurrence of indebtedness or other obligations that would cause a violation of Section 18(a)(1)(A) as modified by Section 61(a) of the 1940 Act or any successor provisions of the 1940 Act, but giving effect, in either case, to any exemptive relief granted to us by the SEC. Currently, these provisions generally prohibit us from incurring additional borrowings,
66
including through the issuance of additional debt securities, unless our asset coverage, as defined in the 1940 Act, equals at least 150% after such borrowings;
•pay dividends on, or purchase or redeem or make any payments in respect of, capital stock or other securities ranking junior in right of payment to the unsecured notes;
•sell assets (other than certain limited restrictions on our ability to consolidate, merge or sell all or substantially all of our assets);
•create liens (including liens on the shares of our subsidiaries) or enter into sale and leaseback transactions;
•enter into transactions with affiliates;
•make investments; or
•create restrictions on the payment of dividends or other amounts to us from our subsidiaries.
Furthermore, the terms of the indenture and the unsecured notes do not protect holders of the unsecured notes in the event that we experience changes (including significant adverse changes) in our financial condition, results of operations or credit ratings, as they do not require that we or our subsidiaries adhere to any financial tests or ratios or specified levels of net worth, revenues, income, cash flow or liquidity.
Our ability to recapitalize, incur additional debt and take a number of other actions that are not limited by the terms of the unsecured notes may have important consequences for you as a holder of the unsecured notes, including making it more difficult for us to satisfy our obligations with respect to the unsecured notes or negatively affecting the trading value of the unsecured notes.
Certain of our current debt instruments include more protections for their holders than the indenture and the unsecured notes. In addition, other debt we issue or incur in the future could contain more protections for its holders than the indenture and the unsecured notes, including additional covenants and events of default. The issuance or incurrence of any such debt with incremental protections could affect the market for and trading levels and prices of the unsecured notes.
The optional redemption provision may materially adversely affect a noteholders return on the unsecured notes.
The unsecured notes are redeemable in whole or in part at any time or from time to time at our option. We may choose to redeem the unsecured notes at times when prevailing interest rates are lower than the interest rate paid on the unsecured notes. In this circumstance, a noteholder may not be able to reinvest the redemption proceeds in a comparable security at an effective interest rate as high as that of the unsecured notes being redeemed.
We may not be able to repurchase the unsecured notes upon a Change of Control Repurchase Event.
Upon the occurrence of a Change of Control Repurchase Event, as defined in the indenture that governs the unsecured notes, as supplemented, subject to certain conditions, we will be required to offer to repurchase all outstanding unsecured notes at 100% of their principal amount, plus accrued and unpaid interest. The source of funds for that purchase of the unsecured notes will be our available cash or cash generated from our operations or other potential sources, including borrowings, investment repayments, sales of assets or sales of equity. We cannot assure you that sufficient funds from such sources will be available at the time of any Change of Control Repurchase Event to make required repurchases of the unsecured notes tendered. Our debt instruments may contain restrictions and provisions that we would have to comply with in connection with any repurchase of the unsecured notes. If the holders of the unsecured notes exercise their right to require us to repurchase all the unsecured notes upon a Change of Control Repurchase Event, the financial effect of this repurchase could cause a default under our existing or future debt instruments, even if the Change of Control Repurchase Event itself would not cause a default. It is possible that we will not have sufficient funds at the time of the Change of Control Repurchase Event to make the required repurchase of the unsecured notes or our other debt.
If an active trading market does not develop for the unsecured notes, noteholders may not be able to resell them.
We do not intend to apply for listing of the unsecured notes on any securities exchange or for quotation of the unsecured notes on any automated dealer quotation system. If no active trading market develops, noteholders may not be able to resell the unsecured notes at their fair market value or at all. If the unsecured notes are traded after their initial issuance, they may trade at a discount from their initial offering price depending on prevailing interest rates, the market for similar securities, our credit ratings, general economic conditions, our financial condition, performance and prospects and other factors. We cannot assure noteholders that a liquid trading market will develop for the unsecured notes, that noteholders will be able to sell the unsecured notes at a particular time or that the price noteholders receive when they sell will be favorable. To the extent an active trading market does not develop for the unsecured notes, the liquidity and trading price for the unsecured notes may be harmed. Accordingly, noteholders may be required to bear the financial risk of an investment in the unsecured notes for an indefinite period of time.
Risks Related to U.S. Federal Income Tax
67
We cannot predict how new tax legislation will affect us, our investments, or our stockholders, and any such legislation could adversely affect our business.
Legislative or other actions relating to taxes could have a negative effect on us. The laws pertaining to U.S. federal income taxation are constantly under review by persons involved in the legislative process and by the IRS and the U.S. Treasury Department. The likelihood of any such legislation being enacted is uncertain. New legislation and any U.S. Treasury regulations, administrative interpretations or court decisions interpreting such legislation could have adverse tax consequences, such as significantly and negatively affecting our ability to qualify for tax treatment as a RIC or negatively affecting the U.S. federal income tax consequences applicable to us and our investors as a result of such qualification. For example, on July 4, 2025, the United States enacted “An Act to Provide for reconciliation Pursuant to Title II of H. Con. Res. 14” (the “Act”), also known as the “One Big Beautiful Bill,” which includes significant amendments to the Code. The Act did not have a material impact on our consolidated financial statements. Shareholders are urged to consult with their tax advisor regarding tax legislative, regulatory, or administrative developments and proposals and their potential effect on an investment in our common stock.
We will be subject to U.S. federal income tax imposed at corporate rates if we are unable to maintain our tax treatment as a RIC under subchapter M of the Code.
To maintain RIC tax treatment under the Code, we must meet the following minimum annual distribution, income source and asset diversification requirements. See “ITEM 1. BUSINESS — Certain U.S. Federal Income Tax Considerations.”
The Annual Distribution Requirement for a RIC generally will be satisfied if we distribute to our shareholders on an annual basis at least 90% of our “investment company taxable income,” which is generally our net ordinary income plus the excess, if any, of realized net short term capital gains over realized net long term capital losses. In addition, a RIC may, in certain cases, satisfy the Annual Distribution Requirement by distributing dividends relating to a taxable year after the close of such taxable year under the “spillover dividend” provisions of Subchapter M. We would be subject to U.S. federal income tax imposed at regular corporate rates on retained income and/or gains, including any short term capital gains or long term capital gains. We also must make distributions to satisfy the Excise Tax Avoidance Requirement and avoid a 4% excise tax on certain undistributed income. Because we may use debt financing, we are subject to (i) an asset coverage ratio requirement under the 1940 Act and may, in the future, be subject to (ii) certain financial covenants under loan and credit agreements that could, under certain circumstances, restrict us from making distributions necessary to satisfy the distribution requirements. If we are unable to obtain cash from other sources, or choose or are required to retain a portion of our taxable income or gains, we could (1) be required to pay excise taxes and (2) fail to qualify for RIC tax treatment.
The income source requirement will be satisfied if we obtain at least 90% of our annual income from dividends, interest, payments with respect to loans of certain securities, gains from the sale of stock or other securities or foreign currencies, net income from certain “qualified publicly traded partnerships,” (as that term is defined in the Code)or other income derived from the business of investing in stock or securities.
In addition, we are required to satisfy certain asset diversification requirements at the end of each quarter of our taxable year. Specifically, to satisfy these requirements (1) at least 50% of the value of our assets must consist of cash, cash items (including receivables), U.S. government securities, securities of other RICs, and other securities, if such other securities of any one issuer do not represent more than 5% of the value of our assets or more than 10% of the outstanding voting securities of the issuer; and (2) no more than 25% of the value of our assets may be invested in (i) the securities, other than U.S. government securities or securities of other RICs, of one issuer, (ii) the securities, other than the securities of other RICs, of two or more issuers that are controlled by us and which are determined, under applicable Treasury regulations, to be engaged in the same or similar or related trades or businesses, or (iii) the securities of certain “qualified publicly traded partnerships (as that term is defined in the Code).” Failure to meet these requirements may result in our having to dispose of certain investments quickly in order to prevent the loss of RIC status. Because most of our investments will be in private companies, and therefore will be relatively illiquid, any such dispositions could be made at disadvantageous prices and could result in substantial losses.
If we fail to qualify for or maintain RIC tax treatment for any reason, and certain cure provisions are not applicable, we would be subject to U.S. federal income tax imposed at corporate rates on all of our taxable income (including our net capital gains). We would not be able to deduct distributions to our shareholders, nor would they be required to be made. The resulting taxes could substantially reduce our net assets, the amount of income available for distribution, and the amount of our distributions.
We may invest in certain debt and equity investments through subsidiaries that are classified as corporations for U.S. federal income tax purposes,and the net taxable income of these taxable subsidiaries will be subject to U.S. federal income and state and local taxes imposed at corporate rates. We may invest in certain foreign debt and equity investments, which could be subject to foreign taxes (such as income tax, withholding, and value added taxes).
We may have difficulty paying our required distributions if we recognize income before or without receiving cash representing such income.
For U.S. federal income tax purposes, we may be required to recognize taxable income in circumstances in which we do not receive a corresponding payment in cash. For example, since we will likely hold debt obligations that are treated under applicable tax
68
rules as having OID (such as debt instruments with PIK, secondary market purchases of debt securities at a discount to par, interest or, in certain cases, increasing interest rates or debt instruments that were issued with warrants), we must include in income each year a portion of the OID that accrues over the life of the obligation, regardless of whether cash representing such income is received by us in the same taxable year. We may also have to include in income other amounts that we have not yet received in cash, such as unrealized appreciation for foreign currency forward contracts and deferred loan origination fees that are paid after origination of the loan or are paid in non-cash compensation such as warrants or stock. Furthermore, we may invest in non-U.S. corporations (or other non-U.S. entities treated as corporations for U.S. federal income tax purposes) that could be treated under the Code and U.S. Treasury regulations as “passive foreign investment companies” and/or “controlled foreign corporations.” The rules relating to investment in these types of non-U.S. entities are designed to limit deferral and generally require the current inclusion of income derived by the entity. In certain circumstances, this could require us to recognize income where we do not receive a corresponding payment in cash.
Unrealized appreciation on derivatives, such as foreign currency forward contracts, may be included in taxable income while the receipt of cash may occur in a subsequent period when the related contract expires. Any unrealized depreciation on investments that the foreign currency forward contracts are designed to hedge are not currently deductible for tax purposes. This can result in increased taxable income whereby we may not have sufficient cash to pay distributions or we may opt to retain such taxable income and pay U.S. federal income or excise tax. In such cases we could still rely upon the “spillover provisions” to maintain RIC tax treatment.
We anticipate that a portion of our income may constitute OID or other income required to be included in taxable income prior to receipt of cash. Further, we may elect to amortize market discounts with respect to debt securities acquired in the secondary market and include such amounts in our taxable income in the current year, instead of upon disposition, as an election not to do so would limit our ability to deduct interest expenses for tax purposes. Because any OID or other amounts accrued will be included in our investment company taxable income for the year of the accrual, we may be required to make a distribution to our shareholders in order to satisfy the Annual Distribution Requirement, even if we will not have received any corresponding cash amount. As a result, we may have difficulty meeting the Annual Distribution Requirement necessary to maintain RIC tax treatment under the Code. We may have to sell some of our investments at times and/or at prices we would not consider advantageous, raise additional debt or equity capital, make a partial share distribution, or forgo new investment opportunities for this purpose. If we are not able to obtain cash from other sources, and choose not to make a qualifying share distribution, we may fail to qualify for RIC tax treatment and thus become subject to U.S. federal income tax imposed at corporate rates.
General Risk Factors
Changes in laws or regulations governing our operations may adversely affect our business or cause us to alter our business strategy.
We and our portfolio companies are subject to regulation by laws at the local, state, and federal levels. These laws and regulations, as well as their interpretation, could change from time to time, including as the result of interpretive guidance or other directives from the current U.S. Presidential administration, and new laws, regulations and interpretations could also come into effect. Any new or changed laws or regulations could have a material adverse effect on our business, and political uncertainty could increase regulatory uncertainty in the near term.
A single political party currently controls both the executive and legislative branches of government, which increases the likelihood that legislation may be adopted that could significantly affect the regulation of U.S. financial markets. Regulatory changes could result in greater competition from banks and other lenders with which we compete for lending and other investment opportunities. The United States may also potentially withdraw from or renegotiate various trade agreements and take other actions that would change current trade policies of the United States. In addition, in June 2024, the U.S. Supreme Court reversed its longstanding approach under the Chevron doctrine, which provided for judicial deference to regulatory agencies. As a result of this decision, there may be increased challenges to existing agency regulations and it is unclear how lower courts will apply the decision in the context of other regulatory schemes without more specific guidance from the U.S. Supreme Court. For example, the decision could significantly impact consumer protection, advertising, privacy, AI technologies, anti-corruption and anti-money laundering practices and other regulatory regimes with which we are required to comply. Any such regulatory developments could result in uncertainty about and changes in the ways such regulations apply to us and our portfolio companies, and may require additional resources to ensure our continued compliance. We cannot predict which, if any, of these actions will be taken or, if taken, their effect on the financial stability of the United States. Such actions could have a significant adverse effect on our business, financial condition and results of operations.
Changes to the laws and regulations governing our permitted investments may require a change to our investment strategy. Such changes could differ materially from our strategies and plans as set forth in this report and may shift our investment focus from the areas of expertise of our Adviser. Thus, any such changes, if they occur, could have a material adverse effect on our results of operations and the value of your investment in us.
69
Economic sanction laws in the U.S. and other jurisdictions may prohibit us and our affiliates from transacting with certain countries, individuals and companies.
Economic sanction laws in the U.S. and other jurisdictions may restrict or prohibit us or our affiliates from transacting with certain countries, territories, individuals and entities. In the U.S., the U.S. Department of the Treasury’s Office of Foreign Assets Control (“OFAC”) administers and enforces laws, executive orders and regulations establishing U.S. economic and trade sanctions, which restrict or prohibit, among other things, direct and indirect transactions with, and the provision of services to, certain countries, territories, industry sectors, individuals and entities. These types of sanctions may significantly restrict or completely prohibit lending activities in certain jurisdictions, and violation of any such laws or regulations, may result in significant legal and monetary penalties, as well as reputational damage. OFAC sanctions programs change frequently, which may make it more difficult for us or our affiliates to ensure compliance. Moreover, OFAC enforcement is increasing, which may increase the risk that we become the subject of such actual or threatened enforcement. Sanctions laws and regulations enforced by other countries may conflict with U.S. law such that compliance with both becomes difficult or even impossible.
Additionally, Section 2019 of the Iran Threat Reduction and Syria Human Rights Act of 2012 (the “ITRA”) amended the Exchange Act to require companies subject to SEC reporting obligations under Section 13 of the Exchange Act to disclose in their periodic reports specified dealings or transactions involving Iran or other individuals and entities targeted by OFAC during the period covered by the relevant periodic report. In some cases, the ITRA requires companies to disclose these types of transactions even if they were permissible under U.S. law. Companies that currently may be or may have been at the time considered our affiliates, may have from time to time publicly filed and/or provided to us such disclosures. We do not independently verify or participate in the preparation of these disclosures. We are required, either periodically or annually to separately file with the SEC a notice when such activities have been disclosed, and the SEC is required to post such notice of disclosure on its website and send the report to the President and certain U.S. Congressional committees. Disclosure of such activity, even if such activity is not subject to sanctions under applicable law, and any sanctions actually imposed on us or our affiliates as a result of these activities, could harm our reputation and have a negative impact on our business, financial condition and results of operations, and any failure to disclose any such activities as required could additionally result in fines or penalties.
Failure to comply with anti-corruption laws or with regulations regarding the prevention of money laundering or terrorism or national security could adversely affect our business.
We and the Adviser are committed to complying with all applicable anti-corruption and anti-bribery laws. As a result, the Adviser may forgo investment opportunities because of our unwillingness to participate in transactions that may expose us to risks under applicable anti-corruption and anti-bribery laws. Law enforcement agencies in the European Union, the United Kingdom, the United States and elsewhere devote significant resources to enforcement of anti-corruption and anti-bribery laws and regulations. Any failure to comply with anti-corruption and anti-bribery laws and regulations could have serious legal, financial and reputational consequences, including operational disruptions and significant financial penalties.
As part of our responsibility for the prevention of money laundering under applicable laws, we may require detailed verification of a prospective investor’s identity and the source of such prospective investor’s funds. We may from time to time request additional information as may be required for us to satisfy our obligations under these and other laws that may be adopted in the future. Additionally, we may from time to time be obligated to file reports with regulatory authorities in various jurisdictions with regard to, among other things, the identity of our investors and suspicious activities involving investments in us. In the event it is determined that any investor, or any direct or indirect owner of any investor, is a person identified in any of these laws as a prohibited person, or is otherwise engaged in activities of the type prohibited under these laws, we may be obligated, among other actions to be taken, to withhold distributions of any funds otherwise owing to such investor or to cause such investor’s interests to be cancelled or otherwise redeemed (without the payment of any consideration in respect of those interests).
The Bank Secrecy Act of 1970 and the USA PATRIOT Act require that financial institutions (a term that includes banks, broker-dealers and investment companies) establish and maintain compliance programs to guard against money laundering activities. These implementing regulations were amended to include registered investment advisers within scope of financial institutions that will be obliged to adopt stand-alone anti-money laundering programs, though the U.S. Department of the Treasury’s Financial Crimes Enforcement Network (“FinCEN”) has postponed the effective date of the amendment to January 1, 2028 and announced its intention to revisit the scope and applicability of the amendment to certain asset managers at a future date. Laws or regulations may presently or in the future require us, any of our affiliates or other service providers to establish additional anti-money laundering procedures, to collect information with respect to our products’ investors, to share information with governmental authorities with respect to our products’ investors or to implement additional restrictions on the transfer of the interests. These requirements can lead to increased expenses and exposure to enforcement actions.
Heightened scrutiny of the financial services industry by regulators may materially and adversely affect our business.
The financial services industry has been the subject of heightened scrutiny by regulators around the globe. In particular, the SEC and its staff have focused more narrowly on issues relevant to alternative asset management firms, including by forming specialized units devoted to examining such firms and, in certain cases, bringing enforcement actions against the firms, their principals and employees. In recent periods there have been a number of enforcement actions within the industry, and it is expected that the SEC will
70
continue to pursue enforcement actions against asset managers. The current administration and the current leadership of the SEC have indicated that they intend to not adopt certain proposals or modify or repeal certain regulations perceived as burdensome to private fund advisers, particularly those related to sustainability investing and cybersecurity. This enforcement activity and the evolving regulatory landscape have caused, and could further cause us to reevaluate certain practices and adjust our compliance control function as necessary and appropriate.
The SEC’s recent lists of examination priorities include such items as assessments of investment advisers’ adherence to fiduciary standards of conduct and effectiveness of advisers’ compliance programs, as well as specific priority areas for advisers to private funds, including disclosure of conflicts of interests and risks, and adequacy of policies and procedures; and advisory of alternative investment strategies or complex investment products. The SEC also highlighted its focus on investment advisers that are dually registered as broker-dealers and compliance with newly adopted SEC rules, including ) Regulations S-ID and S-P. Many firms have received inquiries during examinations or directly from the SEC’s Division of Enforcement regarding various transparency-related topics, including the acceleration of monitoring fees, the allocation of broken-deal expenses, outside business activities of firm principals and employees, group purchasing arrangements, and general conflicts of interest disclosures. While we believe we have made appropriate and timely disclosures regarding the foregoing, the SEC staff may disagree.
Further, the SEC has previously highlighted BDC board oversight and valuation practices as one of its areas of focus in investment adviser examinations and has instituted enforcement actions against advisers for misleading investors about valuation.
If the SEC were to investigate our Adviser and find errors in its methodologies or procedures, our Adviser could be subject to penalties and fines, which could in turn harm our reputation and our business, financial condition and results of operations could be materially and adversely affected. Similarly, from time to time we or our Adviser could become the subject of litigation or other similar claims. Any investigations, litigation or similar claims could continue without resolution for long periods of time and could consume substantial amounts of our management’s time and attention, and that time and attention and the devotion of associated resources could, at times, be disproportionate to the amounts at stake. Investigations, litigations and other claims are subject to inherent uncertainties, and a material adverse impact on our financial statements could occur for the period in which the effect of an unfavorable final outcome in an investigation, litigation or other similar claims becomes probable and reasonably estimable. In addition, we could incur expenses associated with defending ourselves against investigations, litigation and other similar claims, and these expenses could be material to our earnings in future periods.
Credit funds have been the subject of increasing regulatory focus at international and regional levels. To the extent that we are engaged in lending activity, we may be subject to restrictions on our activities and be obliged to comply with regulatory reporting and disclosure requirements. The International Organization of Securities Commissions (“IOSCO”) and the Financial Stability Board (“FSB”) have called on regulators to consider issues arising from the rapid growth in private finance, including in relation to systemic risk, transparency, leverage, liquidity, and conflicts of interest. It is likely that regulators will continue to focus on the credit funds sector and may introduce further regulatory requirements in the future.
Provisions of the Maryland General Corporation Law and of our charter and bylaws could deter takeover attempts and have an adverse effect on the price of our common stock.
The Maryland General Corporation Law (the “MGCL”), our charter and our bylaws contain provisions that may discourage, delay or make more difficult a change in control of the Company or the removal of our directors. We are subject to the Maryland Business Combination Act (the “Business Combination Act”), subject to any applicable requirements of the 1940 Act. Our board of directors has adopted a resolution exempting from the Business Combination Act any business combination between us and any other person, subject to prior approval of such business combination by our board, including approval by a majority of our disinterested directors. If the resolution exempting business combinations is repealed or our board or disinterested directors do not approve a business combination, the Business Combination Act may discourage third parties from trying to acquire control of us and may increase the difficulty of consummating such an offer. Our bylaws exempt from the Maryland Control Share Acquisition Act (the “Control Share Acquisition Act”) acquisitions of our stock by any person. If we amend our bylaws to repeal the exemption from the Control Share Acquisition Act, subject to any applicable requirements of the 1940 Act, the Control Share Acquisition Act also may make it more difficult for a third party to obtain control of us and may increase the difficulty of consummating such an offer.
Our Bylaws include an exclusive forum selection provision, which could limit our shareholders’ ability to obtain a favorable judicial forum for disputes with us or our directors, officers, or other agents.
Our Bylaws require that, unless we consent in writing to the selection of an alternative forum, the Circuit Court for Baltimore City (or, if that court does not have jurisdiction, the United States District Court for the District of Maryland, Northern Division) shall be the sole and exclusive forum for (i) any derivative action or proceeding brought on our behalf (ii) any action asserting a claim of breach of any standard of conduct or legal duty owed by any of our directors, officers, or other agents to us or to our shareholders, (iii) any action asserting a claim arising pursuant to any provision of the MGCL or the Charter or the Bylaws (as either may be amended from time to time), or (iv) any action asserting a claim governed by the internal affairs doctrine. This exclusive forum selection provision in our Bylaws will not apply to claims arising under the federal securities laws, including the Securities Act and the Exchange Act. There is uncertainty as to whether a court would enforce such a provision, and investors cannot waive compliance with the federal securities laws and the rules and regulations thereunder. In addition, this provision may increase costs for shareholders in
71
bringing a claim against us or our directors, officers or other agents. Any investor purchasing or otherwise acquiring our shares is deemed to have notice of and consented to the foregoing provision. The exclusive forum selection provision in our Bylaws may limit our shareholders’ ability to obtain a favorable judicial forum for disputes with us or our directors, officers or other agents, which may discourage lawsuits against us and such persons. It is also possible that, notwithstanding such exclusive forum selection provision, a court could rule that such provision is inapplicable or unenforceable. If this occurred, we may incur additional costs associated with resolving such action in another forum, which could materially adversely affect our business, financial condition and results of operations.
We expend significant financial and other resources to comply with the requirements of being a public entity.
As a public entity, we are subject to the reporting requirements of the Exchange Act and requirements of the Sarbanes-Oxley Act. The Exchange Act requires that we file annual, quarterly and current reports with respect to our business and financial condition. The Sarbanes-Oxley Act requires that we maintain effective disclosure controls and procedures and internal controls over financial reporting, which are discussed below. In order to maintain and improve the effectiveness of our disclosure controls and procedures and internal controls, significant resources and management oversight are required. We have implemented procedures, processes, policies and practices for the purpose of addressing the standards and requirements applicable to public companies. These activities may divert management’s attention from other business concerns, which could have a material adverse effect on our business, financial condition, results of operations and cash flows.
Item 1B. Unresolved Staff Comments
None.
Item 1C. Cybersecurity
Cybersecurity Processes and Risk Assessment
Blue Owl has implemented an information security governance policy (the “ISG Policy”) governing cybersecurity risk, which is designed to facilitate the protection of sensitive or confidential business, client, investor and any employee information that it stores or processes and the maintenance of critical services and systems. Blue Owl’s cybersecurity program is managed by Blue Owl’s Chief Technology Officer and Head of Technology Infrastructure (together, “Blue Owl IT Management”), who report to Blue Owl’s Chief Operating Officer. Blue Owl IT Management and its team are responsible for implementing proactive and reactive measures, including Blue Owl’s monitoring and alert response processes, vulnerability management, changes made to its critical systems, including software and network changes, and various other technological and administrative safeguards. Blue Owl’s cybersecurity processes and systems are designed to protect against unauthorized access of information through its systems and infrastructure, including by cyber-attacks and Blue Owl’s policy and processes include, as appropriate, encryption, data loss prevention technology, authentication technology, entitlement management, access control, anti-virus and anti-malware software, and transmission of data over private networks. Blue Owl’s processes and systems aim to prevent or mitigate two main types of cybersecurity risk: first, cybersecurity risks associated with its physical and digital devices and infrastructure, and second, cybersecurity risks associated with third parties, such as people and organizations who have access to its devices, infrastructure or confidential or sensitive information. The cybersecurity-control principles that form the basis of Blue Owl’s cybersecurity program are informed by the National Institute of Standards and Technology Cybersecurity Framework (“NIST”).
Blue Owl’s cybersecurity program is periodically reviewed by third parties, including benchmarking to best practices and industry frameworks to help Blue Owl identify areas for continued focus and improvement. Annual penetration testing of its network, including critical systems and systems that store confidential or sensitive information, is conducted with third party consultants and vulnerabilities are reviewed and addressed by Blue Owl IT Management. When Blue Owl engages vendors and other third party partners who will have access to sensitive data or client systems and facilities, its infrastructure technology team assesses their cybersecurity programs and processes.
Blue Owl also provides its employees with cybersecurity awareness training at onboarding and annually. Blue Owl conducts regular phishing tests and provides additional training as appropriate. This assessment is conducted on the basis of, among other factors, the types of services provided and the extent and type of data accessed or processed by a third-party vendor.
Governance and Oversight of Cybersecurity Risks
Blue Owl has developed an incident response framework to identify, assess, manage and report cybersecurity events, which is managed and implemented by Blue Owl’s Cyber Risk Operating Committee (the “C-ROC”), a cross-functional management committee that includes its General Counsel, Chief Operating Officer, Global Chief Compliance Officer and Blue Owl IT Management. The incident response framework determines when the C-ROC should provide notifications regarding certain
72
cybersecurity incidents, with different severity thresholds triggering notifications to different recipient groups, including senior members of Blue Owl’s management, Blue Owl’s Audit Committee or Blue Owl’s Board of Directors. The C-ROC is responsible for gathering information with respect to a cybersecurity incident, assessing its severity and potential responses, as well as communicating with business heads and senior management, as appropriate.
Blue Owl’s cybersecurity program, which is overseen by the C-ROC, is managed by IT Management as part of its responsibility for enterprise-wide cybersecurity strategy, policies, implementing Blue Owl’s monitoring and alert response processes, vulnerability management, changes made to our critical systems, including software and network changes and various other technological and administrative safeguards. The team is led by Blue Owl’s Chief Technology Officer , who has over 25 years of experience advising on technology strategy, including digital transformation, cybersecurity, business analytics and infrastructure, and Blue Owl’s Head of Technology Infrastructure, who has over 20 years of experience in the information technology field with a focus on IT risk governance and management, information security, incident response capabilities and assessing effectiveness of controls. The C-ROC meets regularly and forms cross-enterprise teams, as needed, to manage and implement key policies and initiatives of Blue Owl’s cybersecurity program.
Impact of Cybersecurity Risks
Item 2. Properties
Our corporate headquarters are located at 399 Park Avenue, 37th Floor, New York, New York 10022 and are provided by the Adviser in accordance with the terms of our Administration Agreement. We believe that our office facilities are suitable and adequate for our business as it is contemplated to be conducted.
Item 3. Legal Proceedings
Neither we nor the Adviser are currently subject to any material legal proceedings, nor, to our knowledge, are any material legal proceeding threatened against us. From time to time, we may be a party to certain legal proceedings in the ordinary course of business, including proceedings relating to the enforcement of our rights under contracts with our portfolio companies. Our business is also subject to extensive regulation, which may result in regulatory proceedings against us. While the outcome of any such future legal or regulatory proceedings cannot be predicted with certainty, we do not expect that any such future proceedings will have a material effect upon our financial condition or results of operations.
Item 4. Mine Safety Disclosures
Not applicable.
73
PART II
Item 5. Market for Registrant’s Common Equity, Related Stockholder Matters and Issuer Purchases of Equity Securities.
Common Stock
Our common stock is traded on the NYSE under the symbol “OTF.” It is not possible to predict whether our common stock will trade at a price per share at, above or below net asset value per share. Since our shares of common stock began trading on June 12, 2025, our shares of common stock have traded both above and below the net asset value attributable to those shares of common stock. See “ITEM 1A. RISK FACTORS—Risks Related to an Investment in our Common Stock—The market value of our common stock may fluctuate significantly.” On February 11, 2026, the last reported closing sales price of our common stock on the NYSE was $12.96 per share, which represented a discount of approximately 25.2% to the net asset value per share reported by us as of December 31, 2025.
Holders
As of February 11, 2026, there were approximately 11,038 holders of our common stock (including Cede & Co.).
Distribution Policy
To qualify for tax treatment as a RIC, we must distribute (or be treated as distributing) in each taxable year dividends of an amount equal to at least 90% of our investment company taxable income (which includes, among other items, dividends, interest, the excess of any net short-term capital gains over net long-term capital losses, as well as other taxable income, excluding any net capital gains reduced by deductible expenses) and 90% of our net tax-exempt income for that taxable year. As a RIC, we generally will not be subject to U.S. federal income tax at corporate rates on our investment company taxable income and net capital gains that we distribute to shareholders. We may be subject to a nondeductible 4% U.S. federal excise tax if we do not distribute (or are treated as distributing) in each calendar year an amount at least equal to the sum of:
•98% of our net ordinary income, excluding certain ordinary gains and losses, recognized during a calendar year;
•98.2% of our capital gain net income, adjusted for certain ordinary gains and losses, recognized for the twelve-month period ending on October 31 of such calendar year; and
•100% of any income or gains recognized, but not distributed, in preceding years.
We have previously incurred, and can be expected to incur in the future, such excise tax on a portion of our income and gains. While we intend to distribute income and capital gains to minimize exposure to the 4% excise tax, we may not be able to, or may not choose to, distribute amounts sufficient to avoid the imposition of the tax entirely. In that event, we will be liable for the tax only on the amount by which we do not meet the foregoing distribution requirement. See “ITEM 1A RISK FACTORS – Risks Related to U.S. Federal Income Tax – We will be subject to U.S. federal income tax imposed at corporate rates if we are unable to maintain our tax treatment as a RIC under Subchapter M of the Code.”
For the year ended December 31, 2025, we recorded expenses of $7.5 million for U.S. federal and state income tax, including excise tax.
Distributions
We generally intend to distribute, out of assets legally available for distribution, substantially all of our available earnings, on a quarterly basis, as determined by our Board in its discretion.
On February 18, 2026, the Board approved a first quarter dividend of $0.35 per share for stockholders of record as of March 31, 2026, payable on or before April 15, 2026.
The following table summarizes the distributions declared on shares of our common stock for the following period:
December 31, 2025 | ||||||||||||||||||||
| Date Declared | Record Date | Payment Date | Distribution per Share | |||||||||||||||||
| November 5, 2025 | December 31, 2025 | January 15, 2026 | $ | 0.35 | ||||||||||||||||
| August 5, 2025 | September 30, 2025 | October 15, 2025 | 0.35 | |||||||||||||||||
| June 2, 2025 (supplemental dividend) | September 21, 2026 | October 6, 2026 | 0.05 | |||||||||||||||||
| June 2, 2025 (supplemental dividend) | June 22, 2026 | July 7, 2026 | 0.05 | |||||||||||||||||
| June 2, 2025 (supplemental dividend) | March 23, 2026 | April 7, 2026 | 0.05 | |||||||||||||||||
| June 2, 2025 (supplemental dividend) | December 23, 2025 | January 7, 2026 | 0.05 | |||||||||||||||||
| June 2, 2025 (supplemental dividend) | September 22, 2025 | October 7, 2025 | 0.05 | |||||||||||||||||
| June 2, 2025 | June 30, 2025 | July 15, 2025 | 0.35 | |||||||||||||||||
| March 14, 2025 | March 17, 2025 | March 18, 2025 | 0.34 | |||||||||||||||||
| Total Distributions Declared | $ | 1.64 | ||||||||||||||||||
74
Total distributions declared of $607.7 million resulted in a taxable dividend amount of $607.7 million that consisted of $607.7 million of ordinary income for the year ending December 31, 2025. For the year ended December 31, 2025, 85.8% of distributed ordinary income qualified as interest related dividend which is exempt from U.S. withholding tax applicable to non-U.S. shareholders
Dividend Reinvestment Plan
We have adopted a dividend reinvestment plan, pursuant to which, we will reinvest all cash distributions declared by the Board on behalf of our shareholders who do not elect to receive their distribution in cash as provided below. As a result, if the Board authorizes, and we declare, a cash dividend or other distribution, then our shareholders who have not opted out of our dividend reinvestment plan will have their cash distributions automatically reinvested in additional shares of our common stock rather than receiving the cash dividend or other distribution. As described below, we may purchase shares in the open market or use newly issued shares to implement the dividend reinvestment plan. Any fractional share otherwise issuable to a participant in the dividend reinvestment plan will instead be paid in cash.
Prior to the Exchange Listing, the number of shares to be issued to a shareholder under the dividend reinvestment plan was determined by dividing the total dollar amount of the distribution payable to such shareholder by the net asset value per share of the Company’s common stock, as of the last day of the Company’s calendar quarter immediately preceding the date such distribution was declared. In connection with listing our common stock on the NYSE, we entered into our second amended and restated dividend reinvestment plan, pursuant to which, if newly issued shares are used to implement the dividend reinvestment plan, the number of shares to be issued to a shareholder will be determined by dividing the total dollar amount of the cash dividend or distribution payable to a shareholder by the market price per share of our common stock at the close of regular trading on the NYSE on the payment date of a distribution, or if no sale is reported for such day, the average of the reported bid and ask prices. However, if the market price per share on the payment date of a cash dividend or distribution exceeds the most recently computed net asset value per share, we will issue shares at the greater of (i) the most recently computed net asset value per share and (ii) 95% of the current market price per share (or such lesser discount to the current market price per share that still exceeded the most recently computed net asset value per share). Pursuant to our second amended and restated dividend reinvestment plan, if shares are purchased in the open market to implement the dividend reinvestment plan, the number of shares to be issued to a shareholder shall be determined by dividing the dollar amount of the cash dividend payable to such shareholder by the weighted average price per share for all shares purchased by the plan administrator in the open market in connection with the dividend. Shareholders who receive distributions in the form of shares of common stock will be subject to the same U.S. federal, state and local tax consequences as if they received cash distributions.
The number of shares to be issued to a shareholder under the dividend reinvestment plan will be determined by dividing the total dollar amount of the distribution payable to such shareholder by the net asset value per share of our common stock, as of the last day of the calendar quarter immediately preceding the date such distribution was declared. We intend to use newly issued shares to implement the plan.
No action is required on the part of a registered shareholder to have cash dividends or other distributions reinvested in shares of our common stock. A registered shareholder is able to elect to receive an entire cash dividend or other distribution in cash by notifying the Adviser in writing so that such notice is received by the Adviser no later than ten days prior to the record date for distributions to the shareholders.
There are no brokerage charges or other charges to shareholders who participate in the plan.
The plan is terminable by us upon notice in writing mailed to each shareholder of record at least 30 days prior to any record date for the payment of any distribution by us.
The following table reflects the common stock issued pursuant to the dividend reinvestment plan for the following period:
| December 31, 2025 | ||||||||||||||||||||
| Date Declared | Record Date | Payment Date | Shares | |||||||||||||||||
| August 5, 2025 | September 30, 2025 | October 15, 2025 | 1,885,921 | |||||||||||||||||
| June 2, 2025 (supplemental dividend) | September 22, 2025 | October 7, 2025 | 275,099 | |||||||||||||||||
| June 2, 2025 | June 30, 2025 | July 15, 2025 | 1,952,428 | |||||||||||||||||
| March 14, 2025 | March 17, 2025 | March 18, 2025 | 1,131,018 | |||||||||||||||||
| October 1, 2024 | December 31, 2024 | January 31, 2025 | 1,098,294 | |||||||||||||||||
75
For the Year Ended December 31, 2024 | ||||||||||||||||||||
| Date Declared | Record Date | Payment Date | Shares | |||||||||||||||||
| August 6, 2024 | September 30, 2024 | November 15, 2024 | 1,176,276 | |||||||||||||||||
| May 7, 2024 | June 28, 2024 | August 15, 2024 | 1,323,864 | |||||||||||||||||
| February 21, 2024 | March 29, 2024 | May 15, 2024 | 1,190,189 | |||||||||||||||||
| November 7, 2023 | December 29, 2023 | January 31, 2024 | 1,212,560 | |||||||||||||||||
2025 Stock Repurchase Program
On May 27, 2025, the Board approved the 2025 Stock Repurchase Program under which the Company may repurchase up to $200 million of its outstanding common stock. Under the 2025 Stock Repurchase Program, purchases were made at management's discretion from time to time in open-market transactions, in accordance with applicable securities laws and regulations. Unless extended by the Board, the 2025 Stock Repurchase Program will terminate 18-months from the date of the Exchange Listing. For the year ended December 31, 2025, repurchases under the 2025 Stock Repurchase Program were as follows:
| Period ($ in thousands, except share and per share amounts) | Total Number of Shares Repurchased | Average Price Paid per Share | Approximate Dollar Value of Shares that have been Purchased Under the Plans | Approximate Dollar Value of Shares that May Yet Be Purchased Under the Plan | ||||||||||||||||||||||
| September 1, 2025 - September 30, 2025 | 614,291 | $ | 14.46 | $ | 8,880 | $ | 191,120 | |||||||||||||||||||
| October 1, 2025 - October 31, 2025 | — | $ | — | $ | — | $ | 191,120 | |||||||||||||||||||
| November 1, 2025 - November 30, 2025 | 971,369 | $ | 13.49 | $ | 13,102 | $ | 178,018 | |||||||||||||||||||
| December 1, 2025 - December 31, 2025 | 3,606,748 | $ | 14.27 | $ | 51,466 | $ | 126,552 | |||||||||||||||||||
| Total | 5,192,408 | $ | 73,448 | |||||||||||||||||||||||
Price Range of Common Stock
Our common stock is traded on the NYSE under the symbol “OTF”. Our common stock has traded at prices both above and below our net asset value per share. It is not possible to predict whether our common stock will trade at a price per share at, above or below net asset value per share. See “ITEM 1A. Risk Factors—Risks Related to an Investment in Our Common Stock.”
The following table sets forth the net asset value per share of our common stock, the range of high and low closing sales prices of our common stock reported on the NYSE, the closing sales price as a premium (discount) to net asset value and the dividends declared by us in each fiscal quarter since we began trading on the NYSE. On February 11, 2026, the last reported closing sales price of our common stock on the NYSE was $12.96 per share, which represented a discount of approximately 25.2% to the net asset value per share reported by us as of December 31, 2025.
| Price Range | ||||||||||||||||||||||||||||||||||||||
| Period | Net Asset Value(1) | High | Low | High Sales Price Premium (Discount) to Net Asset Value(2) | Low Sales Price Premium (Discount) to Net Asset Value(2) | Cash Dividend Per Share(3) | ||||||||||||||||||||||||||||||||
| Year Ended December 31, 2025 | ||||||||||||||||||||||||||||||||||||||
First Quarter(4) | $ | 17.09 | n/a | n/a | n/a | n/a | $ | 0.34 | ||||||||||||||||||||||||||||||
| Second Quarter | $ | 17.17 | $ | 16.56 | $ | 15.25 | (3.5) | % | (11.2) | % | $ | 0.60 | ||||||||||||||||||||||||||
| Third Quarter | $ | 17.27 | $ | 15.75 | $ | 13.82 | (8.8) | % | (20.0) | % | $ | 0.35 | ||||||||||||||||||||||||||
| Fourth Quarter | $ | 17.33 | $ | 14.71 | $ | 13.14 | (15.1) | % | (24.2) | % | $ | 0.35 | ||||||||||||||||||||||||||
(1)Net asset value per share is determined as of the last day in the relevant quarter and therefore may not reflect the net asset value per share on the date of the high and low closing sales prices. The net asset values shown are based on outstanding shares at the end of the relevant quarter.
(2)Calculated as the respective high or low closing sales price less net asset value, divided by net asset value (in each case, as of the applicable quarter).
(3)Represents the total dividend or distribution declared in the relevant quarter, inclusive of a supplemental dividend, if any. For additional details, refer to “Note 9 — Net Assets” to our consolidated financial statements included in this Annual Report.
(4)Trading commenced on June 12, 2025
76
Stock Performance Graph
This graph compares the stockholder return on our common stock from June 12, 2025 (the date our common stock commenced trading on the NYSE) to December 31, 2025 with that of the Standard & Poor’s 500 Stock Index, Standard & Poor’s BDC Index and Morningstar LSTA US Leveraged Loan Index. This graph assumes that on June 12, 2025, $100 was invested in our common stock, the Standard & Poor’s BDC Index, the Standard & Poor’s 500 Stock Index and the Morningstar LSTA US Leveraged Loan Index. The graph also assumes the reinvestment of all cash dividends prior to any tax effect. The graph and other information furnished under this Part II Item 5 of this Annual Report on Form 10-K shall not be deemed to be “soliciting material” or to be “filed” with the SEC or subject to Regulation 14A or 14C under, or to the liabilities of Section 18 of, the Exchange Act. The stock price performance included in the below graph is not necessarily indicative of future stock performance.
COMPARISON OF CUMULATIVE TOTAL RETURN AMONG BLUE OWL TECHNOLOGY FINANCE
CORPORATION, STANDARD & POOR’S 500 INDEX, STANDARD & POOR’S BDC INDEX AND
MORNINGSTAR LSTA US LEVERAGED LOAN INDEX
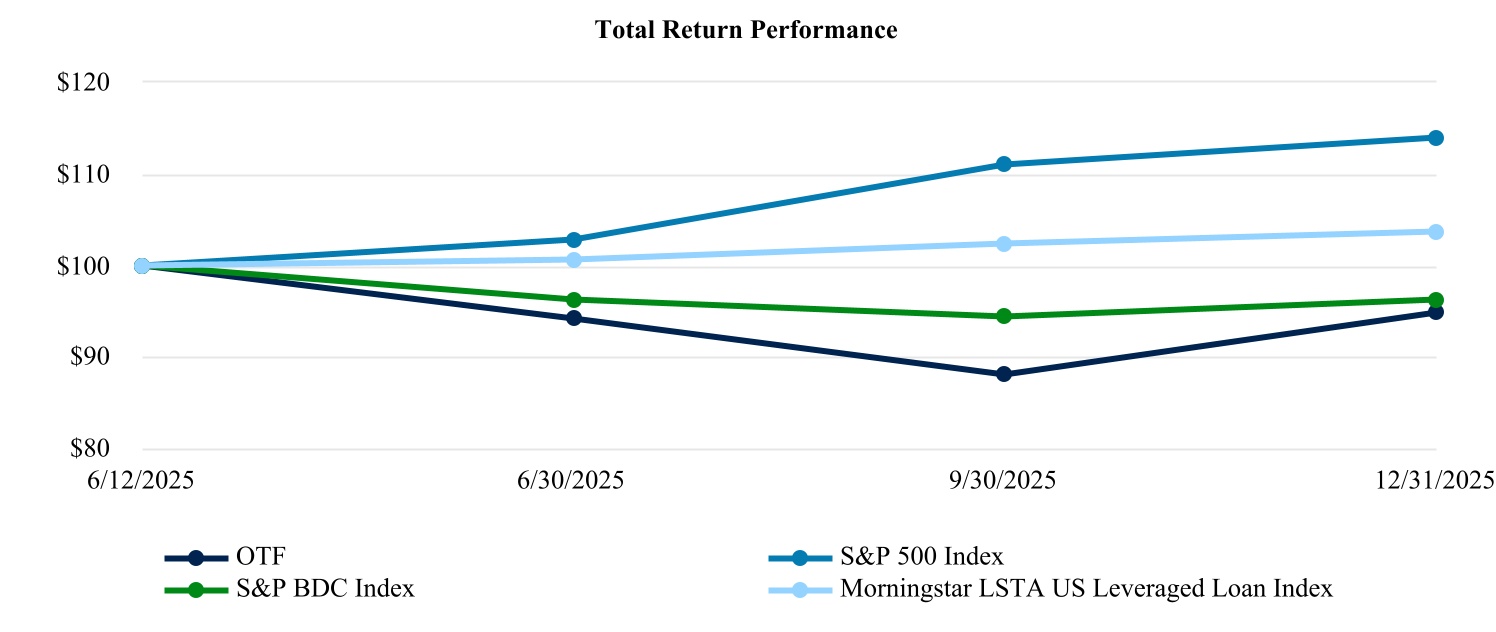
SOURCE: Bloomberg
NOTES: Assumes $100 invested on June 12, 2025 in Blue Owl Technology Finance Corporation, the Standard & Poor’s 500 Index, the Standard & Poor’s BDC Index and the Morningstar LSTA US Leveraged Loan Index. Assumes all dividends are reinvested on the respective dividend payment dates without commissions.
Senior Securities
The table below presents information about our senior securities as of the following periods:
| Class and Period | Total Amount Outstanding Exclusive of Treasury Securities(1) ($ in millions) | Asset Coverage per Unit(2) | Involuntary Liquidating Preference per Unit(3) | Average Market Value per Unit(4) | ||||||||||||||||||||||
| Revolving Credit Facility | ||||||||||||||||||||||||||
| December 31, 2025 | $ | 1,480.0 | $ | 2,259.2 | — | N/A | ||||||||||||||||||||
| December 31, 2024 | $ | 313.0 | $ | 2,200.6 | — | N/A | ||||||||||||||||||||
| December 31, 2023 | $ | 343.4 | $ | 2,165.0 | — | N/A | ||||||||||||||||||||
| December 31, 2022 | $ | 705.9 | $ | 2,057.3 | — | N/A | ||||||||||||||||||||
| December 31, 2021 | $ | 650.8 | $ | 2,309.9 | — | N/A | ||||||||||||||||||||
| December 31, 2020 | $ | 68.3 | $ | 1,905.6 | — | N/A | ||||||||||||||||||||
| December 31, 2019 | $ | 185.0 | $ | 1,934.6 | — | N/A | ||||||||||||||||||||
Subscription Credit Facility(5) | ||||||||||||||||||||||||||
| December 31, 2021 | $ | — | $ | 2,309.9 | — | N/A | ||||||||||||||||||||
| December 31, 2020 | $ | 105.8 | $ | 1,905.6 | — | N/A | ||||||||||||||||||||
77
| December 31, 2019 | $ | 645.7 | $ | 1,934.6 | — | N/A | ||||||||||||||||||||
| December 31, 2018 | $ | 300.0 | $ | 1,954.6 | — | N/A | ||||||||||||||||||||
| SPV Asset Facility I | ||||||||||||||||||||||||||
| December 31, 2025 | $ | 700.0 | $ | 2,259.2 | — | N/A | ||||||||||||||||||||
| December 31, 2024 | $ | 600.0 | $ | 2,200.6 | — | N/A | ||||||||||||||||||||
| December 31, 2023 | $ | 600.0 | $ | 2,165.0 | — | N/A | ||||||||||||||||||||
| December 31, 2022 | $ | 450.0 | $ | 2,057.3 | — | N/A | ||||||||||||||||||||
| December 31, 2021 | $ | 290.0 | $ | 2,309.9 | — | N/A | ||||||||||||||||||||
| December 31, 2020 | $ | 290.0 | $ | 1,905.6 | — | N/A | ||||||||||||||||||||
| SPV Asset Facility II | ||||||||||||||||||||||||||
| December 31, 2025 | $ | 325.0 | $ | 2,259.2 | — | N/A | ||||||||||||||||||||
| December 31, 2024 | $ | 300.0 | $ | 2,200.6 | — | N/A | ||||||||||||||||||||
| December 31, 2023 | $ | 300.0 | $ | 2,165.0 | — | N/A | ||||||||||||||||||||
| December 31, 2022 | $ | 300.0 | $ | 2,057.3 | — | N/A | ||||||||||||||||||||
| December 31, 2021 | $ | — | $ | 2,309.9 | — | N/A | ||||||||||||||||||||
| SPV Asset Facility III | ||||||||||||||||||||||||||
| December 31, 2025 | $ | 624.5 | $ | 2,259.2 | — | N/A | ||||||||||||||||||||
| SPV Asset Facility IV | ||||||||||||||||||||||||||
| December 31, 2025 | $ | 200.0 | $ | 2,259.2 | — | N/A | ||||||||||||||||||||
CLO 2020-1(7) | ||||||||||||||||||||||||||
| December 31, 2025 | $ | — | $ | 2,259.2 | — | N/A | ||||||||||||||||||||
| December 31, 2024 | $ | 204.0 | $ | 2,200.6 | — | N/A | ||||||||||||||||||||
| December 31, 2023 | $ | 204.0 | $ | 2,165.0 | — | N/A | ||||||||||||||||||||
| December 31, 2022 | $ | 200.0 | $ | 2,057.3 | — | N/A | ||||||||||||||||||||
| December 31, 2021 | $ | 200.0 | $ | 2,309.9 | — | N/A | ||||||||||||||||||||
| December 31, 2020 | $ | 200.0 | $ | 1,905.6 | — | N/A | ||||||||||||||||||||
| Athena CLO II | ||||||||||||||||||||||||||
| December 31, 2025 | $ | 375.0 | $ | 2,259.2 | — | N/A | ||||||||||||||||||||
| Athena CLO IV | ||||||||||||||||||||||||||
| December 31, 2025 | $ | 240.0 | $ | 2,259.2 | — | N/A | ||||||||||||||||||||
| Athena CLO V | ||||||||||||||||||||||||||
| December 31, 2025 | $ | 300.0 | $ | 2,259.2 | — | N/A | ||||||||||||||||||||
June 2025 Notes(6) | ||||||||||||||||||||||||||
| December 31, 2025 | $ | — | $ | 2,259.2 | — | N/A | ||||||||||||||||||||
| December 31, 2024 | $ | 210.0 | $ | 2,200.6 | — | N/A | ||||||||||||||||||||
| December 31, 2023 | $ | 210.0 | $ | 2,165.0 | — | N/A | ||||||||||||||||||||
| December 31, 2022 | $ | 210.0 | $ | 2,057.3 | — | N/A | ||||||||||||||||||||
| December 31, 2021 | $ | 210.0 | $ | 2,309.9 | — | N/A | ||||||||||||||||||||
| December 31, 2020 | $ | 210.0 | $ | 1,905.6 | — | N/A | ||||||||||||||||||||
December 2025 Notes(8) | ||||||||||||||||||||||||||
| December 31, 2025 | $ | — | $ | 2,259.2 | — | N/A | ||||||||||||||||||||
| December 31, 2024 | $ | 650.0 | $ | 2,200.6 | — | N/A | ||||||||||||||||||||
| December 31, 2023 | $ | 650.0 | $ | 2,165.0 | — | N/A | ||||||||||||||||||||
| December 31, 2022 | $ | 650.0 | $ | 2,057.3 | — | N/A | ||||||||||||||||||||
| December 31, 2021 | $ | 650.0 | $ | 2,309.9 | — | N/A | ||||||||||||||||||||
| December 31, 2020 | $ | 400.0 | $ | 1,905.6 | — | N/A | ||||||||||||||||||||
| June 2026 Notes | ||||||||||||||||||||||||||
| December 31, 2025 | $ | 375.0 | $ | 2,259.2 | — | N/A | ||||||||||||||||||||
| December 31, 2024 | $ | 375.0 | $ | 2,200.6 | — | N/A | ||||||||||||||||||||
| December 31, 2023 | $ | 375.0 | $ | 2,165.0 | — | N/A | ||||||||||||||||||||
78
| December 31, 2022 | $ | 375.0 | $ | 2,057.3 | — | N/A | ||||||||||||||||||||
| December 31, 2021 | $ | 375.0 | $ | 2,309.9 | — | N/A | ||||||||||||||||||||
| December 31, 2020 | $ | 375.0 | $ | 1,905.6 | — | N/A | ||||||||||||||||||||
| January 2027 Notes | ||||||||||||||||||||||||||
| December 31, 2025 | $ | 300.0 | $ | 2,259.2 | — | N/A | ||||||||||||||||||||
| December 31, 2024 | $ | 300.0 | $ | 2,200.6 | — | N/A | ||||||||||||||||||||
| December 31, 2023 | $ | 300.0 | $ | 2,165.0 | — | N/A | ||||||||||||||||||||
| December 31, 2022 | $ | 300.0 | $ | 2,057.3 | — | N/A | ||||||||||||||||||||
| December 31, 2021 | $ | 300.0 | $ | 2,309.9 | — | N/A | ||||||||||||||||||||
| March 2028 Notes | ||||||||||||||||||||||||||
| December 31, 2025 | $ | 650.0 | $ | 2,259.2 | — | N/A | ||||||||||||||||||||
| September 2028 Notes | ||||||||||||||||||||||||||
| December 31, 2025 | $ | 75.0 | $ | 2,259.2 | — | N/A | ||||||||||||||||||||
| April 2029 Notes | ||||||||||||||||||||||||||
| December 31, 2025 | $ | 700.0 | $ | 2,259.2 | — | N/A | ||||||||||||||||||||
(1)Total amount of each class of senior securities outstanding at the end of the period presented.
(2)Asset coverage per unit is the ratio of the carrying value of our total assets, less all liabilities excluding indebtedness represented by senior securities in this table, to the aggregate amount of senior securities representing indebtedness. Asset coverage per unit is expressed in terms of dollar amounts per $1,000 of indebtedness and is calculated on a consolidated basis.
(3)The amount to which such class of senior security would be entitled upon our involuntary liquidation in preference to any security junior to it. The “—” in this column indicates information that the SEC expressly does not require to be disclosed for certain types of senior securities.
(4)Not applicable because the senior securities are not registered for public trading.
(5)Facility was terminated in 2021.
(6)On May 30, 2025, we redeemed in full all $210,000,000 in aggregate principal amount of the June 2025 Notes at 100% of their principal amount, plus the accrued interest thereon through, but excluding, May 30, 2025.
(7)On October 15, 2025, we redeemed in full all $204,000,000 in aggregate principal amount of CLO 2020-1 at 100% of its principal amount, plus the accrued interest thereon through, but excluding, October 15, 2025.
(8)On November 14, 2025, we redeemed in full all $650,000,000 in aggregate principal amount of the December 2025 Notes at 100% of their principal amount, plus the accrued interest thereon through, but excluding, November 14, 2025.
Fees and Expenses
The following table is intended to assist you in understanding the costs and expenses that you will bear directly or indirectly. We caution you that some of the percentages indicated in the table below are estimates and may vary. The expenses shown in the table under “Annual expenses” are based on estimated amounts for our current fiscal year. The following table should not be considered a representation of our future expenses. Actual expenses may be greater or less than shown. Except where the context suggests otherwise, whenever this Form 10-K contains a reference to fees or expenses paid by “us” or “the Company” or that “we” will pay fees or expenses, you will indirectly bear these fees or expenses as an investor in the Company:
Shareholder transaction expenses: | ||||||||
Sales load | — | % | (1) | |||||
Offering expenses (as a percentage of offering price) | — | % | (2) | |||||
Dividend reinvestment plan expenses | — | % | (3) | |||||
Total shareholder transaction expenses (as a percentage of offering price) | — | % | ||||||
Annual expenses (as a percentage of net assets attributable to common stock): | ||||||||
Management Fee payable under the Investment Advisory Agreement | 3.0 | % | (4) | |||||
Incentive Fee payable under the Investment Advisory Agreement | 1.4 | % | (5) | |||||
Interest payments on borrowed funds | 6.4 | % | (6) | |||||
Other expenses | 0.3 | % | (7) | |||||
Acquired Fund Fees and Expenses | — | % | (8) | |||||
Total annual expenses | 11.1 | % | (9)(10\) | |||||
__________________
(1) In the event that the securities are sold to or through underwriters, a related prospectus supplement will disclose the applicable sales load (underwriting discount or commission).
79
(2) A related prospectus supplement will disclose the estimated amount of offering expenses, the offering price and the estimated amount of offering expenses borne by the Company as a percentage of the offering price.
(3) The expenses of the dividend reinvestment plan are included in “other expenses” in the table above. For additional information, see “Dividend Reinvestment Plan.”
(4) The Management Fee is 1.50% of our average gross assets (excluding cash and cash equivalents but including assets purchased with borrowed amounts) at the end of the two most recently completed calendar quarters; provided, however, the Management Fee is 1.00% of our average gross assets (excluding cash and cash equivalents but including assets purchased with borrowed amounts) that is below an asset coverage of 200% calculated in accordance with Section 18 and 61 of the 1940 Act. The Management Fee reflected in the table is calculated by determining the ratio that the Management Fee bears to our net assets attributable to common stock (rather than our gross assets).
(5) The Incentive Fee consists of two components that are independent of each other, with the result that one component may be payable even if the other is not. A portion of the Incentive Fee is based on our income and a portion is based on our capital gains, For more detailed information about the Incentive Fee, see Part I, Item 1 “BUSINESS —Investment Advisory Agreement”.
(6) The figure in the table represents our interest expenses based on our actual interest and credit facility expenses incurred for the period ended December 31, 2025, which includes the impact of interest rate swaps. During the year ended December 31, 2025, our average borrowings outstanding were $4.8 billion and our interest expense incurred was $321.5 million. We had outstanding borrowings of approximately $6.3 billion as of December 31, 2025. Interest payments on borrowed funds represents an estimate of our annualized interest expense based on borrowings under the Revolving Credit Facility, our SPV Asset Facility I, our SPV Asset Facility II, our SPV Asset Facility III, our SPV Asset Facility IV, the December 2025 Notes, the June 2026 Notes, the January 2027 Notes, the March 2028 Notes, the September 2028 Notes, the April 2029 Notes, the CLO 2020-1 Transaction, the Athena CLO II Transaction, the Athena CLO IV Transaction, and the Athena CLO V Transaction. The assumed weighted average interest rate on our total debt outstanding was 6.0%. We may borrow additional funds from time to time to make investments to the extent we determine that the economic situation is conducive to doing so. We may also issue additional debt securities or preferred stock, subject to our compliance with applicable requirements under the 1940 Act.
(7) Includes our overhead expenses, such as payments under the Administration Agreement for certain expenses incurred by the Adviser. We based these expenses on estimated amounts for the current fiscal year.
(8) Our shareholders indirectly bear the expenses of underlying funds or other investment vehicles in which we invest that (1) are investment companies or (2) would be investment companies under section 3(a) of the 1940 Act but for the exceptions to that definition provided for in sections 3(c)(1) and 3(c)(7) of the 1940 Act (“Acquired Funds”). This amount includes the estimated annual fees and expenses of Credit SLF and Blue Owl Leasing as of December 31, 2025.
(9) Estimated. Totals may not sum due to rounding.
(10) This table reflects all of the fees and expenses borne by us with respect to the CLO 2020-1 Transaction, the Athena CLO II Transaction, the Athena CLO IV Transaction, and the Athena CLO V transaction but does not include fees payable to but waived by the Adviser for serving as collateral manager to the CLO Issuers.
Example
The following example demonstrates the projected dollar amount of total cumulative expenses over various periods with respect to a hypothetical investment in our common stock. In calculating the following expense amounts, we have assumed we would have no additional leverage and that our annual operating expenses would remain at the levels set forth in the table above. Transaction expenses are included in the following example.
1 Year | 3 Years | 5 Years | 10 Years | |||||||||||||||||||||||
| You would pay the following expenses on a $1,000 investment, assuming a 5% annual return from realized capital gains | $ | 97 | $ | 293 | $ | 490 | $ | 986 | ||||||||||||||||||
The foregoing table is to assist you in understanding the various costs and expenses that an investor in our common stock will bear directly or indirectly. While the example assumes, as required by the SEC, a 5% annual return, our performance will vary and may result in a return greater or less than 5%. Because the income portion of the Incentive Fee under the Investment Advisory Agreement is unlikely to be significant assuming a 5% annual return, the example assumes that the 5% annual return will be generated entirely through the realization of capital gains on our assets and, as a result, will trigger the payment of the capital gains portion of the Incentive Fee under the Investment Advisory Agreement. The income portion of the Incentive Fee under the Investment Advisory Agreement, which, assuming a 5% annual return, would either not be payable or have an immaterial impact on the expense amounts shown above, is not included in the example. If we achieve sufficient returns on our investments, including through the realization of capital gains, to trigger an Incentive Fee of a material amount, our expenses, and returns to our investors, would be higher. In addition, while the example assumes reinvestment of all dividends and distributions at net asset value, if our Board authorizes and we declare a cash dividend, participants in our dividend reinvestment plan who have not otherwise elected to receive cash will receive a number of shares of our common stock, determined by dividing the total dollar amount of the dividend payable to a participant by the market price per share of our common stock at the close of trading on the valuation date for the dividend. See “Dividend Reinvestment Plan” for additional information regarding our dividend reinvestment plan.
This example and the expenses in the table above should not be considered a representation of our future expenses, and actual expenses (including the cost of debt, if any, and other expenses) may be greater or less than those shown.
Item 6. Reserved
80
Item 7. Management’s Discussion and Analysis of Financial Condition and Results of Operations
The information contained in this section should be read in conjunction with “ITEM 8. CONSOLIDATED FINANCIAL STATEMENTS AND SUPPLEMENTARY DATA”. This discussion contains forward-looking statements, which relate to future events or the future performance or financial condition of Blue Owl Technology Finance Corp. and involves numerous risks and uncertainties, including, but not limited to, those described in “ITEM 1A. RISK FACTORS”. This discussion also should be read in conjunction with the “Cautionary Statement Regarding Forward Looking Statements” set forth on page 1 of this Annual Report. Actual results could differ materially from those implied or expressed in any forward-looking statements.
Overview
Blue Owl Technology Finance Corp. (the “Company”, “we”, “us” or “our”) is a Maryland corporation formed on July 12, 2018. We were formed primarily to originate and make debt and equity investments in technology-related, specifically software, companies based primarily in the United States. We originate and invest in senior secured or unsecured loans, subordinated loans or mezzanine loans, and equity-related securities including common equity, warrants, preferred stock and similar forms of senior equity, which may or may not be convertible into a portfolio company’s common equity. Our investment objective is to maximize total return by generating current income from our debt investments and other income producing securities, and capital appreciation from our equity and equity-linked investments. We may hold our investments directly or through special purpose vehicles.
We are externally managed by Blue Owl Technology Credit Advisors LLC (“the Adviser” or “our Adviser”). The Adviser is registered with the U.S. Securities and Exchange Commission (the “SEC”) as an investment adviser under the Investment Advisers Act of 1940, as amended (the “Advisers Act”), an indirect affiliate of Blue Owl Capital Inc. (“Blue Owl”) (NYSE: OWL) and part of Blue Owl’s Credit platform. Subject to the overall supervision of our board of directors (the “Board”), the Adviser manages our day-to-day operations, and provides investment advisory and management services to us. The Adviser or its affiliates may engage in certain origination activities and receive attendant arrangement, structuring or similar fees. The Adviser is responsible for managing our business and activities, including sourcing investment opportunities, conducting research, performing diligence on potential investments, structuring our investments, and monitoring our portfolio companies on an ongoing basis through a team of investment professionals.
On June 12, 2025, our common stock was listed and began trading on the New York Stock Exchange (“NYSE”) under the symbol “OTF” (the “Exchange Listing”).
Blue Owl consists of three investment platforms: (1) Credit, which includes several strategies, including direct lending, alternative credit, investment grade credit, liquid credit and other adjacent investment strategies, (2) GP Strategic Capital, which primarily focuses on acquiring equity stakes in, or providing debt financing to, large, multi-product private equity and private credit firms and (3) Real Assets, which primarily focuses on the strategies of net lease real estate, real estate credit and digital infrastructure, which focuses on acquiring, financing, developing and operating data centers and related digital infrastructure assets. The direct lending strategy of Blue Owl’s Credit platform is comprised of the Adviser, Blue Owl Credit Advisors LLC (“OCA”), Blue Owl Technology Credit Advisors II LLC (“OTCA II”), Blue Owl Credit Private Fund Advisors LLC (“OPFA”), and Blue Owl Diversified Credit Advisors LLC (“ODCA” and together with the Adviser, OCA, OTCA II, and OPFA, the “Blue Owl Credit Advisers”), which also are investment advisers. As of December 31, 2025, the Adviser and its affiliates had $157.8 billion of assets under management across Blue Owl’s Credit platform.
The management of our investment portfolio is the responsibility of the Adviser and the Technology Lending Investment Committee. We consider these individuals to be our portfolio managers. The Investment Team is also led by Douglas I. Ostrover, Marc S. Lipschultz and Craig W. Packer and is supported by certain members of the Adviser’s senior executive team and Blue Owl’s Credit platform’s direct lending investment committees. Blue Owl’s four direct lending investment committees each focus on a specific investment strategy (Diversified Lending, Technology Lending, First Lien Lending and Opportunistic Lending). Douglas I. Ostrover, Marc S. Lipschultz, Craig W. Packer and Alexis Maged sit on each of Blue Owl’s Credit platform’s investment committees. In addition to Messrs. Ostrover, Lipschultz, Packer and Maged, the Technology Lending Investment Committee is comprised of Erik Bissonnette, Pravin Vazirani, Jon ten Oever and Arthur Martini. We consider the individuals on the Technology Lending Investment Committee to be our portfolio managers. The Investment Team, under the Technology Lending Investment Committee’s supervision, sources investment opportunities, conducts research, performs due diligence on potential investments, structures our investments and will monitor our portfolio companies on an ongoing basis.
The Technology Lending Investment Committee meets regularly to consider our investments, direct our strategic initiatives and supervise the actions taken by the Adviser on our behalf. In addition, the Technology Lending Investment Committee reviews and determines whether to make prospective investments (including approving parameters or guidelines pursuant to which certain investments may be made or sold consistent with our investment objective), structures financings and monitors the performance of the investment portfolio. Each investment opportunity requires the approval of a majority of the Technology Lending Investment Committee. Follow-on investments in existing portfolio companies may require the Technology Lending Investment Committee’s approval beyond that obtained when the initial investment in the portfolio company was made. In addition, temporary investments, such as those in cash equivalents, U.S. government securities and other high quality debt investments that mature in one year or less,
81
may require approval by the Technology Lending Investment Committee. The compensation packages of Technology Lending Investment Committee members from the Adviser include various combinations of discretionary bonuses and variable incentive compensation based primarily on performance for services provided and may include shares of Blue Owl.
We may be prohibited under the Investment Company Act of 1940, as amended (the “1940 Act”) from participating in certain transactions with our affiliates without the prior approval of our directors who are not interested persons and, in some cases, the prior approval of the SEC. We rely on an order for exemptive relief (the “Order”) to co-invest with other funds managed by the Adviser or certain affiliates in a manner consistent with our investment objective, positions, policies, strategies and restrictions as well as regulatory requirements and other pertinent factors. Pursuant to the Order, we generally are permitted to co-invest with certain of our affiliates if such co-investments are done on the same terms and at the same time, as further detailed in the Order. The Order requires that a “required majority” (as defined in Section 57(o) of the 1940 Act) of the Board make certain findings (1) in most instances when we co-invest with our affiliates in an issuer where our affiliate has an existing investment in the issuer, and (2) if we dispose of an asset acquired in a transaction under the Order unless the disposition is done on a pro rata basis. Pursuant to the Order, the Board will oversee our participation in the co-investment program. As required by the Order, we have adopted, and the Board has approved, policies and procedures reasonably designed to ensure compliance with the terms of the Order, and the Adviser and our Chief Compliance Officer will provide reporting to the Board.
The Blue Owl Credit Advisers’ investment allocation policy seeks to ensure equitable allocation of investment opportunities over time between us and other funds managed by our Adviser or its affiliates. As a result of the Order, there could be significant overlap in our investment portfolio and the investment portfolio of the business development companies (“BDCs”), interval fund, private funds and separately managed accounts managed by the Blue Owl Credit Advisers (collectively, the “Blue Owl Credit Clients”) and/or other funds managed by the Adviser or its affiliates that avail themselves of the Order. In addition, the Adviser and its affiliates are permitted to allocate an investment to a number of products across platforms that it views as appropriate for the particular investment objectives, strategies and characteristics of such products.
On September 24, 2018, we formed a wholly-owned subsidiary, OR Tech Lending LLC, a Delaware limited liability company, which holds a California finance lenders license. OR Tech Lending LLC originates loans to borrowers headquartered in California. From time to time we may form wholly-owned subsidiaries to facilitate the normal course of business.
We have elected to be regulated as a BDC under the 1940 Act and have elected to be treated as a regulated investment company (“RIC”) for U.S. federal income tax purposes. As a result, we are required to comply with various statutory and regulatory requirements, such as:
•the requirement to invest at least 70% of our assets in “qualifying assets”, as such term is defined in the 1940 Act;
•source of income limitations;
•asset diversification requirements; and
•the requirement to distribute (or be treated as distributing) in each taxable year the sum of at least (i) 90% of our investment company taxable income and(ii) 90% of our tax-exempt interest for that taxable year.
In addition, we will not invest more than 20% of our total assets in companies whose principal place of business is outside the United States, although we do not generally intend to invest in companies whose principal place of business is in an emerging market and we have adopted a policy to invest, under normal circumstances at least 80% of the value of our total assets in “technology-related” businesses (as defined below).
On March 24, 2025, we consummated the transactions contemplated by the Agreement and Plan of Merger (the “Merger Agreement”), dated November 12, 2024, with Blue Owl Technology Finance Corp. II, a Maryland corporation (“OTF II”), Oriole Merger Sub, Inc., a Maryland corporation and our wholly-owned subsidiary (“Merger Sub”), and, solely for the limited purposes set forth therein, the Adviser, and OTCA II, investment adviser to OTF II. In connection therewith, Merger Sub merged with and into OTF II, with OTF II continuing as the surviving company and our wholly-owned subsidiary (the “Initial Merger”) and, immediately thereafter, OTF II merged with and into us, and we continued as the surviving company (together with the Initial Merger, the “Mergers”).
Our Investment Framework
We are a Maryland corporation formed primarily to originate and make loans to and make debt and equity investments in, technology-related companies based primarily in the United States, with an emphasis on enterprise software investments. We originate and invest in senior secured or unsecured loans, subordinated loans or mezzanine loans, and equity-related securities including common equity, warrants, preferred stock and similar forms of senior equity, which may or may not be convertible into a portfolio company’s common equity. Our investment objective is to maximize total return by generating current income from debt investments and other income producing securities, and capital appreciation from our equity and equity-linked investments. We may hold our investments directly or through special purpose vehicles. Since our Adviser’s affiliates began investment activities in April 2016 through December 31, 2025, the Blue Owl Credit Advisers have originated $187.04 billion aggregate principal amount of investments
82
across multiple industries, of which $182.92 billion of aggregate principal amount of investments prior to any subsequent exits or repayments was retained by either us or a corporation or fund advised by our Adviser or its affiliates.
We invest at least 80% of the value of our total assets in “technology-related” companies. We define technology-related companies as those that (i) operate directly in the technology industry, which includes, but is not limited to, application software, systems software, healthcare technology, information technology, technology services and infrastructure, financial technology and internet and digital media, (ii) operate indirectly through their reliance on technology (i.e., utilizing scientific knowledge or technology-enabled techniques, skills, methods, devices or processes to deliver goods and/or services) or (iii) seek to grow through technological advancements and innovations. We invest in a broad range of established and high growth technology-related companies with a focus on large, established enterprise software companies across a variety of end-markets that are capitalizing on the large and growing demand for software products and services. Within enterprise software we currently focus on investing in application software, which represents the operating layer for core business functions; systems and infrastructure software, which is the defense layer that protects enterprise data and networks and of which cybersecurity is a large component; and fintech and payments software, which provide critical means for the global movement of capital.
The companies in which we invest use our capital primarily to support their growth, acquisitions, market or product expansion, refinancings and/or recapitalizations. The debt in which we invest is generally not rated by any rating agency, but if these instruments were rated, they would likely receive a rating of below investment grade (that is, below BBB- or Baa3), which is often referred to as “high yield” or “junk”.
We leverage Blue Owl’s relationships and existing origination capabilities to focus our investments in companies with an enterprise value of at least $250 million and that are typically backed by institutional investors that are active investors in and have an expertise in technology companies and technology-related industries. We expect that our target investments typically will have maturities between three and ten years and generally range in size between $20 million and $500 million. Our expected portfolio composition will be majority debt or income producing securities, in particular directly originated debt investments, with a lesser allocation to equity related opportunities. On these investments, we typically invest at a low loan-to-value ratio, which we consider to be 50% or below. We anticipate that generally any equity related securities we hold will be minority positions. We expect that our investment size will vary with the size of our capital base and that our average investment size will be 0.5-1.5% of our entire portfolio with no investment size greater than 5%; however, from time to time certain of our investments may comprise greater than 5%. As of December 31, 2025, our average investment size in each of our portfolio companies was approximately $71.8 million based on fair value. In addition, we generally do not intend to invest more than 20% of our total assets in companies whose principal place of business is outside the United States, although we do not generally intend to invest in companies whose principal place of business is in an emerging market. Our portfolio composition may fluctuate from time to time based on market conditions and interest rates.
We expect that our portfolio composition will be comprised predominantly of directly originated debt and income producing securities, with a lesser allocation to equity or equity-linked opportunities. Our debt investments may be structured as annualized recurring revenue (“ARR”) loans, which are loans made to a company that may not currently be EBITDA positive because they have strategically determined to postpone profitability in favor of acquiring customers that will generate a high lifetime value over time. Generally, our ARR loans are made to high growth technology companies with a stable base of existing customers, providing strong revenue visibility. We believe the recurring revenue market to be underserved and find that ARR loans often have attractive risk adjusted return profiles, in the form of pricing, credit documentation, and /or loan-to-values, relative to the broader market. Our ARR loans, as a percentage of our portfolio, have decreased from its peak, and as we seek to originate additional loans we expect to increase our exposure to ARR loans.
We may also invest a portion of our portfolio in opportunistic investments and publicly traded debt investments and we may evaluate and enter into strategic portfolio transactions that may result in additional portfolio companies that we are considered to control. These types of investments are intended to supplement our core strategy and further enhance returns to our shareholders. These investments may include high-yield bonds and broadly syndicated loans, including “covenant lite” loans (as defined below), and other publicly traded debt instruments, typically originated and structured by banks on behalf of large corporate borrowers with employee counts, revenues, EBITDAs and enterprise values larger than those of middle-market companies, where OTF focuses, and equity investments in portfolio companies that make senior secured loans or invest in broadly syndicated loans, structured products, asset-based solutions or other forms of specialty finance, which may include, but is not limited to, investments such as life settlements, royalty interests and equipment finance.
Covenants are contractual restrictions that lenders place on companies to limit the corporate actions a company may pursue. The loans in which we expect to invest may have financial maintenance covenants, which are used to proactively address materially adverse changes in a portfolio company’s financial performance, or may take the form of “covenant-lite” loans, which generally refers to loans that do not have a complete set of financial maintenance covenants. Generally, “covenant-lite” loans provide borrowers more freedom to negatively impact lenders because their covenants are incurrence-based, which means they are only tested and can only be breached following an affirmative action of the borrower, rather than by a deterioration in the borrower’s financial condition. Accordingly, to the extent we invest in “covenant-lite” loans, we may have fewer rights against a borrower and may have a greater risk of loss on such investments as compared to investments in or exposure to loans with financial maintenance covenants.
83
Key Components of Our Results of Operations
Investments
We focus primarily on originating and making debt and equity investments in technology-related (specifically software) companies based primarily in the United States.
Our level of investment activity (both the number of investments and the size of each investment) can and will vary substantially from period to period depending on many factors, including the amount of debt and equity capital available to middle-market companies, the level of merger and acquisition activity for such companies, the general economic environment and the competitive environment for the types of investments we make.
In addition, as part of our risk strategy on investments, we may reduce the levels of certain investments through partial sales or syndication to additional lenders.
Revenues
We generate revenues primarily in the form of interest income from the investments we hold. In addition, we may generate income from dividends on either direct equity investments or equity interests obtained in connection with originating loans, such as options, warrants or conversion rights. Our debt investments typically have a term of three to ten years. As of December 31, 2025, 96.2% of our debt investments based on fair value bear interest at a floating rate, subject to interest rate floors, in certain cases. Interest on our debt investments is generally payable either monthly or quarterly.
Our investment portfolio consists primarily of floating rate loans. Macro trends in base interest rates like SOFR, and any other alternative reference rates may affect our net investment income over the long term. However, because we generally intend to originate loans to a small number of portfolio companies each quarter, and those investments may vary in size, our results in any given period, including the interest rate on investments that may be sold or repaid in a period compared to the interest rate of new investments made during that period, may be idiosyncratic, and reflect the characteristics of the particular portfolio companies that we invested in or exited during the period and not necessarily any trends in our business or macro trends. Generally, because our portfolio consists primarily of floating rate loans, we expect our earnings to benefit from a prolonged higher rate environment.
Loan origination fees, original issue discount and market discount or premium are capitalized, and we accrete or amortize such amounts under U.S. generally accepted accounting principles (“U.S. GAAP”) as interest income using the effective yield method for term instruments and the straight-line method for revolving or delayed draw instruments. Repayments of our debt investments can reduce interest income from period to period. The frequency or volume of these repayments may fluctuate significantly. We record prepayment premiums on loans as interest income. We may also generate revenue in the form of commitment, loan origination, structuring, or due diligence fees, fees for providing managerial assistance to our portfolio companies and possibly consulting fees.
Dividend income on equity investments is recorded on the record date for private portfolio companies or on the ex-dividend date for publicly traded companies.
Our portfolio activity will also reflect the proceeds from sales of investments. We will recognize realized gains or losses on investments based on the difference between the net proceeds from the disposition and the amortized cost basis of the investment without regard to unrealized gains or losses previously recognized. We record current period changes in fair value of investments that are measured at fair value as a component of the net change in unrealized gains (losses) on investments in the Consolidated Statements of Operations.
Expenses
Our primary operating expenses include the payment of the management fee, the incentive fee, expenses reimbursable under the Administration Agreement and Investment Advisory Agreement, legal and professional fees, interest and other debt expenses, and other operating expenses. The management fee and incentive fee compensate our Adviser for work in identifying, evaluating, negotiating, closing, monitoring and realizing our investments.
Except as specifically provided below, we anticipate that all investment professionals and staff of the Adviser, when and to the extent engaged in providing investment advisory and management services to us, and the base compensation, bonus and benefits, and the routine overhead expenses, of such personnel allocable to such services, will be provided and paid for by the Adviser. In addition, the Adviser shall be solely responsible for any placement or “finder’s” fees payable to placement agents engaged by us or our affiliates in connection with the offering of securities by us. We will bear our allocable portion of the costs of the compensation, benefits and related administrative expenses (including travel expenses) of our officers who provide operational and administrative services hereunder, their respective staffs and other professionals who provide services to us (including, in each case, employees of the Adviser or an affiliate) who assist with the preparation, coordination, and administration of the foregoing or provide other “back office” or “middle office” financial or operational services to us. We shall reimburse the Adviser (or its affiliates) for an allocable portion of the compensation paid by the Adviser (or its affiliates) to such individuals (based on a percentage of time such individuals devote, on an estimated basis, to our business affairs and in acting on our behalf). We also will bear all other costs and expenses of our operations, administration and transactions, including, but not limited to (i) investment advisory fees, including Management Fees and Incentive
84
Fees, to the Adviser, pursuant to the Investment Advisory Agreement; (ii) our allocable portion of overhead and other expenses incurred by the Adviser in performing its administrative obligations under the Investment Advisory Agreement and (iii) all other costs and expenses of our operations and transactions including, without limitation, those relating to:
•the cost of our organization and any offerings;
•the cost of calculating our net asset value, including the cost of any third-party valuation services;
•the cost of effecting any sales and repurchases of the common stock and other securities;
•fees and expenses payable under any dealer manager agreements, if any;
•debt service and other costs of borrowings or other financing arrangements;
•costs of hedging;
•expenses, including travel expense, incurred by the Adviser, or members of the investment team, or payable to third parties, performing due diligence on prospective portfolio companies and, if necessary, enforcing our rights;
•escrow agent, transfer agent and custodial fees and expenses;
•fees and expenses associated with marketing efforts;
•federal and state registration fees, any stock exchange listing fees and fees payable to rating agencies;
•U.S. federal, state and local taxes;
•independent directors’ fees and expenses, including certain travel expenses;
•costs of preparing financial statements and maintaining books and records and filing reports or other documents with the SEC (or other regulatory bodies) and other reporting and compliance costs, including registration fees, listing fees and licenses, and the compensation of professionals responsible for the preparation of the foregoing;
•costs of any reports, proxy statements or other notices to our shareholders (including printing and mailing costs);
•costs of any shareholder or director meetings and the compensation of personnel responsible for the preparation of the foregoing and related matters;
•commissions and other compensation payable to brokers or dealers;
•research and market data;
•fidelity bond, directors and officers errors and omissions liability insurance and other insurance premiums;
•direct costs and expenses of administration, including printing, mailing, long distance telephone and staff;
•fees and expenses associated with independent audits, outside legal and consulting costs;
•costs of winding up;
•costs incurred in connection with the formation or maintenance of entities or vehicles to hold our assets for tax or other purposes;
•extraordinary expenses (such as litigation or indemnification); and
•costs associated with reporting and compliance obligations under the 1940 Act and applicable federal and state securities laws.
We expect, but cannot ensure, that our general and administrative expenses will increase in dollar terms during periods of asset growth, but will decline as a percentage of total assets during such periods.
Leverage
The amount of leverage we use in any period depends on a variety of factors, including cash available for investing, the cost of financing and general economic and market conditions. On August 7, 2018, we received shareholder approval that allowed us to reduce our asset coverage ratio from 200% to 150%, effective as of August 8, 2018. As a result, we are permitted, under specified conditions, to issue multiple classes of indebtedness and one class of stock senior to the common stock if our asset coverage, as defined in the 1940 Act, would at least be equal to 150% immediately after each such issuance. This reduced asset coverage ratio permits us to double the amount of leverage we can incur. For example, under a 150% asset coverage ratio we may borrow $2 for investment purposes of every $1 of investor equity whereas under a 200% asset coverage ratio we may only borrow $1 for investment purposes for every $1 of investor equity. Our current target leverage ratio is 0.90x-1.25x.
In any period, our interest expense will depend largely on the extent of our borrowing and we expect interest expense will increase as we increase our leverage over time subject to the limits of the 1940 Act. In addition, we may dedicate assets to financing facilities.
Market Trends
We believe the technology investment lending environment provides opportunities for us to meet our goal of making investments that generate an attractive total return based on a combination of the following factors.
85
Limited Availability of Capital for Technology, Specifically Enterprise Software, Companies. We believe that technology companies have limited access to capital, driven by a lack of dedicated pools of capital focused on technology companies. Traditional lenders, such as commercial and investment banks, generally do not have flexible product offerings that meet the needs of technology-related companies and there has been a reduction in activity from commercial and investment banks as a result of regulatory and structural factors, industry consolidation and general risk aversion. In recent years, many commercial and investment banks have focused their efforts and resources on lending to large corporate clients and managing capital markets transactions rather than lending to technology-related companies. In addition, these lenders may be constrained in their ability to underwrite and hold loans and high yield securities, as well as their ability to provide equity financing, as they seek to meet existing and future regulatory capital requirements. We also believe that there is a lack of scaled market participants that are willing to provide and hold meaningful amounts of a customized financing solution for technology companies. As a result, we believe our focus on technology-related companies and our ability to invest across the capital structure, coupled with a limited supply of capital providers, presents an attractive opportunity to invest in technology companies.
Capital Markets Have Been Unable to Fill the Void Left by Banks. Access to the underwritten bond and syndicated loan markets is challenging for many technology companies due to loan size and liquidity. For example, high yield bonds are generally purchased by institutional investors such as mutual funds and exchange traded funds (“ETFs”) who, among other things, are highly focused on the liquidity characteristics of the bond being issued in order to fund investor redemptions and/or comply with regulatory requirements. Accordingly, the existence of an active secondary market for bonds is an important consideration in these entities’ initial investment decision. Syndicated loans arranged through a bank are done either on a “best efforts” basis or are underwritten with terms plus provisions that permit the underwriters to change certain terms, including pricing, structure, yield and tenor, otherwise known as “flex”, to successfully syndicate the loan, in the event the terms initially marketed are insufficiently attractive to investors. Loans provided by companies such as ours provide certainty to issuers in that we can commit to a given amount of debt on specific terms, at stated coupons and with agreed upon fees. As we are the ultimate holder of the loans, we do not require market “flex” or other arrangements that banks may require when acting on an agency basis. In addition, our Adviser has teams focused on both liquid credit and private credit and these teams are able to collaborate with respect to syndicated loans.
Secular Trends Supporting Growth for Private Credit. According to Gartner, a research and advisory company, global technology spend was $5.6 trillion in 2025 and is expected to grow to more than $6.2 trillion in 2026. We believe global demand for technology products and services will continue to grow rapidly, and that growth will stimulate demand for capital from technology companies which will continue to require access to capital to refinance existing debt, support growth and finance acquisitions. We believe that periods of market volatility, such as the current period of market volatility caused, in part, by uncertainty regarding inflation and interest rates, and current geopolitical conditions, have accentuated the advantages of private credit. The availability of capital in the liquid credit market is highly sensitive to market conditions whereas we believe private lending has proven to be a stable and reliable source of capital through periods of volatility. We believe the opportunity set for private credit will continue to expand even as the public markets remain open. Financial sponsors and companies today are familiar with direct lending and have seen firsthand the strong value proposition that a private solution can offer. Scale, certainty of execution and flexibility all provide borrowers with a compelling alternative to the syndicated and high yield markets. Based on our experience, larger, higher quality credits that have traditionally been issuers in the syndicated and high yield markets are increasingly seeking private solutions independent of credit market conditions. In our view, this is supported by financial sponsors wanting to work with collaborative financing partners that have scale and breadth of capabilities. This has driven substantial growth in direct lending portfolio companies over time. Given the dynamics mentioned above, we believe this trend is poised to continue and the large amount of uninvested capital held by funds of private equity firms, estimated by Preqin Ltd., an alternative assets industry data and research company, to be $2.7 trillion as of December 31, 2025, will continue to serve as a tailwind to the space.
Attractive Investment Dynamics. With respect to the debt investments in technology companies, we believe the directly negotiated nature of such financings generally provides more favorable terms to the lender, including stronger covenant and reporting packages, better call protection, and lender protective change of control provisions. Further, we believe that historical default rates for technology and software companies have been lower, and recovery rates have been higher, as compared to the broader leveraged finance market, leading to lower cumulative losses. With respect to equity and equity-linked investments, we will seek to structure these investments with meaningful shareholder protections, including, but not limited to, anti-dilution, anti-layering, and liquidation preferences, which we believe will create the potential for meaningful risk-adjusted long-term capital gains in connection with the future liquidity events of these technology companies. Lastly, we believe that in the current environment, lenders with available capital may be able to take advantage of attractive investment opportunities.
Compelling Business Models. We believe that the products and services that technology companies, and more specifically enterprise software businesses, provide often have high switching costs and are fundamental to the operations and success of their customers across diverse industries. We generally invest in scaled or growing players in niche markets that are selling mission critical products to established customer bases. As a result, technology companies with a focus on enterprise software have attributes that make them compelling investments, including strong customer retention rates, high switching costs and highly contracted cash flows which leads to recurring and predictable revenue. Further, technology companies with a focus on enterprise software are typically highly capital efficient, with limited capital expenditures and high free cash flow conversion. In addition, the replicable nature of
86
technology products, specifically enterprise software, creates substantial operating leverage which typically results in strong profitability, lower loan to value ratios, high revenue retention, high gross margins and stable sale efficiency.
We believe that enterprise software businesses make compelling investments because they are inherently diversified into a variety of sectors due to end market applications and have been one of the more defensive sectors throughout economic cycles. Within enterprise software we currently focus on investing in application software, which represents the operating layer for core business functions; systems and infrastructure software, which is the defense layer that protects enterprise data and networks and of which cybersecurity is a large component; and fintech and payments software, which provide critical means for the global movement of capital. We believe that these categories of enterprise software play specific, functional roles that will be difficult to bypass even as technology shifts because the need for auditability, control and data integrity will remain constant and these categories of software will provide a stable layer through which new technology is governed and executed.
Attractive Opportunities in Investments in Technology Companies. We invest in the debt and equity of technology companies. We believe that opportunities in the debt of technology companies are significant because of the floating rate structure of most senior secured debt issuances and because of the strong defensive characteristics of these types of investments. We believe that debt issued with floating interest rates offer a superior return profile as compared with fixed-rate investments, since floating rate structures are generally less susceptible to declines in value experienced by fixed-rate securities in a rising interest rate environment.
Senior secured debt provides strong defensive characteristics because it has priority in payment among an issuer’s security holders whereby holders are due to receive payment before junior creditors and equity holders. Further, these investments are generally secured by the issuer’s assets, which may provide protection in the event of a default. We also make recurring revenue loans to companies that have made a strategic decision to postpone profitability in favor of acquiring customers that will generate a high lifetime value over time. We believe that recurring revenue loans provide attractive credit characteristics including covenant protections, lower loan-to-values and/or premium pricing.
We believe that opportunities in the equity of technology companies are significant because of the potential to generate meaningful capital appreciation by participating in the growth in the portfolio company and the demand for its products and services. We find many of these opportunities are in the form of preferred equities, where there is the opportunity to invest in large, established companies through structures that protect invested capital and also offer upside opportunities. Moreover, we believe that the high-growth profile of a technology company will generally make it a more attractive candidate for a liquidity event than a company in a non-high growth industry. We believe the technology investment lending environment provides opportunities for us to meet our goal of making investments that generate an attractive total return based on a combination of the foregoing factors.
Portfolio and Investment Activity
Our business is impacted by conditions in the financial markets and economic conditions in the United States, and to a lesser extent, globally.
During the fourth quarter of 2025, global equity and debt markets saw appreciation despite some elevated volatility in the third quarter, with U.S. equity indices reaching new all-time high while credit spreads remained relatively tight. The 10-year Treasury yield ended the quarter approximately flat quarter over quarter and down approximately 40 basis points from the beginning of the year, and the Federal Reserve cut the federal funds rate by an additional 50 basis points during the fourth quarter following a 25 basis point cut in September 2025.
During the fourth quarter of 2025 we saw a meaningful increase in origination activity and deployed $2.4 billion in new investment commitments, including $1.8 billion of new investment fundings, while repayments remained steady at $928 million. We continue to focus on investing in upper middle-market enterprise software businesses that we view to be recession resistant given their mission-critical nature and highly contracted cash flows and during the quarter ended December 31, 2025, 55% of our originations were from new borrowers.
As of January 31, 2026, we have an investment backlog of over approximately $1 billion in transactions we expect to fund in this calendar quarter. While deals in our investment backlog are expected to close, such transactions are subject to the approval of the Technology Lending Investment Committee, the acceptance of final terms and structure and the execution and delivery of satisfactory transaction documentation. In addition, certain of these investments may result in the repayment of existing investments. We cannot assure you that we will make any of these investments.
Blue Owl serves as the lead, co-lead or administrative agent on many of our investments and the majority of our investments are supported by sophisticated financial sponsors who provide operational and financial resources. As of December 31, 2025, 81.7% of our portfolio at fair value is primarily comprised of first or second lien loans. These positions have a weighted average annual revenue of $945.2 million, weighted average annual EBITDA of $289.6 million, and a weighted average enterprise value of $6.2 billion. 16.2% of our portfolio at fair value is primarily comprised of unsecured debt and equity investments. These positions have a weighted average annual revenue of $1.1 billion and enterprise value of $12.1 billion. These statistics exclude certain strategic portfolio transactions and investments that fall outside of our typical borrower profile, which comprise 2.2% of the book at fair value. In addition, Blue Owl’s direct lending strategy continues to invest in, and is often the lead lender or administrative agent on, transactions in excess of $1 billion in size, which gives us the ability to structure the terms of such deals to maximize deal economics
87
and credit protection and provide customized flexible solutions. The average hold size of Blue Owl’s direct lending strategy’s new investments is approximately $350 million (up from approximately $200 million in 2021) and average total new deal size is approximately $1.5 billion (up from approximately $600 million in 2021).
We believe the construction of our current portfolio coupled with our experienced investment team and strong underwriting standards leave us well-positioned for the current economic environment. Many of the companies in which we invest are continuing to see modest growth in both revenues and EBITDA and our ARR loans continue to experience strong credit performance. However, in the event of further geopolitical, economic and financial market instability, in the U.S. and elsewhere, it is possible that the results of some of the middle-market companies similar to those in which we invest could be challenged.
We also believe that our portfolio companies are well positioned to evolve as a result of developments in artificial intelligence (“AI”). We remain focused on scaled companies that offer mission-critical solutions to established customer bases, with strong customer retention rates and high switching costs. We seek to invest in companies that offer a depth of broad, integrated solutions and product offerings across a geographic diversity and we emphasize agile, adaptable technology that enables fast integration of AI and other emerging technologies to maintain a competitive edge. Within enterprise software we currently focus on investing in application software, which represents the operating layer for core business functions; systems and infrastructure software, which is the defense layer that protects enterprise data and networks and of which cybersecurity is a large component; and fintech and payments software, which provide critical means for the global movement of capital. We believe that these categories of enterprise software play specific, functional roles that will be difficult to bypass even as technology shifts because the need for auditability, control and data integrity will remain constant and these categories of software will provide a stable layer through which new technology is governed and executed. As of December 31, 2025, approximately 45% of our portfolio was comprised of application software, approximately 25% of our portfolio was comprised of systems and infrastructure software and approximately 10% of our portfolio was comprised of fintech and payments software.
While we are not seeing a meaningful increase in amendment activity, requests for increased revolver borrowings, missed payments, downward movement in our watch list or other signs of an overall, broad deterioration in our results or those of our portfolio companies at this time, there can be no assurance that the performance of certain of our portfolio companies will not be negatively impacted by economic conditions, which could have a negative impact on our future results. Virtually all of our payment-in-kind (“PIK”) was structured as PIK from inception and not implemented as a result of credit underperformance.
We also continue to leverage the expanding role that private lenders are being asked to play in the broader credit markets to evaluate cross-platform opportunities including strategic equity and accretive joint venture investments that have cash flow and credit profiles that provide consistent income. We continue to invest in Blue Owl Credit SLF LLC (“Credit SLF”) and specialty financing portfolio companies, including Fifth Season Investments LLC (“Fifth Season”), LSI Financing 1 DAC (“LSI Financing DAC”), LSI Financing LLC (“LSI Financing LLC”), AAM Series 1.1 Rail and Domestic Intermodal Feeder, LLC and AAM Series 2.1 Aviation Feeder, LLC (collectively, “Amergin AssetCo”), and Blue Owl Cross-Strategy Opportunities LLC (“BOCSO”). We formed Blue Owl Leasing LLC (“Blue Owl Leasing”), a cross-platform joint venture that invests in equipment leases and in the future we may invest through other cross-platform investment vehicles. In the future we may invest through additional specialty finance portfolio companies, joint ventures, partnerships or other special purpose vehicles. See “Specialty Financing Portfolio Companies” and “Joint Ventures.” These companies may use our capital to support acquisitions which could lead to increased dividend income across well-diversified underlying portfolios. We also intend to identify ways to participate in growth of various industries as a result of AI. In the future, we may evaluate cross-platform opportunities to invest in data center assets and AI related equipment such as graphic processing units.
As of December 31, 2025, based on fair value, our portfolio consisted of 76.8% first lien senior secured debt investments (of which 61% we consider to be unitranche debt investments (including “last out” portions of such loans)), 4.0% second lien senior secured debt investments, 3.3% unsecured debt investments, 0.3% specialty finance debt investments, 7.5% preferred equity investments, 5.1% common equity investments, 2.6% specialty finance equity investments, and 0.4% joint ventures.
As of December 31, 2025, our weighted average total yield of the portfolio at fair value and amortized cost was 8.8% and 8.8%, respectively, and our weighted average yield of debt and income producing securities at fair value and amortized cost was 9.6% and 9.5%, respectively. Refer to our weighted average yields and interest rates table for more information on our calculation of weighted average yields. As of December 31, 2025, the weighted average spread of total debt investments was 5.4%.
As of December 31, 2025, we had investments in 199 portfolio companies with an aggregate fair value of $14.3 billion. Our current target leverage ratio is 0.90x to 1.25x. As of December 31, 2025, we had net leverage of 0.75x debt-to-equity
88
Our investment activity for the following periods is presented below (information presented herein is at par value unless otherwise indicated).
For the Years Ended December 31, | |||||||||||
| ($ in thousands) | 2025 | 2024 | |||||||||
| New investment commitments | |||||||||||
| Gross originations | $ | 5,627,964 | $ | 2,669,031 | |||||||
| Less: Sell downs | (36,981) | (15,864) | |||||||||
| Total new investment commitments | $ | 5,590,983 | $ | 2,653,167 | |||||||
| Principal amount of new investments funded: | |||||||||||
| First-lien senior secured debt investments | $ | 3,694,471 | $ | 1,858,962 | |||||||
| Second-lien senior secured debt investments | 135,503 | 13,500 | |||||||||
| Unsecured debt investments | 142,980 | 51,607 | |||||||||
| Specialty finance debt investments | 11,050 | 1,226 | |||||||||
| Preferred equity investments | 92,757 | 23,477 | |||||||||
| Common equity investments | 44,202 | 99,473 | |||||||||
| Specialty finance equity investments | 173,586 | 99,588 | |||||||||
Joint ventures | 16,521 | 948 | |||||||||
| Total principal amount of new investments funded | $ | 4,311,070 | $ | 2,148,781 | |||||||
| Drawdowns (Repayments) on revolvers and delayed draw term loans, net | $ | 515,303 | |||||||||
| Principal amount of investments sold or repaid: | |||||||||||
First-lien senior secured debt investments(1) | $ | (2,632,820) | $ | (1,229,745) | |||||||
| Second-lien senior secured debt investments | (122,007) | (172,334) | |||||||||
| Unsecured debt investments | (175,232) | (185,319) | |||||||||
| Specialty finance debt investments | — | (1,059) | |||||||||
| Preferred equity investments | (70,935) | (99,895) | |||||||||
| Common equity investments | (60,848) | (105,930) | |||||||||
| Specialty finance equity investments | (64,432) | (28,518) | |||||||||
| Total principal amount of investments sold or repaid | $ | (3,126,274) | $ | (1,822,801) | |||||||
Number of new investment commitments in new portfolio companies(2) | 58 | 54 | |||||||||
| Average new investment commitment amount | $ | 25,999 | $ | 53,977 | |||||||
| Weighted average term for new debt investment commitments (in years) | 6.2 | 6.0 | |||||||||
| Percentage of new debt investment commitments at floating rates | 94.8 | % | 98.3 | % | |||||||
| Percentage of new debt investment commitments at fixed rates | 5.2 | % | 1.7 | % | |||||||
Weighted average interest rate of new debt investment commitments(3) | 8.0 | % | 9.7 | % | |||||||
| Weighted average spread over applicable base rate of new debt investment commitments at floating rates | 5.0 | % | 5.3 | % | |||||||
(1)Includes scheduled paydowns.
(2)Number of new investment commitments represents commitments to a particular portfolio company.
(3)Assumes each floating rate commitment is subject to the greater of the interest rate floor (if applicable) or 3-month SOFR, which was 3.65% and 4.31% as of December 31, 2025 and 2024, respectively.
89
The table below presents our investments as of the following periods:
| December 31, 2025 | December 31, 2024 | ||||||||||||||||||||||
| ($ in thousands) | Amortized Cost | Fair Value | Amortized Cost | Fair Value | |||||||||||||||||||
First-lien senior secured debt investments(1) | $ | 10,983,810 | $ | 10,979,070 | $ | 4,457,465 | $ | 4,451,797 | |||||||||||||||
| Second-lien senior secured debt investments | 601,494 | 568,641 | 292,835 | 258,538 | |||||||||||||||||||
| Specialty finance debt investments | 37,449 | 37,452 | 5,024 | 5,041 | |||||||||||||||||||
| Unsecured debt investments | 467,464 | 477,128 | 337,386 | 336,635 | |||||||||||||||||||
Preferred equity investments | 1,127,105 | 1,072,481 | 764,816 | 686,859 | |||||||||||||||||||
Common equity investments | 504,733 | 722,100 | 450,093 | 536,136 | |||||||||||||||||||
| Specialty finance equity investments | 351,675 | 375,812 | 124,553 | 131,513 | |||||||||||||||||||
Joint ventures | 53,483 | 53,355 | 949 | 947 | |||||||||||||||||||
| Total Investments | $ | 14,127,213 | $ | 14,286,039 | $ | 6,433,121 | $ | 6,407,466 | |||||||||||||||
(1)We consider 61% and 69% of first-lien senior secured debt investments to be unitranche loans as of December 31, 2025 and December 31, 2024, respectively.
90
We use GICS for classifying the industry groupings of our portfolio companies. The table below presents the industry composition of investments based on fair value as of the following periods:
| December 31, 2025 | December 31, 2024 | ||||||||||
| Aerospace & Defense | 2.7 | % | 2.6 | % | |||||||
| Airlines | 0.3 | — | |||||||||
| Application Software | 13.6 | 13.6 | |||||||||
Asset based lending and fund finance(6) | 0.4 | — | |||||||||
| Banks | 0.3 | 1.2 | |||||||||
Beverages(1) | — | — | |||||||||
| Building Products | 0.5 | 0.9 | |||||||||
| Buildings & Real Estate | 1.3 | 1.1 | |||||||||
| Capital Markets | 0.8 | — | |||||||||
| Commercial Services & Supplies | 0.2 | 0.3 | |||||||||
Construction & Engineering(1) | 0.2 | — | |||||||||
| Consumer Finance | 0.5 | 0.5 | |||||||||
| Diversified Consumer Services | 3.3 | 3.9 | |||||||||
Diversified Financial Services(2) | 9.8 | 6.7 | |||||||||
| Diversified Support Services | 0.2 | — | |||||||||
| Entertainment | 1.4 | 1.9 | |||||||||
| Equity Real Estate Investment Trusts (REITs) | 0.8 | 0.1 | |||||||||
| Food & Staples Retailing | 1.3 | 0.4 | |||||||||
| Health Care Equipment & Supplies | 2.0 | — | |||||||||
| Health Care Providers & Services | 3.4 | 1.0 | |||||||||
| Health Care Technology | 13.9 | 16.0 | |||||||||
| Hotels, Restaurants & Leisure | 0.8 | 1.9 | |||||||||
| Household Durables | 0.6 | 1.3 | |||||||||
| Industrial Conglomerates | 0.7 | 1.4 | |||||||||
Insurance(3) | 4.4 | 2.0 | |||||||||
| Internet & Direct Marketing Retail | 2.2 | 4.4 | |||||||||
| IT Services | 4.2 | 5.5 | |||||||||
Joint Ventures(1)(4) | 0.4 | — | |||||||||
| Life Sciences Tools & Services | 2.1 | 1.4 | |||||||||
| Media | 0.9 | 0.9 | |||||||||
| Multiline Retail | 0.2 | 0.2 | |||||||||
Pharmaceuticals(5) | 1.0 | 1.0 | |||||||||
| Professional Services | 6.1 | 5.8 | |||||||||
| Real Estate Management & Development | 0.2 | 0.6 | |||||||||
| Road & Rail | 0.1 | 0.2 | |||||||||
| Specialty Retail | 0.8 | — | |||||||||
| Systems Software | 17.9 | 23.2 | |||||||||
Thrifts & Mortgage Finance(1) | — | — | |||||||||
| Wireless Telecommunication Services | 0.5 | — | |||||||||
| Total | 100.0 | % | 100.0 | % | |||||||
(1)As of December 31, 2025 or December 31, 2024, our investment rounds to less than 0.1% of the fair value of the portfolio.
(2)Includes debt and equity investment in Amergin AssetCo.
(3)Includes equity investment in Fifth Season.
(4)Includes equity investment in Credit SLF, Blue Owl Leasing, and Stripe Blue Owl.
(5)Includes equity investment in LSI Financing DAC and LSI Financing LLC.
(6)Includes equity investment in BOCSO.
We classify the industries of our portfolio companies by end-market (such as health care technology) and not by the product or services (such as software) directed to those end-markets.
91
The table below describes investments by geographic composition based on fair value as of the following periods:
| December 31, 2025 | December 31, 2024 | ||||||||||
| United States: | |||||||||||
| Midwest | 16.3 | % | 20.9 | % | |||||||
| Northeast | 21.8 | 15.9 | |||||||||
| South | 24.2 | 19.8 | |||||||||
| West | 27.8 | 28.7 | |||||||||
| Australia | 0.6 | — | |||||||||
| Brazil | 0.3 | 0.6 | |||||||||
| Canada | 2.3 | 3.0 | |||||||||
| Estonia | 0.1 | 0.2 | |||||||||
| Guernsey | — | 1.2 | |||||||||
Ireland(1) | — | 1.0 | |||||||||
| Israel | — | 2.3 | |||||||||
Netherlands(1) | — | — | |||||||||
| Norway | 0.5 | 0.4 | |||||||||
| Spain | — | 0.3 | |||||||||
| Sweden | 0.5 | 0.5 | |||||||||
| Switzerland | 0.1 | — | |||||||||
| United Kingdom | 5.5 | 5.2 | |||||||||
| Total | 100.0 | % | 100.0 | % | |||||||
(1)As of December 31, 2025 or December 31, 2024, our investment rounds to less than 0.1% of the fair value of the portfolio.
The table below presents the weighted average yields and interest rates of our investments at fair value as of the following periods:
| December 31, 2025 | December 31, 2024 | ||||||||||
Weighted average total yield of portfolio(1) | 8.8 | % | 9.4 | % | |||||||
| Weighted average total yield of debt and income producing securities | 9.6 | % | 10.9 | % | |||||||
| Weighted average interest rate of debt securities | 9.0 | % | 10.3 | % | |||||||
| Weighted average spread over base rate of all floating rate investments | 5.4 | % | 6.1 | % | |||||||
(1)For non-stated rate income producing investments, computed based on (a) the dividend or interest income earned for the respective trailing twelve months ended on the measurement date, divided by (b) the ending fair value. In instances where historical dividend or interest income data is not available or not representative for the trailing twelve months ended, the dividend or interest income is annualized.
The weighted average yield of our debt and income producing securities is not the same as a return on investment for our shareholders but, rather, relates to a portion of our investment portfolio and is calculated before the payment of all of our and our subsidiaries’ fees and expenses. The weighted average yield was computed using the effective interest rates as of each respective date, including accretion of original issue discount and loan origination fees, but excluding investments on non-accrual status, if any. There can be no assurance that the weighted average yield will remain at its current level.
Our Adviser monitors our portfolio companies on an ongoing basis. It monitors the financial trends of each portfolio company to determine if they are meeting their respective business plans and to assess the appropriate course of action with respect to each portfolio company. Our Adviser has several methods of evaluating and monitoring the performance and fair value of our investments, which may include the following:
•assessment of success of the portfolio company in adhering to its business plan and compliance with covenants;
•periodic and regular contact with portfolio company management and, if appropriate, the financial or strategic sponsor, to discuss financial position, requirements and accomplishments;
•comparisons to other companies in the portfolio company’s industry; and
•review of monthly or quarterly financial statements and financial projections for portfolio companies.
An investment will be placed on the Adviser's credit watch list when select events occur and will only be removed from the watch list with oversight of the Technology Lending Investment Committee and/or other agents of Blue Owl’s credit platform. Once an investment is on the credit watch list, the Adviser works with the borrower to resolve any financial stress through amendments,
92
waivers or other alternatives. If a borrower defaults on its payment obligations, the Adviser's focus shifts to capital recovery. If an investment needs to be restructured, the Adviser’s workout team partners with the investment team and all material amendments, waivers and restructurings require the approval of a majority of the Technology Lending Investment Committee.
As part of the monitoring process, our Adviser employs an investment rating system to categorize our investments. In addition to various risk management and monitoring tools, our Adviser rates the credit risk of all investments on a scale of 1 to 5. This system is intended primarily to reflect the underlying risk of a portfolio investment relative to our initial cost basis in respect of such portfolio investment (i.e., at the time of origination or acquisition), although it may also take into account the performance of the portfolio company’s business, the collateral coverage of the investment and other relevant factors.
The rating system is as follows:
| Investment Rating | Description | |||||||
| 1 | Investments with a rating of 1 involve the least amount of risk to our initial cost basis. The borrower is performing above expectations, and the trends and risk factors for this investment since origination or acquisition are generally favorable; | |||||||
| 2 | Investments rated 2 involve an acceptable level of risk that is similar to the risk at the time of origination or acquisition. The borrower is generally performing as expected and the risk factors are neutral to favorable. All investments or acquired investments in new portfolio companies are initially assessed a rate of 2; | |||||||
| 3 | Investments rated 3 involve a borrower performing below expectations and indicates that the loan’s risk has increased somewhat since origination or acquisition; | |||||||
| 4 | Investments rated 4 involve a borrower performing materially below expectations and indicates that the loan’s risk has increased materially since origination or acquisition. In addition to the borrower being generally out of compliance with debt covenants, loan payments may be past due (but generally not more than 120 days past due); and | |||||||
| 5 | Investments rated 5 involve a borrower performing substantially below expectations and indicates that the loan’s risk has increased substantially since origination or acquisition. Most or all of the debt covenants are out of compliance and payments are substantially delinquent. Loans rated 5 are not anticipated to be repaid in full and we will reduce the fair value of the loan to the amount we anticipate will be recovered. | |||||||
Our Adviser rates the investments in our portfolio at least quarterly and it is possible that the rating of a portfolio investment may be reduced or increased over time. For investments rated 3, 4 or 5, our Adviser enhances its level of scrutiny over the monitoring of such portfolio company.
The Adviser has built out its portfolio management team to include workout experts who closely monitor our portfolio companies and who, on at least a quarterly basis, assess each portfolio company’s operational and liquidity exposure and outlook to understand and mitigate risks; and, on at least a monthly basis, evaluates existing and newly identified situations where operating results are deviating from expectations. As part of its monitoring process, the Adviser focuses on projected liquidity needs and where warranted, re-underwriting credits and evaluating downside and liquidation scenarios. The Adviser focuses on downside protection by leveraging existing rights available under our credit documents; however, for investments that are significantly underperforming or which may need to be restructured, the Adviser’s workout team partners with the investment team and all material amendments, waivers and restructurings require the approval of a majority of the Technology Lending Investment Committee. As of December 31, 2025, two of our portfolio companies are on non-accrual. Our average annual gain/(loss) ratio is 0.23%.
The table below presents the composition of our portfolio on the 1 to 5 rating scale as of the following periods:
| December 31, 2025 | December 31, 2024 | |||||||||||||||||||||||||
| Investment Rating | Investments at Fair Value | Percentage of Total Portfolio | Investments at Fair Value | Percentage of Total Portfolio | ||||||||||||||||||||||
| ($ in thousands) | ||||||||||||||||||||||||||
| 1 | $ | 1,653,599 | 11.6 | % | $ | 497,938 | 7.8 | % | ||||||||||||||||||
| 2 | 11,366,623 | 79.6 | 5,264,285 | 82.1 | ||||||||||||||||||||||
| 3 | 1,185,876 | 8.3 | 640,302 | 10.0 | ||||||||||||||||||||||
| 4 | 75,251 | 0.5 | — | — | ||||||||||||||||||||||
5(1) | 4,690 | — | 4,941 | 0.1 | ||||||||||||||||||||||
| Total | $ | 14,286,039 | 100.0 | % | $ | 6,407,466 | 100.0 | % | ||||||||||||||||||
93
(1)As of December 31, 2025, our investment rounds to less than 0.1% of the fair value of the portfolio.
The table below presents the amortized cost of our performing and non-accrual debt investments as of the following periods:
| December 31, 2025 | December 31, 2024 | ||||||||||||||||||||||
| ($ in thousands) | Amortized Cost | Percentage | Amortized Cost | Percentage | |||||||||||||||||||
| Performing | $ | 12,035,893 | 99.6 | % | $ | 5,075,380 | 99.7 | % | |||||||||||||||
| Non-accrual | 54,324 | 0.4 | 17,330 | 0.3 | |||||||||||||||||||
| Total | $ | 12,090,217 | 100.0 | % | $ | 5,092,710 | 100.0 | % | |||||||||||||||
Loans are generally placed on non-accrual status when there is reasonable doubt that principal or interest will be collected in full. Accrued interest is generally reversed when a loan is placed on non-accrual status. Interest payments received on non-accrual loans may be recognized as income or applied to principal depending upon management’s judgment regarding collectability. Non-accrual loans are restored to accrual status when past due principal and interest is paid current and, in management’s judgment, are likely to remain current. Management may make exceptions to this treatment and determine to not place a loan on non-accrual status if the loan has sufficient collateral value and is in the process of collection.
Portfolio Companies
The following table sets forth certain information regarding each of the portfolio companies in which we had a debt or equity investment as of December 31, 2025. We offer to make available significant managerial assistance to our portfolio companies. We may receive rights to observe the meetings of our portfolio companies’ board of directors. Other than these investments, our only relationships with our portfolio companies are the managerial assistance we may separately provide to our portfolio companies, which services would be ancillary to our investments. As of December 31, 2025, other than Credit SLF, Blue Owl Leasing, Revolut Ribbit Holdings LLC, and Stripe Blue Owl we did not “control” any of our portfolio companies, and, other than Amergin, BOCSO, Coherent Group, Fifth Season, Halo Purchaser LLC, Help HP SCF Investor, LSI Financing DAC, LSI Financing LLC, Pluralsight, Inc., Signifyd Inc and Walker Edison Furniture Company LLC, we were not an “affiliate” of any of our portfolio companies, as defined in the 1940 Act. In general, under the 1940 Act, we would “control” a portfolio company if we owned 25.0% or more of its voting securities or have the power to exercise control over management or policies of such portfolio company (including through a management agreement) and would be an “affiliate” of a portfolio company if we owned 5.0% or more of its voting securities.
| ($ in thousands) Company | Industry | Type of Investment | Interest Rate | Maturity / Dissolution Date | Percentage of Class Held on a Fully Diluted Basis | Principal Number of Shares / Number of Units | Amortized Cost | Fair Value | ||||||||||||||||||||||||||||||||||||||||||||||||
| 6Sense Insights, Inc.(3)(4)—450 Mission Street, San Francisco, CA, 94105 | Application Software | Series E-1 Preferred Stock | N/A | N/A | 0.9% | 1,580,642 | $ | 48,102 | $ | 37,807 | ||||||||||||||||||||||||||||||||||||||||||||||
| AAM Series 1.1 Rail and Domestic Intermodal Feeder, LLC(3)(4)—1100 Highland Drive, Boca Raton, Florida, 33487 | Diversified Financial Services | Specialty finance equity investment | N/A | N/A | 11.1% | 7,365,950 | 9,178 | 9,656 | ||||||||||||||||||||||||||||||||||||||||||||||||
| AAM Series 1.1 Rail and Domestic Intermodal Feeder, LLC(3)(4)(6)—1100 Highland Drive, Boca Raton, Florida, 33487 | Diversified Financial Services | Specialty finance debt investment | N/A | 12.00% | 7/2030 | 16,312 | 16,303 | 16,312 | ||||||||||||||||||||||||||||||||||||||||||||||||
| AAM Series 2.1 Aviation Feeder, LLC(3)(4)—1100 Highland Drive, Boca Raton, Florida, 33487 | Diversified Financial Services | Specialty finance equity investment | N/A | N/A | 11.1% | 8,168,669 | 10,722 | 12,946 | ||||||||||||||||||||||||||||||||||||||||||||||||
| AAM Series 2.1 Aviation Feeder, LLC(3)(4)(6)—1100 Highland Drive, Boca Raton, Florida, 33487 | Diversified Financial Services | Specialty finance debt investment | N/A | 12.00% | 11/2030 | 21,140 | 21,146 | 21,140 | ||||||||||||||||||||||||||||||||||||||||||||||||
| Accelerate Topco Holdings, LLC(3)(4)—2650 McCormick Drive, Clearwater, FL, 33759 | Insurance | Common Units | N/A | N/A | 0.0% | 12,822 | 612 | 566 | ||||||||||||||||||||||||||||||||||||||||||||||||
| Accommodations Plus Technologies LLC(3)(4)(9)—265 Broadhollow Road, Melville, NY, 11747 | Airlines | First lien senior secured loan | S+ | 5.25% | 5/2032 | 48,844 | 48,379 | 48,112 | ||||||||||||||||||||||||||||||||||||||||||||||||
| Acorns Grow Incorporated(3)(4)(6)—5300 California Avenue, Irvine, CA, 92617 | Capital Markets | Series F Preferred Stock | N/A | 5.00% | N/A | <1% | 572,135 | 11,820 | 11,826 | |||||||||||||||||||||||||||||||||||||||||||||||
94
| ($ in thousands) Company | Industry | Type of Investment | Interest Rate | Maturity / Dissolution Date | Percentage of Class Held on a Fully Diluted Basis | Principal Number of Shares / Number of Units | Amortized Cost | Fair Value | ||||||||||||||||||||||||||||||||||||||||||||||||
| Acquia Inc.(3)(4)(9)—53 State Street, Boston, MA, 02109 | Systems Software | First lien senior secured loan | S+ | 5.50% | 10/2026 | 188,298 | 188,019 | 183,120 | ||||||||||||||||||||||||||||||||||||||||||||||||
| Activate Holdings (US) Corp. (dba Absolute Software)(3)(4)(9)—1055 Dunsmuir Street, Vancouver, BC V7X 1K8, Canada | Systems Software | First lien senior secured loan | S+ | 5.25% | 7/2030 | 53,987 | 54,003 | 53,987 | ||||||||||||||||||||||||||||||||||||||||||||||||
| Aerosmith Bidco 1 Limited (dba Audiotonix)(3)(4)(9)—No.5 The Distillery Silverglade Business Park Leatherhead Road, Chessington, Surrey KT9 2QL, United Kingdom | Entertainment | First lien senior secured loan | S+ | 5.25% | 7/2031 | 197,055 | 196,059 | 197,055 | ||||||||||||||||||||||||||||||||||||||||||||||||
| AI Titan Parent, Inc. (dba Prometheus Group)(3)(4)(8)—4601 Six Forks Road, Raleigh, NC, 27609 | Application Software | First lien senior secured loan | S+ | 4.50% | 8/2031 | 52,447 | 51,959 | 51,884 | ||||||||||||||||||||||||||||||||||||||||||||||||
| Algolia, Inc.(4)—3790 El Camino Real, Palo Alto, CA, 94306 | Systems Software | Series C Preferred Stock | N/A | N/A | 0.2% | 970,281 | 10,000 | 17,523 | ||||||||||||||||||||||||||||||||||||||||||||||||
| Algolia, Inc.(4)—3790 El Camino Real, Palo Alto, CA, 94306 | Systems Software | Series D Preferred Stock | N/A | N/A | 1.2% | 136,776 | 4,000 | 3,027 | ||||||||||||||||||||||||||||||||||||||||||||||||
| Alpha Partners Technology Merger Corp—Empire State Building, New York, NY, 10118 | Application Software | Common stock | N/A | N/A | 0.0% | 30,000 | 1,000 | 347 | ||||||||||||||||||||||||||||||||||||||||||||||||
| Alpha Partners Technology Merger Corp—Empire State Building, New York, NY, 10118 | Application Software | Warrants | N/A | N/A | 0.0% | 666,666 | — | 360 | ||||||||||||||||||||||||||||||||||||||||||||||||
| AlphaSense, Inc.(3)(4)(9)—24 Union Square East, New York, NY, 10003 | Application Software | First lien senior secured loan | S+ | 6.25% | 6/2029 | 59,360 | 58,953 | 59,212 | ||||||||||||||||||||||||||||||||||||||||||||||||
| AlphaSense, LLC(3)(4)—24 Union Square East, New York, NY, 10003 | Application Software | Series E Preferred Shares | N/A | N/A | 0.3% | 1,422,042 | 13,176 | 17,731 | ||||||||||||||||||||||||||||||||||||||||||||||||
| Amergin Asset Management, LLC(3)(4)—1100 Highland Drive, Boca Raton, Florida, 33487 | Diversified Financial Services | Specialty finance equity investment | N/A | N/A | 5.0% | 50,000,000 | 783 | 2,137 | ||||||||||||||||||||||||||||||||||||||||||||||||
| AmeriLife Holdings LLC(3)(4)(9)—2650 McCormick Drive, Clearwater, FL, 33759 | Insurance | First lien senior secured loan | S+ | 5.00% | 8/2029 | 45,716 | 45,539 | 45,486 | ||||||||||||||||||||||||||||||||||||||||||||||||
| AmeriLife Holdings LLC(3)(4)(9)—2650 McCormick Drive, Clearwater, FL, 33759 | Insurance | First lien senior secured revolving loan | S+ | 5.00% | 8/2028 | 816 | 797 | 792 | ||||||||||||||||||||||||||||||||||||||||||||||||
| Anaplan, Inc.(3)(4)(9)—1450 Brickell Avenue, Miami, FL, 33131 | Application Software | First lien senior secured loan | S+ | 4.50% | 6/2029 | 123,741 | 123,741 | 123,741 | ||||||||||||||||||||||||||||||||||||||||||||||||
| Appfire Technologies, LLC(3)(4)(9)—1500 District Avenue, Burlington, MA, 01803 | Systems Software | First lien senior secured loan | S+ | 4.75% | 3/2028 | 7,343 | 7,345 | 7,343 | ||||||||||||||||||||||||||||||||||||||||||||||||
| Aptean Acquiror, Inc. (dba Aptean)(3)(4)(8)—4325 Alexander Drive, Alpharetta, GA, 30022 | Industrial Conglomerates | First lien senior secured revolving loan | S+ | 4.65% | 1/2031 | 272 | 269 | 272 | ||||||||||||||||||||||||||||||||||||||||||||||||
| Aptean Acquiror, Inc. (dba Aptean)(3)(4)(9)—4325 Alexander Drive, Alpharetta, GA, 30022 | Industrial Conglomerates | First lien senior secured loan | S+ | 4.75% | 1/2031 | 16,776 | 16,704 | 16,776 | ||||||||||||||||||||||||||||||||||||||||||||||||
| Arctic Wolf Networks, Inc.(3)(4)(6)—8939 Columbine Road, Eden Prairie, MN, 55347 | Systems Software | Senior convertible notes | N/A | 3.00% | 11/2030 | 0.0% | 130,908 | 183,045 | 183,045 | |||||||||||||||||||||||||||||||||||||||||||||||
95
| ($ in thousands) Company | Industry | Type of Investment | Interest Rate | Maturity / Dissolution Date | Percentage of Class Held on a Fully Diluted Basis | Principal Number of Shares / Number of Units | Amortized Cost | Fair Value | ||||||||||||||||||||||||||||||||||||||||||||||||
| Arctic Wolf Networks, Inc.(3)(4)(9)—8939 Columbine Road, Eden Prairie, MN, 55347 | Systems Software | First lien senior secured loan | S+ | 5.75% | 2/2030 | 88,384 | 87,605 | 87,942 | ||||||||||||||||||||||||||||||||||||||||||||||||
| Arctic Wolf Networks, Inc.(4)—8939 Columbine Road, Eden Prairie, MN, 55347 | Systems Software | Preferred Stock | N/A | N/A | 0.0% | 3,032,840 | 25,036 | 28,149 | ||||||||||||||||||||||||||||||||||||||||||||||||
| Armstrong Bidco Limited(3)(4)(19)—Armstrong Building, Oakwood Drive Loughborough University Science & Enterprise Park, Loughborough LE11 3QF, United Kingdom | Application Software | First lien senior secured GBP term loan | SA+ | 5.25% | 6/2029 | £ | 16,173 | 20,205 | 21,645 | |||||||||||||||||||||||||||||||||||||||||||||||
| Arrow Borrower 2025, Inc. (dba AvidXchange)(3)(4)(9)—1210 AvidXchange Lane, Charlotte, NC, 28206 | Application Software | First lien senior secured loan | S+ | 4.25% | 10/2032 | 36,960 | 36,779 | 36,775 | ||||||||||||||||||||||||||||||||||||||||||||||||
| Artifact Bidco, Inc. (dba Avetta)(3)(4)(9)—3300 North Triumph Boulevard, Lehi, UT, 84043 | Application Software | First lien senior secured loan | S+ | 4.15% | 7/2031 | 34,579 | 34,437 | 34,579 | ||||||||||||||||||||||||||||||||||||||||||||||||
| Associations Finance, Inc.(3)(4)(6)—5401 North Central Expressway, Dallas, TX, 75205 | Buildings & Real Estate | Unsecured notes | N/A | 14.25% | 5/2030 | 0.0% | 45,790 | 45,689 | 45,790 | |||||||||||||||||||||||||||||||||||||||||||||||
| Associations, Inc.(3)(4)(9)—5401 North Central Expressway, Dallas, TX, 75205 | Buildings & Real Estate | First lien senior secured loan | S+ | 6.50% | 7/2028 | 137,330 | 137,223 | 137,330 | ||||||||||||||||||||||||||||||||||||||||||||||||
| Asurion, LLC(3)(8)—140 11th Avenue North, Nashville, TN, 37203 | Insurance | First lien senior secured loan | S+ | 4.25% | 8/2028 | 18,249 | 18,171 | 18,272 | ||||||||||||||||||||||||||||||||||||||||||||||||
| Asurion, LLC(3)(8)—140 11th Avenue North, Nashville, TN, 37203 | Insurance | Second lien senior secured loan | S+ | 5.25% | 1/2028 | 10,833 | 10,741 | 10,781 | ||||||||||||||||||||||||||||||||||||||||||||||||
| Athenahealth Group Inc.(3)(8)—Boston Landing, Boston, MA, 02135 | Health Care Technology | First lien senior secured loan | S+ | 2.75% | 2/2029 | 3,458 | 3,425 | 3,462 | ||||||||||||||||||||||||||||||||||||||||||||||||
| Aurelia Netherlands B.V.(3)(4)(14)—Grensen 5, Oslo, 0159, Norway | Internet & Direct Marketing Retail | First lien senior secured EUR term loan | E+ | 4.75% | 5/2031 | € | 64,942 | 73,397 | 76,271 | |||||||||||||||||||||||||||||||||||||||||||||||
| Axonius, Inc.(4)—41 Madison Avenue, New York, NY, 10010 | Systems Software | Series E Preferred Stock | N/A | N/A | 0.4% | 1,733,274 | 8,149 | 10,000 | ||||||||||||||||||||||||||||||||||||||||||||||||
| Azurite Intermediate Holdings, Inc. (dba Alteryx, Inc.)(3)(4)(8)—3347 Michelson Drive, Irvine, CA, 92612 | Systems Software | First lien senior secured loan | S+ | 6.00% | 3/2031 | 94,049 | 93,224 | 94,049 | ||||||||||||||||||||||||||||||||||||||||||||||||
| Bamboo US BidCo LLC(3)(4)(14)—1 Baxter Parkway, Deerfield, IL, 60015 | Life Sciences Tools & Services | First lien senior secured EUR term loan | E+ | 5.00% | 9/2030 | € | 15,539 | 16,720 | 18,250 | |||||||||||||||||||||||||||||||||||||||||||||||
| Bamboo US BidCo LLC(3)(4)(8)—1 Baxter Parkway, Deerfield, IL, 60015 | Life Sciences Tools & Services | First lien senior secured delayed draw term loan | S+ | 5.06% | 9/2030 | 2,852 | 2,835 | 2,852 | ||||||||||||||||||||||||||||||||||||||||||||||||
| Bamboo US BidCo LLC(3)(4)(9)—1 Baxter Parkway, Deerfield, IL, 60015 | Life Sciences Tools & Services | First lien senior secured delayed draw term loan | S+ | 5.00% | 9/2030 | 32,217 | 32,194 | 32,217 | ||||||||||||||||||||||||||||||||||||||||||||||||
| Barracuda Parent, LLC(3)(4)(9)—3175 Winchester Boulevard, Campbell, CA, 95008 | Systems Software | Second lien senior secured loan | S+ | 7.00% | 8/2030 | 55,875 | 44,798 | 40,509 | ||||||||||||||||||||||||||||||||||||||||||||||||
96
| ($ in thousands) Company | Industry | Type of Investment | Interest Rate | Maturity / Dissolution Date | Percentage of Class Held on a Fully Diluted Basis | Principal Number of Shares / Number of Units | Amortized Cost | Fair Value | ||||||||||||||||||||||||||||||||||||||||||||||||
| Barracuda Parent, LLC(3)(4)(9)—3175 Winchester Boulevard, Campbell, CA, 95008 | Systems Software | First lien senior secured loan | S+ | 6.50% | 8/2029 | 20,442 | 19,931 | 17,989 | ||||||||||||||||||||||||||||||||||||||||||||||||
| Barracuda Parent, LLC(3)(9)—3175 Winchester Boulevard, Campbell, CA, 95008 | Systems Software | First lien senior secured loan | S+ | 4.50% | 8/2029 | 22,800 | 20,476 | 18,404 | ||||||||||||||||||||||||||||||||||||||||||||||||
| Baypine Commander Co-Invest, LP(3)(4)—310 East 4500 South, Salt Lake City, UT, 84107 | Life Sciences Tools & Services | LP Interest | N/A | N/A | 0.0% | $ | 1,807 | 1,818 | 1,979 | |||||||||||||||||||||||||||||||||||||||||||||||
| Bayshore Intermediate #2, L.P. (dba Boomi)(3)(4)(9)—1 West Elm Street, Conshohocken, PA, 19428 | Systems Software | First lien senior secured loan | S+ | 2.50% | 3.00% | 10/2028 | 158,041 | 158,069 | 158,041 | |||||||||||||||||||||||||||||||||||||||||||||||
| Bayshore Intermediate #2, L.P. (dba Boomi)(3)(4)(9)—1 West Elm Street, Conshohocken, PA, 19428 | Systems Software | First lien senior secured revolving loan | S+ | 5.00% | 10/2027 | 3,257 | 3,234 | 3,257 | ||||||||||||||||||||||||||||||||||||||||||||||||
| BCPE Osprey Buyer, Inc. (dba PartsSource)(3)(4)(8)—50 Executive Parkway, Hudson, OH, 44236 | Health Care Technology | First lien senior secured delayed draw term loan | S+ | 5.75% | 8/2028 | 24,701 | 24,464 | 24,455 | ||||||||||||||||||||||||||||||||||||||||||||||||
| BCPE Osprey Buyer, Inc. (dba PartsSource)(3)(4)(8)—50 Executive Parkway, Hudson, OH, 44236 | Health Care Technology | First lien senior secured revolving loan | S+ | 5.75% | 8/2026 | 10,193 | 10,166 | 10,071 | ||||||||||||||||||||||||||||||||||||||||||||||||
| BCPE Osprey Buyer, Inc. (dba PartsSource)(3)(4)(9)—50 Executive Parkway, Hudson, OH, 44236 | Health Care Technology | First lien senior secured loan | S+ | 5.75 | 8/2028 | 112,966 | 112,138 | 111,836 | ||||||||||||||||||||||||||||||||||||||||||||||||
| BCTO BSI Buyer, Inc. (dba Buildertrend)(3)(4)(9)—11818 I Street, Omaha, NE, 68137 | Household Durables | First lien senior secured loan | S+ | 6.50% | 12/2028 | 83,345 | 83,166 | 83,345 | ||||||||||||||||||||||||||||||||||||||||||||||||
| BCTO WIW Holdings, Inc. (dba When I Work)(3)(4)(6)—420 North 5th Street, Minneapolis, MN, 55401 | Professional Services | Senior convertible notes | N/A | 5.50% | 8/2030 | 0.0% | 4,740 | 4,694 | 4,694 | |||||||||||||||||||||||||||||||||||||||||||||||
| BEHP Co-Investor II, L.P.(3)(4)—11511 Reed Hartman Highway, Blue Ash, OH, 45241 | Health Care Technology | LP Interest | N/A | N/A | 0.0% | $ | 2,540 | 1,901 | 3,668 | |||||||||||||||||||||||||||||||||||||||||||||||
| Bird Holding B.V. (fka MessageBird Holding B.V.)(3)(4)—Postbus 14674, 1001 LD Amsterdam, The Netherlands | Application Software | Extended Series C Warrants | N/A | N/A | 0.0% | 191,530 | 1,174 | 214 | ||||||||||||||||||||||||||||||||||||||||||||||||
| Blackhawk Network Holdings, Inc.(3)(9)—6220 Stoneridge Mall Rd, Pleasanton, CA, 94588 | Diversified Financial Services | First lien senior secured loan | S+ | 4.00% | 3/2029 | 89,496 | 89,464 | 89,836 | ||||||||||||||||||||||||||||||||||||||||||||||||
| Blend Labs, Inc.(3)(4)—415 Kearny Street, San Francisco, CA, 94108 | Thrifts & Mortgage Finance | Warrants | N/A | N/A | 0.2% | 299,215 | 1,625 | 2 | ||||||||||||||||||||||||||||||||||||||||||||||||
| Blue Owl Credit SLF LLC(3)(5)—399 Park Avenue, 37th Floor, New York, NY 10022 | Joint Venture | LLC Interest | N/A | N/A | 0.0% | $ | 30,875 | 30,885 | 30,760 | |||||||||||||||||||||||||||||||||||||||||||||||
| Blue Owl Cross-Strategy Opportunities LLC(3)(5)—399 Park Avenue, New York, NY 10022 | Asset Based Lending and Fund Finance | Specialty finance equity investment | N/A | N/A | 0.0% | $ | 57,713 | 57,713 | 57,713 | |||||||||||||||||||||||||||||||||||||||||||||||
| Blue Owl Leasing LLC(3)(5)—399 Park Avenue, 37th Floor, New York, NY 10022 | Joint Venture | LLC Interest | N/A | N/A | 7.9% | $ | 5,105 | 5,105 | 5,102 | |||||||||||||||||||||||||||||||||||||||||||||||
| Bolt Technology OÜ(4)—Vana-Lõuna tn 15, 10134 Tallinn, Estonia | Road & Rail | Preferred Stock | N/A | N/A | 0.2% | 43,478 | 11,318 | 12,476 | ||||||||||||||||||||||||||||||||||||||||||||||||
97
| ($ in thousands) Company | Industry | Type of Investment | Interest Rate | Maturity / Dissolution Date | Percentage of Class Held on a Fully Diluted Basis | Principal Number of Shares / Number of Units | Amortized Cost | Fair Value | ||||||||||||||||||||||||||||||||||||||||||||||||
| Boxer Parent Company Inc. (f/k/a BMC)(3)(9)—2103 CityWest Boulevard, Houston, TX, 77042 | Application Software | First lien senior secured loan | S+ | 3.00% | 7/2031 | 29,775 | 29,523 | 29,674 | ||||||||||||||||||||||||||||||||||||||||||||||||
| Bracket Intermediate Holding Corp.(3)(4)(9)—785 Arbor Way, Blue Bell, PA, 19422 | Life Sciences Tools & Services | First lien senior secured loan | S+ | 4.75% | 10/2031 | 36,425 | 36,069 | 36,061 | ||||||||||||||||||||||||||||||||||||||||||||||||
| Brex, Inc.(3)(4)—650 South 500 West, Salt Lake City, UT, 84101 | Diversified Financial Services | Class A Units | N/A | N/A | 0.0% | 1,358,335 | 9,997 | 9,997 | ||||||||||||||||||||||||||||||||||||||||||||||||
| Brex, Inc.(4)—650 South 500 West, Salt Lake City, UT, 84101 | Diversified Financial Services | Preferred Stock | N/A | N/A | 0.0% | 143,943 | 5,012 | 3,678 | ||||||||||||||||||||||||||||||||||||||||||||||||
| Bristol Hospice L.L.C.(3)(4)(9)—206 North 2100 West, Salt Lake City, UT, 84116 | Health Care Providers & Services | First lien senior secured loan | S+ | 5.00% | 8/2032 | 18,258 | 18,168 | 18,258 | ||||||||||||||||||||||||||||||||||||||||||||||||
| Brooklyn Lender Co-Invest 2, L.P. (dba Boomi)(3)(4)—1 West Elm Street, Conshohocken, PA, 19428 | Systems Software | Common Units | N/A | N/A | 0.4% | 12,692,160 | 12,692 | 21,299 | ||||||||||||||||||||||||||||||||||||||||||||||||
| BTRS Holdings Inc. (dba Billtrust)(3)(4)(9)—11D South Gold Drive, Hamilton, NJ, 08691 | Diversified Financial Services | First lien senior secured loan | S+ | 5.50% | 12/2028 | 150,601 | 150,344 | 150,601 | ||||||||||||||||||||||||||||||||||||||||||||||||
| BusinessSolver.com, Inc.(3)(4)(9)—1025 Ashworth Road, West Des Moines, IA, 50265 | Application Software | First lien senior secured loan | S+ | 4.50% | 12/2032 | 84,467 | 84,048 | 84,045 | ||||||||||||||||||||||||||||||||||||||||||||||||
| CALABRIO, INC.(3)(4)(9)—241 North 5th Avenue, Minneapolis, MN, 55401 | Application Software | First lien senior secured loan | S+ | 4.00% | 11/2032 | 10,000 | 9,505 | 9,500 | ||||||||||||||||||||||||||||||||||||||||||||||||
| Cambrex Corporation(3)(4)(8)—One Meadowlands Plaza, East Rutherford, NJ, 07073 | Health Care Equipment & Supplies | First lien senior secured loan | S+ | 4.50% | 3/2032 | 39,261 | 38,872 | 39,261 | ||||||||||||||||||||||||||||||||||||||||||||||||
| Catalis Intermediate, Inc. (fka GovBrands Intermediate, Inc.)(3)(4)(9)—3025 Windward Plaza, Alpharetta, GA, 30005 | Application Software | First lien senior secured loan | S+ | 5.50% | 8/2027 | 76,468 | 75,836 | 74,819 | ||||||||||||||||||||||||||||||||||||||||||||||||
| CCI BUYER, INC. (dba Consumer Cellular)(3)(4)(9)—9363 East Bahia Drive, Scottsdale, AZ, 85260 | Wireless Telecommunication Services | First lien senior secured loan | S+ | 5.00% | 5/2032 | 74,926 | 74,221 | 74,926 | ||||||||||||||||||||||||||||||||||||||||||||||||
| CCM Midco, LLC (f/k/a Cresset Capital Management, LLC)(3)(4)(8)—444 West Lake Street, Chicago, IL, 60606 | Capital Markets | First lien senior secured loan | S+ | 4.75% | 6/2030 | 19,829 | 19,652 | 19,829 | ||||||||||||||||||||||||||||||||||||||||||||||||
| Certinia Inc.(3)(4)(9)—301 Congress Avenue, Austin, TX, 78701 | Professional Services | First lien senior secured loan | S+ | 4.50% | 8/2031 | 231,597 | 231,242 | 231,018 | ||||||||||||||||||||||||||||||||||||||||||||||||
| Chrome Investors LP(3)(4)—5301 Southwest Parkway, Austin, TX, 78735 | Systems Software | LP Interest | N/A | N/A | N/A | $ | 16,407 | 16,417 | 16,407 | |||||||||||||||||||||||||||||||||||||||||||||||
| Circle Internet Services, Inc.(4)—2261 Market Street, San Francisco, CA, 94114 | Systems Software | Subordinated Convertible Security | N/A | N/A | N/A | 759 | 759 | 759 | ||||||||||||||||||||||||||||||||||||||||||||||||
| Circle Internet Services, Inc.(4)—2261 Market Street, San Francisco, CA, 94114 | Systems Software | Warrants | N/A | N/A | 0.1% | 244,580 | 6 | 538 | ||||||||||||||||||||||||||||||||||||||||||||||||
98
| ($ in thousands) Company | Industry | Type of Investment | Interest Rate | Maturity / Dissolution Date | Percentage of Class Held on a Fully Diluted Basis | Principal Number of Shares / Number of Units | Amortized Cost | Fair Value | ||||||||||||||||||||||||||||||||||||||||||||||||
| Circle Internet Services, Inc.(4)—2261 Market Street, San Francisco, CA, 94114 | Systems Software | Series D Preferred Stock | N/A | N/A | 4.5% | 2,934,961 | 15,000 | 14,175 | ||||||||||||||||||||||||||||||||||||||||||||||||
| Circle Internet Services, Inc.(4)—2261 Market Street, San Francisco, CA, 94114 | Systems Software | Series E Preferred Stock | N/A | N/A | 4.5% | 821,806 | 6,917 | 4,978 | ||||||||||||||||||||||||||||||||||||||||||||||||
| Circle Internet Services, Inc.(4)—2261 Market Street, San Francisco, CA, 94114 | Systems Software | Series F Preferred Stock | N/A | N/A | 4.5% | 75,876 | 1,500 | 788 | ||||||||||||||||||||||||||||||||||||||||||||||||
| CivicPlus, LLC(3)(4)(9)—302 South 4th Street, Manhattan, KS, 66502 | Application Software | First lien senior secured loan | S+ | 3.25% | 2.75% | 8/2030 | 92,655 | 92,235 | 92,655 | |||||||||||||||||||||||||||||||||||||||||||||||
| CivicPlus, LLC(3)(4)(9)—302 South 4th Street, Manhattan, KS, 66502 | Application Software | First lien senior secured delayed draw term loan | S+ | 5.50% | 8/2030 | 12,669 | 12,606 | 12,669 | ||||||||||||||||||||||||||||||||||||||||||||||||
| CloudPay, Inc.(3)(4)(6)—Kingsgate House, Newbury Road, Andover, Hampshire SP10 4DU, United Kingdom | Professional Services | Series E Preferred Stock | N/A | 13.50% | N/A | 3.6% | 87,370 | 22,661 | 22,653 | |||||||||||||||||||||||||||||||||||||||||||||||
| CloudPay, Inc.(3)(4)(9)—Kingsgate House, Newbury Road, Andover, Hampshire SP10 4DU, United Kingdom | Professional Services | First lien senior secured loan | S+ | 7.50% | 7/2029 | 24,500 | 24,263 | 23,582 | ||||||||||||||||||||||||||||||||||||||||||||||||
| Coherent Group Inc.(3)(4)(6)—1450 Broadway, New York, NY, 10018 | Insurance | Convertible notes | N/A | 5.30% | 3/2027 | 0.0% | 3,029 | 3,029 | 3,029 | |||||||||||||||||||||||||||||||||||||||||||||||
| Coherent Group Inc.(4)—1450 Broadway, New York, NY, 10018 | Insurance | Series B Preferred Shares | N/A | N/A | 8.7% | 456,035 | 12,210 | 13,506 | ||||||||||||||||||||||||||||||||||||||||||||||||
| Color Intermediate, LLC (dba ClaimsXten)(3)(4)(9)—3803 West Chester Pike, Newtown Square, PA, 19073 | Health Care Technology | First lien senior secured loan | S+ | 4.75% | 10/2029 | 47,428 | 47,460 | 47,309 | ||||||||||||||||||||||||||||||||||||||||||||||||
| Commander Buyer, Inc. (dba CenExel)(3)(4)(9)—310 East 4500 South, Salt Lake City, UT, 84107 | Life Sciences Tools & Services | First lien senior secured loan | S+ | 4.75% | 6/2032 | 33,050 | 32,876 | 33,050 | ||||||||||||||||||||||||||||||||||||||||||||||||
| Computer Services, Inc. (dba CSI)(3)(4)(9)—3901 Technology Drive, Paducah, KY, 42001 | Diversified Financial Services | First lien senior secured loan | S+ | 4.50% | 11/2031 | 229,153 | 228,937 | 229,153 | ||||||||||||||||||||||||||||||||||||||||||||||||
| ConnectWise, LLC(3)(9)—400 North Tampa Street, Tampa, FL, 33602 | Systems Software | First lien senior secured loan | S+ | 3.50% | 9/2028 | 3,026 | 3,025 | 2,967 | ||||||||||||||||||||||||||||||||||||||||||||||||
| CoreTrust Purchasing Group LLC(3)(4)(8)—601 11th Avenue North, Nashville, TN, 37203 | Diversified Support Services | First lien senior secured loan | S+ | 5.00% | 10/2029 | 34,488 | 34,508 | 34,488 | ||||||||||||||||||||||||||||||||||||||||||||||||
| Cornerstone OnDemand, Inc.(3)(4)(8)—1601 Cloverfield Boulevard, Santa Monica, CA, 90404 | Professional Services | Second lien senior secured loan | S+ | 6.50% | 10/2029 | 71,667 | 71,056 | 64,500 | ||||||||||||||||||||||||||||||||||||||||||||||||
| Coupa Holdings, LLC(3)(4)(9)—950 Tower Lane, Foster City, CA, 94404 | Application Software | First lien senior secured loan | S+ | 5.25% | 2/2030 | 84,313 | 84,371 | 84,313 | ||||||||||||||||||||||||||||||||||||||||||||||||
| Covetrus, Inc.(3)(4)(9)—12 Mountfort Street, Portland, ME, 04101 | Health Care Providers & Services | Second lien senior secured loan | S+ | 9.25% | 10/2030 | 75,000 | 73,534 | 72,563 | ||||||||||||||||||||||||||||||||||||||||||||||||
| CP PIK DEBT ISSUER, LLC (dba CivicPlus, LLC)(3)(4)(10)—302 South 4th Street, Manhattan, KS, 66502 | Application Software | Unsecured notes | S+ | 11.75% | 6/2034 | 0.0% | 28,682 | 28,441 | 28,682 | |||||||||||||||||||||||||||||||||||||||||||||||
99
| ($ in thousands) Company | Industry | Type of Investment | Interest Rate | Maturity / Dissolution Date | Percentage of Class Held on a Fully Diluted Basis | Principal Number of Shares / Number of Units | Amortized Cost | Fair Value | ||||||||||||||||||||||||||||||||||||||||||||||||
| Creek Parent, Inc. (dba Catalent)(3)(4)(8)—200 Crossing Boulevard, Bridgewater, NJ, 08807 | Life Sciences Tools & Services | First lien senior secured loan | S+ | 5.00% | 12/2031 | 173,577 | 171,927 | 172,709 | ||||||||||||||||||||||||||||||||||||||||||||||||
| Crewline Buyer, Inc. (dba New Relic)(3)(4)(9)—188 Spear Street, San Francisco, CA, 94105 | Systems Software | First lien senior secured loan | S+ | 6.75% | 11/2030 | 213,236 | 211,129 | 211,637 | ||||||||||||||||||||||||||||||||||||||||||||||||
| CT Technologies Intermediate Holdings, Inc. (& Smart Holdings Corp.) (dba Datavant)(3)(4)(8)—2222 West Dunlap Avenue, Phoenix, AZ, 85021 | Health Care Technology | First lien senior secured loan | S+ | 5.00% | 8/2031 | 157,173 | 156,961 | 157,173 | ||||||||||||||||||||||||||||||||||||||||||||||||
| CT Technologies Intermediate Holdings, Inc. (& Smart Holdings Corp.) (dba Datavant)(3)(4)(8)—2222 West Dunlap Avenue, Phoenix, AZ, 85021 | Health Care Technology | First lien senior secured delayed draw term loan | S+ | 4.75% | 8/2031 | 41,781 | 41,551 | 41,572 | ||||||||||||||||||||||||||||||||||||||||||||||||
| Databricks, Inc.(3)(4)(8)—160 Spear Street, 15th Floor, San Francisco, CA, 94105 | Systems Software | First lien senior secured loan | S+ | 4.50% | 1/2031 | 114,694 | 114,233 | 114,694 | ||||||||||||||||||||||||||||||||||||||||||||||||
| Deerfield Dakota Holdings(3)(4)(9)—One World Trade Center, New York, NY, 10007 | Diversified Financial Services | First lien senior secured loan | S+ | 3.00% | 2.75% | 9/2032 | 127,462 | 126,851 | 126,825 | |||||||||||||||||||||||||||||||||||||||||||||||
| Delinea Buyer, Inc. (f/k/a Centrify)(3)(4)(9)—221 Main Street, San Francisco, CA, 94105 | Systems Software | First lien senior secured loan | S+ | 5.75 | 3/2028 | 104,640 | 103,571 | 104,640 | ||||||||||||||||||||||||||||||||||||||||||||||||
| Delta TopCo, Inc. (dba Infoblox, Inc.)(3)(8)—2390 Mission College Boulevard, Santa Clara, CA, 95054 | Systems Software | Second lien senior secured loan | S+ | 5.25% | 11/2030 | 30,000 | 29,976 | 29,514 | ||||||||||||||||||||||||||||||||||||||||||||||||
| Denali Intermediate Holdings, Inc. (dba Dun & Bradstreet)(3)(4)(8)—5335 Gate Parkway, Jacksonville, FL, 32256 | Capital Markets | First lien senior secured loan | S+ | 5.50% | 8/2032 | 86,364 | 85,115 | 85,068 | ||||||||||||||||||||||||||||||||||||||||||||||||
| Diamond Insure Bidco (dba Acturis)(3)(4)(14)—100 Hatton Garden, London , EC1N 8NX, United Kingdom | Insurance | First lien senior secured EUR term loan | E+ | 3.75% | 7/2031 | € | 8,121 | 8,678 | 9,538 | |||||||||||||||||||||||||||||||||||||||||||||||
| Diamond Insure Bidco (dba Acturis)(3)(4)(19)—100 Hatton Garden, London , EC1N 8NX, United Kingdom | Insurance | First lien senior secured GBP term loan | SA+ | 4.00% | 7/2031 | £ | 23,926 | 30,530 | 32,181 | |||||||||||||||||||||||||||||||||||||||||||||||
| Diligent Preferred Issuer, Inc. (dba Diligent Corporation)(3)(4)(6)—61 West 23rd Street, New York, NY, 10010 | Application Software | Preferred Stock | N/A | 10.50% | N/A | 0.0% | 15,000 | 23,489 | 22,488 | |||||||||||||||||||||||||||||||||||||||||||||||
| Dodge Construction Network Holdings, L.P.(3)(4)—56 Broad Street, Boston, MA, 02109 | Construction & Engineering | Class A-2 Common Units | N/A | N/A | 0.7% | 3,333,333 | 2,841 | 400 | ||||||||||||||||||||||||||||||||||||||||||||||||
| Dodge Construction Network Holdings, L.P.(3)(4)(6)—56 Broad Street, Boston, MA, 02109 | Construction & Engineering | Series A Preferred Units | N/A | 8.25% | N/A | 0.7% | — | 69 | 46 | |||||||||||||||||||||||||||||||||||||||||||||||
| Dodge Construction Network LLC(3)(4)(9)—56 Broad Street, Boston, MA, 02109 | Construction & Engineering | First lien senior secured loan | S+ | 4.75% | 2/2029 | 6,035 | 5,018 | 4,797 | ||||||||||||||||||||||||||||||||||||||||||||||||
| Dodge Construction Network LLC(3)(9)—56 Broad Street, Boston, MA, 02109 | Construction & Engineering | First lien senior secured loan | S+ | 6.25% | 1/2029 | 4,352 | 4,282 | 4,363 | ||||||||||||||||||||||||||||||||||||||||||||||||
100
| ($ in thousands) Company | Industry | Type of Investment | Interest Rate | Maturity / Dissolution Date | Percentage of Class Held on a Fully Diluted Basis | Principal Number of Shares / Number of Units | Amortized Cost | Fair Value | ||||||||||||||||||||||||||||||||||||||||||||||||
| Eagan Parent, Inc. (dba Elite)(3)(4)(9)—675 3rd Avenue, New York, NY, 10017 | Diversified Consumer Services | First lien senior secured loan | S+ | 4.25% | 9/2032 | 23,675 | 23,560 | 23,556 | ||||||||||||||||||||||||||||||||||||||||||||||||
| EET Buyer, Inc. (dba e-Emphasys)(3)(4)(9)—2501 Weston Parkway, Cary, NC, 27513 | Building Products | First lien senior secured loan | S+ | 5.25% | 11/2027 | 74,848 | 74,584 | 74,848 | ||||||||||||||||||||||||||||||||||||||||||||||||
| Einstein Parent, Inc. (dba Smartsheet)(3)(4)(9)—500 108th Avenue Northeast, Bellevue, WA, 98004 | Application Software | First lien senior secured loan | S+ | 6.50% | 1/2031 | 105,186 | 104,237 | 104,397 | ||||||||||||||||||||||||||||||||||||||||||||||||
| Elliott Alto Co-Investor Aggregator L.P.(3)(4)—851 Cypress Creek Road, Fort Lauderdale, FL, 33309 | Systems Software | LP Interest | N/A | N/A | 0.2% | $ | 14,627 | 21,934 | 33,569 | |||||||||||||||||||||||||||||||||||||||||||||||
| Engage Debtco Limited(3)(4)(9)—Courtyard House, The Weighbridge Brewery, High St, Marlow SL7 2FF, United Kingdom | Health Care Providers & Services | First lien senior secured loan | S+ | 3.18% | 2.75% | 7/2029 | 16,048 | 15,724 | 15,205 | |||||||||||||||||||||||||||||||||||||||||||||||
| Engage Debtco Limited(3)(4)(9)—Courtyard House, The Weighbridge Brewery, High St, Marlow SL7 2FF, United Kingdom | Health Care Providers & Services | First lien senior secured delayed draw term loan | S+ | 3.08% | 2.75% | 7/2029 | 5,210 | 5,109 | 4,937 | |||||||||||||||||||||||||||||||||||||||||||||||
| EresearchTechnology, Inc. (dba Clario)(3)(4)(8)—1818 Market Street, Philadelphia, PA, 19103 | Health Care Providers & Services | First lien senior secured loan | S+ | 4.75% | 1/2032 | 79,855 | 79,095 | 79,855 | ||||||||||||||||||||||||||||||||||||||||||||||||
| EShares, Inc. (dba Carta)(4)—333 Bush Street, San Francisco, CA, 94104 | Application Software | Series E Preferred Stock | N/A | N/A | 0.1% | 186,904 | 2,008 | 4,547 | ||||||||||||||||||||||||||||||||||||||||||||||||
| Excalibur CombineCo, L.P.(3)(4)—1051 East Hillsdale Boulevard, Foster City, CA, 94404 | Systems Software | Class A Units | N/A | N/A | 0.1% | 97,502 | 99,452 | 61,132 | ||||||||||||||||||||||||||||||||||||||||||||||||
| Fifth Season Investments LLC(3)(4)—201 Broad St, Suite 500, Stamford, Connecticut 06901, US, Stamford, CT, 06901 | Insurance | Specialty finance equity investment | N/A | N/A | 0.0% | 17 | 173,870 | 184,468 | ||||||||||||||||||||||||||||||||||||||||||||||||
| Finastra USA, Inc.(3)(4)(9)—4 Kingdom Street, Paddington, London W2 6BD, United Kingdom | Banks | First lien senior secured loan | S+ | 7.25% | 9/2029 | 42,236 | 42,153 | 42,553 | ||||||||||||||||||||||||||||||||||||||||||||||||
| Flexera Software LLC(3)(4)(13)—300 Park Boulevard, Itasca, IL, 60143 | IT Services | First lien senior secured EUR term loan | E+ | 4.50% | 8/2032 | € | 5,300 | 6,193 | 6,210 | |||||||||||||||||||||||||||||||||||||||||||||||
| Flexera Software LLC(3)(4)(9)—300 Park Boulevard, Itasca, IL, 60143 | IT Services | First lien senior secured loan | S+ | 4.50% | 8/2032 | 20,995 | 20,927 | 20,942 | ||||||||||||||||||||||||||||||||||||||||||||||||
| Forescout Technologies, Inc.(3)(4)(9)—300 Santana Row, San Jose, CA, 95128 | Systems Software | First lien senior secured loan | S+ | 4.50% | 5/2032 | 154,570 | 154,104 | 153,797 | ||||||||||||||||||||||||||||||||||||||||||||||||
| Foundation Consumer Brands, LLC(3)(4)(9)—1190 Omega Drive, Pittsburgh, PA, 15205 | Pharmaceuticals | First lien senior secured loan | S+ | 5.00% | 2/2029 | 20,983 | 20,896 | 20,878 | ||||||||||||||||||||||||||||||||||||||||||||||||
| Gainsight, Inc.(3)(4)(9)—350 Bay Street, San Francisco, CA, 94133 | Application Software | First lien senior secured loan | S+ | 5.75% | 7/2027 | 67,754 | 67,462 | 67,754 | ||||||||||||||||||||||||||||||||||||||||||||||||
| Galway Borrower LLC(3)(4)(9)—1 California Street, San Francisco, CA 94111 | Insurance | First lien senior secured delayed draw term loan | S+ | 4.50% | 9/2028 | 351 | 350 | 351 | ||||||||||||||||||||||||||||||||||||||||||||||||
101
| ($ in thousands) Company | Industry | Type of Investment | Interest Rate | Maturity / Dissolution Date | Percentage of Class Held on a Fully Diluted Basis | Principal Number of Shares / Number of Units | Amortized Cost | Fair Value | ||||||||||||||||||||||||||||||||||||||||||||||||
| Gerson Lehrman Group, Inc.(3)(4)(9)—60 East 42nd Street, New York, NY, 10165 | Professional Services | First lien senior secured loan | S+ | 5.00% | 12/2028 | 37,696 | 37,567 | 37,696 | ||||||||||||||||||||||||||||||||||||||||||||||||
| GI Ranger Intermediate, LLC (dba Rectangle Health)(3)(4)(9)—115 East Stevens Avenue, Valhalla, NY, 10595 | Health Care Technology | First lien senior secured loan | S+ | 6.00% | 10/2028 | 26,677 | 26,410 | 25,877 | ||||||||||||||||||||||||||||||||||||||||||||||||
| GI Ranger Intermediate, LLC (dba Rectangle Health)(3)(4)(9)—115 East Stevens Avenue, Valhalla, NY, 10595 | Health Care Technology | First lien senior secured revolving loan | S+ | 6.00% | 10/2027 | 295 | 281 | 229 | ||||||||||||||||||||||||||||||||||||||||||||||||
| Granicus, Inc.(3)(4)(9)—1999 Broadway, Denver, CO, 80202 | Application Software | First lien senior secured loan | S+ | 3.50% | 2.00% | 1/2031 | 3,972 | 3,958 | 3,972 | |||||||||||||||||||||||||||||||||||||||||||||||
| Granicus, Inc.(3)(4)(9)—1999 Broadway, Denver, CO, 80202 | Application Software | First lien senior secured delayed draw term loan | S+ | 3.00% | 2.00% | 1/2031 | 588 | 584 | 587 | |||||||||||||||||||||||||||||||||||||||||||||||
| Greenway Health, LLC(3)(4)(9)—4301 West Boy Scout Boulevard, Tampa, FL, 33607 | Health Care Technology | First lien senior secured loan | S+ | 6.75% | 4/2029 | 18,718 | 18,496 | 18,437 | ||||||||||||||||||||||||||||||||||||||||||||||||
| GS Acquisitionco, Inc. (dba insightsoftware)(3)(4)(9)—8529 Six Forks Road, Raleigh, NC, 27615 | Application Software | First lien senior secured loan | S+ | 5.25% | 5/2028 | 54,329 | 54,265 | 53,747 | ||||||||||||||||||||||||||||||||||||||||||||||||
| Gusto, Inc.(3)(4)(9)—525 20th Street, San Francisco, CA, 94107 | Application Software | First lien senior secured loan | S+ | 4.50% | 11/2030 | 46,280 | 46,111 | 46,107 | ||||||||||||||||||||||||||||||||||||||||||||||||
| H&F Opportunities LUX III S.À R.L (dba Checkmarx)(3)(4)(8)—140 East Ridgewood Avenue, Paramus, NJ, 07652 | Systems Software | First lien senior secured loan | S+ | 6.50% | 4/2027 | 148,144 | 147,874 | 148,144 | ||||||||||||||||||||||||||||||||||||||||||||||||
| Halo Purchaser, LLC(3)(4)—11095 Viking Drive, Eden Prairie, MN, 55344 | Systems Software | Class H Warrant Units | N/A | N/A | 0.0% | 67,301 | 1,686 | 1,686 | ||||||||||||||||||||||||||||||||||||||||||||||||
| Halo Purchaser, LLC(3)(4)(6)—11095 Viking Drive, Eden Prairie, MN, 55344 | Systems Software | Class B PIK Preferred Equity | N/A | 6.00% | N/A | 0.0% | 45,000 | 51,884 | 41,809 | |||||||||||||||||||||||||||||||||||||||||||||||
| HARNESS INC.(4)—2317 Broadway Street, Redwood City, CA, 94063 | Systems Software | Series D Preferred Stock | N/A | N/A | 0.6% | 1,022,648 | 9,169 | 14,376 | ||||||||||||||||||||||||||||||||||||||||||||||||
| Help HP SCF Investor, LP(3)(4)—11095 Viking Drive, Eden Prairie, MN, 55344 | Systems Software | LP Interest | N/A | N/A | 1.5% | $ | 59,333 | 59,392 | 44,890 | |||||||||||||||||||||||||||||||||||||||||||||||
| Hg Genesis 8 Sumoco Limited(3)(4)(19)—2 More London Riverside, London SE1 2AP, United Kingdom | Diversified Financial Services | Unsecured facility | SA+ | 7.50% | 9/2027 | £ | 13,504 | 17,026 | 18,164 | |||||||||||||||||||||||||||||||||||||||||||||||
| Hg Genesis 9 SumoCo Limited(3)(4)(14)—2 More London Riverside, London SE1 2AP, United Kingdom | Diversified Financial Services | Unsecured facility | E+ | 6.25% | 3/2029 | € | 58,971 | 64,063 | 69,258 | |||||||||||||||||||||||||||||||||||||||||||||||
| Hg Saturn Luchaco Limited(3)(4)(19)—2 More London Riverside, London SE1 2AP, United Kingdom | Diversified Financial Services | Unsecured facility | SA+ | 8.25% | 3/2027 | £ | 43,398 | 55,360 | 58,373 | |||||||||||||||||||||||||||||||||||||||||||||||
| Himalaya Topco LLC (dba HealthEdge)(3)(4)(8)—470 Atlantic Avenue, Boston, MA, 02210 | Health Care Technology | First lien senior secured loan | S+ | 2.75% | 2.25% | 6/2032 | 94,390 | 93,487 | 93,446 | |||||||||||||||||||||||||||||||||||||||||||||||
| Hyland Software, Inc.(3)(4)(9)—28105 Clemens Road, Westlake, OH, 44145 | Health Care Technology | First lien senior secured loan | S+ | 5.00% | 9/2030 | 148,299 | 148,345 | 148,299 | ||||||||||||||||||||||||||||||||||||||||||||||||
102
| ($ in thousands) Company | Industry | Type of Investment | Interest Rate | Maturity / Dissolution Date | Percentage of Class Held on a Fully Diluted Basis | Principal Number of Shares / Number of Units | Amortized Cost | Fair Value | ||||||||||||||||||||||||||||||||||||||||||||||||
| Icefall Parent, Inc. (dba EngageSmart)(3)(4)(9)—10 Fan Pier Boulevard, Boston, MA, 02210 | Diversified Consumer Services | First lien senior secured loan | S+ | 4.50% | 1/2030 | 30,068 | 30,068 | 30,068 | ||||||||||||||||||||||||||||||||||||||||||||||||
| Illumio, Inc.(4)—920 De Guigne Drive, Sunnyvale, CA, 94085 | Systems Software | Common stock | N/A | N/A | <1% | 358,365 | 2,432 | 1,725 | ||||||||||||||||||||||||||||||||||||||||||||||||
| Illumio, Inc.(4)—920 De Guigne Drive, Sunnyvale, CA, 94085 | Systems Software | Series F Preferred Stock | N/A | N/A | <1% | 2,483,618 | 16,684 | 16,249 | ||||||||||||||||||||||||||||||||||||||||||||||||
| Indikami Bidco, LLC (dba IntegriChain)(3)(4)(8)—8 Penn Center, 1628 JFK Boulevard, Philadelphia, PA, 19103 | Health Care Technology | First lien senior secured loan | S+ | 4.00% | 2.50% | 12/2030 | 136,382 | 134,721 | 133,655 | |||||||||||||||||||||||||||||||||||||||||||||||
| Indikami Bidco, LLC (dba IntegriChain)(3)(4)(8)—8 Penn Center, 1628 JFK Boulevard, Philadelphia, PA, 19103 | Health Care Technology | First lien senior secured delayed draw term loan | S+ | 6.00% | 12/2030 | 2,085 | 2,084 | 2,044 | ||||||||||||||||||||||||||||||||||||||||||||||||
| Indikami Bidco, LLC (dba IntegriChain)(3)(4)(8)—8 Penn Center, 1628 JFK Boulevard, Philadelphia, PA, 19103 | Health Care Technology | First lien senior secured revolving loan | S+ | 6.00% | 6/2030 | 9,906 | 9,756 | 9,645 | ||||||||||||||||||||||||||||||||||||||||||||||||
| Infobip Inc.(3)(4)(9)—35 – 38 New Bridge Street, London EC4V 6BW, United Kingdom | Application Software | First lien senior secured loan | S+ | 5.50% | 6/2029 | 67,366 | 66,478 | 66,692 | ||||||||||||||||||||||||||||||||||||||||||||||||
| Innovation Ventures HoldCo, LLC (dba 5 Hour Energy)(3)(4)(8)—38955 Hills Tech Drive, Farmington Hills, MI, 48331 | Beverages | First lien senior secured loan | S+ | 6.25% | 3/2027 | 1,909 | 1,891 | 1,904 | ||||||||||||||||||||||||||||||||||||||||||||||||
| Inovalon Holdings, Inc.(3)(4)(9)—4321 Collington Road, Bowie, MD, 20716 | Health Care Technology | First lien senior secured loan | S+ | 2.75% | 2.75% | 11/2028 | 193,192 | 192,951 | 189,328 | |||||||||||||||||||||||||||||||||||||||||||||||
| Inovalon Holdings, Inc.(3)(4)(9)—4321 Collington Road, Bowie, MD, 20716 | Health Care Technology | Second lien senior secured loan | S+ | 8.50% | 11/2033 | 77,128 | 77,128 | 70,958 | ||||||||||||||||||||||||||||||||||||||||||||||||
| Insight CP (Blocker) Holdings, L.P. (dba CivicPlus, LLC)(3)(4)—302 South 4th Street, Manhattan, KS, 66502 | Application Software | LP Interest | N/A | N/A | 0.2% | $ | 2,292 | 2,292 | 3,023 | |||||||||||||||||||||||||||||||||||||||||||||||
| Integrity Marketing Acquisition, LLC(3)(4)(9)—1445 Ross Avenue, Dallas, TX, 75202 | Insurance | First lien senior secured loan | S+ | 5.00% | 8/2028 | 90,977 | 90,778 | 90,977 | ||||||||||||||||||||||||||||||||||||||||||||||||
| Intelerad Medical Systems Incorporated (fka 11849573 Canada Inc.)(3)(4)(9)—305 Church at North Hills Street, Raleigh, NC, 27609 | Health Care Technology | First lien senior secured loan | S+ | 6.50% | 8/2026 | 163,146 | 162,864 | 163,146 | ||||||||||||||||||||||||||||||||||||||||||||||||
| Interoperability Bidco, Inc. (dba Lyniate)(3)(4)(9)—One Beacon Street, Boston, MA, 02108 | Health Care Technology | First lien senior secured loan | S+ | 5.75% | 3/2028 | 116,636 | 116,035 | 116,016 | ||||||||||||||||||||||||||||||||||||||||||||||||
| IRI Group Holdings, Inc. (f/k/a Circana Group, L.P. (f/k/a The NPD Group, L.P.))(3)(4)(8)—203 North LaSalle Street, Chicago, IL, 60601 | Food & Staples Retailing | First lien senior secured loan | S+ | 4.25% | 12/2029 | 187,088 | 187,024 | 187,088 | ||||||||||||||||||||||||||||||||||||||||||||||||
| Iris Specialty Acquisition LLC (dba Integrated Specialty Coverages)(3)(4)(9)—1811 Aston Avenue, Carlsbad, CA, 92008 | Insurance | First lien senior secured loan | S+ | 4.50% | 11/2032 | 3,261 | 3,245 | 3,245 | ||||||||||||||||||||||||||||||||||||||||||||||||
103
| ($ in thousands) Company | Industry | Type of Investment | Interest Rate | Maturity / Dissolution Date | Percentage of Class Held on a Fully Diluted Basis | Principal Number of Shares / Number of Units | Amortized Cost | Fair Value | ||||||||||||||||||||||||||||||||||||||||||||||||
| Jeppesen Holdings, LLC(3)(4)(9)—55 Inverness Drive East, Denver, CO, 80112 | Aerospace & Defense | First lien senior secured loan | S+ | 4.75% | 10/2032 | 44,089 | 43,758 | 43,758 | ||||||||||||||||||||||||||||||||||||||||||||||||
| JS Parent, Inc. (dba Jama Software)(3)(4)(9)—135 Southwest Taylor, Portland, OR, 97204 | Application Software | First lien senior secured loan | S+ | 4.75% | 4/2031 | 27,011 | 26,964 | 27,011 | ||||||||||||||||||||||||||||||||||||||||||||||||
| JumpCloud, Inc.(4)—361 Centennial Parkway, Louisville, CO, 80027 | IT Services | Series B Preferred Stock | N/A | N/A | 1.6% | 756,590 | 4,531 | 782 | ||||||||||||||||||||||||||||||||||||||||||||||||
| JumpCloud, Inc.(4)—361 Centennial Parkway, Louisville, CO, 80027 | IT Services | Series F Preferred Stock | N/A | N/A | 1.6% | 6,679,245 | 40,017 | 28,343 | ||||||||||||||||||||||||||||||||||||||||||||||||
| Juniper Square, Inc.(3)(4)—555 Montgomery Street, San Francisco, CA, 94111 | Diversified Financial Services | Warrants | N/A | N/A | 0.2% | 40,984 | 2,128 | 1,471 | ||||||||||||||||||||||||||||||||||||||||||||||||
| Kajabi Holdings, LLC(4)—880 Newport Center Drive, Newport Beach, CA, 92660 | Internet & Direct Marketing Retail | Senior Preferred Class D Units | N/A | N/A | 2.2% | 4,126,175 | 50,025 | 39,573 | ||||||||||||||||||||||||||||||||||||||||||||||||
| Kaseya Inc.(3)(8)—701 Brickell Avenue, Miami, FL, 33131 | IT Services | First lien senior secured loan | S+ | 3.00% | 3/2032 | 69,475 | 69,196 | 69,482 | ||||||||||||||||||||||||||||||||||||||||||||||||
| Kaseya Inc.(3)(8)—701 Brickell Avenue, Miami, FL, 33131 | IT Services | Second lien senior secured loan | S+ | 5.00% | 3/2033 | 19,884 | 19,813 | 19,417 | ||||||||||||||||||||||||||||||||||||||||||||||||
| Klarna Holding AB(3)(4)(9)—Sveavägen 46, 111 34 Stockholm, Sweden | Consumer Finance | Subordinated Floating Rate Notes | S+ | 7.00% | 4/2034 | 0.0% | 65,334 | 65,358 | 65,334 | |||||||||||||||||||||||||||||||||||||||||||||||
| Knockout Intermediate Holdings I Inc. (dba Kaseya Inc.)(3)(4)(10)—701 Brickell Avenue, Miami, FL, 33131 | IT Services | Perpetual Preferred Stock | S+ | 10.75% | N/A | 0.0% | 44,100 | 61,572 | 60,612 | |||||||||||||||||||||||||||||||||||||||||||||||
| KPCI Co-Invest 2, L.P.(3)(4)—3001 Red Lion Road, Philadelphia, PA, 19114 | Health Care Equipment & Supplies | Class A Units | N/A | N/A | 0.1% | 587,621 | 5,876 | 5,876 | ||||||||||||||||||||||||||||||||||||||||||||||||
| KWOL Acquisition, Inc. (dba Worldwide Clinical Trials)(3)(4)—600 Park Offices Drive, Durham, NC, 27713 | Health Care Providers & Services | Class A Interest | N/A | N/A | 0.1% | 317 | 3,521 | 4,401 | ||||||||||||||||||||||||||||||||||||||||||||||||
| KWOL Acquisition, Inc. (dba Worldwide Clinical Trials)(3)(4)(8)—600 Park Offices Drive, Durham, NC, 27713 | Health Care Providers & Services | First lien senior secured loan | S+ | 5.00% | 12/2029 | 88,879 | 88,274 | 88,656 | ||||||||||||||||||||||||||||||||||||||||||||||||
| Lighthouse Buyer, Inc. (dba Harbor Compliance)(3)(4)(11)—1830 Colonial Village Lane, Lancaster, PA, 17601 | Application Software | First lien senior secured loan | S+ | 4.50% | 12/2031 | 16,986 | 16,795 | 16,794 | ||||||||||||||||||||||||||||||||||||||||||||||||
| Linked Store Cayman Ltd. (dba Nuvemshop)(3)(4)—Alameda Vicente Pinzon, 173 173 - Vila Olimpia, São Paulo, Brazil | Internet & Direct Marketing Retail | Series E Preferred Stock | N/A | N/A | 1.4% | 19,499 | 42,496 | 39,383 | ||||||||||||||||||||||||||||||||||||||||||||||||
| Litera Bidco LLC(3)(4)(8)—550 West Jackson Boulevard, Chicago, IL, 60661 | Diversified Consumer Services | First lien senior secured loan | S+ | 5.00% | 5/2028 | 187,762 | 187,235 | 187,762 | ||||||||||||||||||||||||||||||||||||||||||||||||
| LogRhythm, Inc.(3)(4)(9)—1051 East Hillsdale Boulevard, Foster City, CA, 94404 | Systems Software | First lien senior secured loan | S+ | 7.50% | 7/2029 | 4,750 | 4,642 | 4,548 | ||||||||||||||||||||||||||||||||||||||||||||||||
| LSI Financing 1 DAC(3)(4)—Victoria Building, 1-2 Haddington Rd, Dublin D04 XN32, Ireland | Pharmaceuticals | Specialty finance equity investment | N/A | N/A | 0.0% | $ | 6,748 | 7,043 | 6,657 | |||||||||||||||||||||||||||||||||||||||||||||||
104
| ($ in thousands) Company | Industry | Type of Investment | Interest Rate | Maturity / Dissolution Date | Percentage of Class Held on a Fully Diluted Basis | Principal Number of Shares / Number of Units | Amortized Cost | Fair Value | ||||||||||||||||||||||||||||||||||||||||||||||||
| LSI Financing LLC(3)(5)—1521 Concord Pike, Suite 201, Wilmington, DE 19803 | Pharmaceuticals | Specialty finance equity investment | N/A | N/A | 13.9% | $ | 93,314 | 92,366 | 102,235 | |||||||||||||||||||||||||||||||||||||||||||||||
| Magnet Forensics, LLC (f/k/a Grayshift, LLC)(3)(4)(8)—2220 University Ave E, Waterloo, ON N2K 0A2, Canada | Application Software | First lien senior secured loan | S+ | 4.50% | 7/2028 | 175,008 | 175,081 | 175,008 | ||||||||||||||||||||||||||||||||||||||||||||||||
| ManTech International Corporation(3)(4)(9)—2251 Corporate Park Drive, Herndon, VA, 20171 | Aerospace & Defense | First lien senior secured loan | S+ | 4.50% | 9/2029 | 75,738 | 75,786 | 75,738 | ||||||||||||||||||||||||||||||||||||||||||||||||
| McQueen Bidco PTY LTD. (dba Infomedia)(3)(4)(9)—Level 5, 155 Clarence Street, Sydney NSW 2000 Australia | Specialty Retail | First lien senior secured loan | S+ | 4.50% | 12/2032 | 77,652 | 77,652 | 77,458 | ||||||||||||||||||||||||||||||||||||||||||||||||
| MINDBODY, Inc.(3)(4)(9)—689 Tank Farm Road, San Luis Obispo, CA, 93401 | Hotels, Restaurants & Leisure | First lien senior secured loan | S+ | 6.00 | 9/2027 | 72,962 | 72,816 | 72,962 | ||||||||||||||||||||||||||||||||||||||||||||||||
| Minerva Holdco, Inc.(3)(4)(6)—Boston Landing, Boston, MA, 02135 | Health Care Technology | Senior A Preferred Stock | N/A | 10.75% | N/A | 0.0% | 100,000 | 149,119 | 150,641 | |||||||||||||||||||||||||||||||||||||||||||||||
| Ministry Brands Holdings, LLC(3)(4)(12)—10133 Sherrill Boulevard, Knoxville, TN, 37932 | Application Software | First lien senior secured revolving loan | S+ | 4.50% | 12/2027 | 61 | 57 | 56 | ||||||||||||||||||||||||||||||||||||||||||||||||
| Ministry Brands Holdings, LLC(3)(4)(8)—10133 Sherrill Boulevard, Knoxville, TN, 37932 | Application Software | First lien senior secured loan | S+ | 5.50% | 12/2028 | 8,140 | 8,059 | 8,079 | ||||||||||||||||||||||||||||||||||||||||||||||||
| Minotaur Acquisition, Inc. (dba Inspira Financial)(3)(4)(8)—2001 Spring Road, Oak Brook, IL, 60523 | Diversified Financial Services | First lien senior secured loan | S+ | 5.00% | 6/2030 | 186,614 | 185,817 | 186,614 | ||||||||||||||||||||||||||||||||||||||||||||||||
| ML Holdco, Inc. (dba Meridian Link)(3)(4)(9)—3560 Hyland Avenue, Costa Mesa, CA, 92626 | Diversified Financial Services | First lien senior secured loan | S+ | 4.50% | 10/2032 | 106,139 | 105,622 | 105,608 | ||||||||||||||||||||||||||||||||||||||||||||||||
| Modernizing Medicine, Inc. (dba ModMed)(3)(4)(9)—4700 Exchange Court, Boca Raton, FL, 33431 | Health Care Technology | First lien senior secured loan | S+ | 2.50% | 2.25% | 4/2032 | 147,286 | 145,946 | 146,550 | |||||||||||||||||||||||||||||||||||||||||||||||
| ModMed Software Midco Holdings, Inc. (dba ModMed)(3)(4)(6)—4700 Exchange Court, Boca Raton, FL, 33431 | Health Care Technology | Series A Preferred Units | N/A | 13.00% | N/A | 0.0% | 32,375 | 34,437 | 34,718 | |||||||||||||||||||||||||||||||||||||||||||||||
| Monotype Imaging Holdings Inc.(3)(4)(8)—600 Unicorn Park Drive, Woburn, MA, 01801 | Media | First lien senior secured loan | S+ | 5.25% | 2/2031 | 128,668 | 128,347 | 128,668 | ||||||||||||||||||||||||||||||||||||||||||||||||
| Natural Partners, LLC(3)(4)(9)—360 Albert St, Ottawa, ON K1R 7X7, Canada | Health Care Providers & Services | First lien senior secured loan | S+ | 4.50% | 11/2030 | 21,882 | 21,802 | 21,882 | ||||||||||||||||||||||||||||||||||||||||||||||||
| Neptune Holdings, Inc. (dba NexTech)(3)(4)(9)—4221 West Boy Scout Boulevard, Tampa, FL, 33607 | Health Care Technology | First lien senior secured loan | S+ | 4.50% | 8/2030 | 10,809 | 10,795 | 10,782 | ||||||||||||||||||||||||||||||||||||||||||||||||
| NMI Acquisitionco, Inc. (dba Network Merchants)(3)(4)(8)—1450 American Lane, Schaumburg, IL, 60173 | Diversified Financial Services | First lien senior secured loan | S+ | 4.50% | 9/2028 | 24,106 | 24,079 | 24,106 | ||||||||||||||||||||||||||||||||||||||||||||||||
105
| ($ in thousands) Company | Industry | Type of Investment | Interest Rate | Maturity / Dissolution Date | Percentage of Class Held on a Fully Diluted Basis | Principal Number of Shares / Number of Units | Amortized Cost | Fair Value | ||||||||||||||||||||||||||||||||||||||||||||||||
| Nscale Global Holdings Limited(3)(4)—16 New Burlington Place, London, W1S 2HX, United Kingdom | IT Services | Preferred equity | N/A | N/A | 0.0% | $ | 7,507 | 7,507 | 7,507 | |||||||||||||||||||||||||||||||||||||||||||||||
| Nscale Global Holdings Limited(3)(4)—16 New Burlington Place, London, W1S 2HX, United Kingdom | IT Services | Series B Preferred Shares | N/A | N/A | 0.6% | 13,174 | 5,005 | 5,005 | ||||||||||||||||||||||||||||||||||||||||||||||||
| Nylas, Inc.(4)—944 Market Street, San Francisco, CA, 94102 | Application Software | Series C Preferred Stock | N/A | N/A | 3.1% | 2,088,467 | 15,009 | 1,826 | ||||||||||||||||||||||||||||||||||||||||||||||||
| OECONNECTION LLC(3)(4)(8)—3600 Embassy Parkway, Fairlawn, OH, 44333 | Specialty Retail | First lien senior secured loan | S+ | 4.50% | 12/2032 | 37,471 | 37,284 | 37,285 | ||||||||||||||||||||||||||||||||||||||||||||||||
| One, Inc. Software Corporation(3)(4)(9)—620 Coolidge Drive, Folsom, CA, 95630 | Insurance | First lien senior secured loan | S+ | 4.50% | 12/2032 | 144,280 | 143,565 | 143,559 | ||||||||||||||||||||||||||||||||||||||||||||||||
| OneOncology, LLC(3)(4)(9)—1301 West Colonial Drive, Orlando, FL, 32804 | Health Care Providers & Services | First lien senior secured loan | S+ | 4.75% | 6/2030 | 50,641 | 50,365 | 50,641 | ||||||||||||||||||||||||||||||||||||||||||||||||
| OneOncology, LLC(3)(4)(9)—1301 West Colonial Drive, Orlando, FL, 32804 | Health Care Providers & Services | First lien senior secured delayed draw term loan | S+ | 5.00% | 6/2030 | 13,757 | 13,727 | 13,757 | ||||||||||||||||||||||||||||||||||||||||||||||||
| OneOncology, LLC(3)(4)(9)—1301 West Colonial Drive, Orlando, FL, 32804 | Health Care Providers & Services | First lien senior secured delayed draw term loan | S+ | 4.50% | 6/2030 | 5,735 | 5,655 | 5,652 | ||||||||||||||||||||||||||||||||||||||||||||||||
| Orange Blossom Parent, Inc.(3)(4)—9600 West Bryn Mawr Avenue, Rosemont, IL, 60018 | Health Care Technology | Common Units | N/A | N/A | 0.0% | 16,667 | 1,665 | 1,720 | ||||||||||||||||||||||||||||||||||||||||||||||||
| Pacific BidCo Inc.(3)(4)(10)—Aeschenvorstadt 71, 4051 Basel, Switzerland | Pharmaceuticals | First lien senior secured delayed draw term loan | S+ | 5.75% | 8/2029 | 10,149 | 9,987 | 10,124 | ||||||||||||||||||||||||||||||||||||||||||||||||
| Packaging Coordinators Midco, Inc.(3)(4)(19)—3001 Red Lion Road, Philadelphia, PA, 19114 | Health Care Equipment & Supplies | First lien senior secured delayed draw term loan | S+ | 4.75% | 10/2032 | 16,752 | 16,367 | 16,668 | ||||||||||||||||||||||||||||||||||||||||||||||||
| Packaging Coordinators Midco, Inc.(3)(4)(9)—3001 Red Lion Road, Philadelphia, PA, 19114 | Health Care Equipment & Supplies | First lien senior secured loan | S+ | 4.75% | 10/2032 | 145,305 | 143,580 | 144,579 | ||||||||||||||||||||||||||||||||||||||||||||||||
| Packaging Coordinators Midco, Inc.(3)(4)(9)—3001 Red Lion Road, Philadelphia, PA, 19114 | Health Care Equipment & Supplies | First lien senior secured delayed draw term loan | S+ | 4.50% | 1/2032 | 795 | 776 | 791 | ||||||||||||||||||||||||||||||||||||||||||||||||
| Paradigmatic Holdco LLC (dba Pluralsight)(3)(4)—1500 Solana Boulevard, Westlake, TX, 76262 | IT Services | Common stock | N/A | N/A | 8.3% | 10,119,090 | 26,850 | — | ||||||||||||||||||||||||||||||||||||||||||||||||
| PDI TA Holdings, Inc.(3)(4)(9)—11675 Rainwater Drive, Alpharetta, GA, 30009 | Multiline Retail | First lien senior secured loan | S+ | 5.50% | 2/2031 | 28,693 | 28,396 | 28,326 | ||||||||||||||||||||||||||||||||||||||||||||||||
| Peraton Corp.(3)(9)—1875 Explorer Street, Reston, VA, 20190 | Aerospace & Defense | Second lien senior secured loan | S+ | 7.75% | 2/2029 | 84,551 | 83,925 | 66,212 | ||||||||||||||||||||||||||||||||||||||||||||||||
106
| ($ in thousands) Company | Industry | Type of Investment | Interest Rate | Maturity / Dissolution Date | Percentage of Class Held on a Fully Diluted Basis | Principal Number of Shares / Number of Units | Amortized Cost | Fair Value | ||||||||||||||||||||||||||||||||||||||||||||||||
| PerkinElmer U.S. LLC(3)(4)(8)—710 Bridgeport Avenue, Shelton, CT, 06484 | Health Care Equipment & Supplies | First lien senior secured loan | S+ | 4.75% | 3/2029 | 75,065 | 74,616 | 75,065 | ||||||||||||||||||||||||||||||||||||||||||||||||
| PetVet Care Centers, LLC(3)(4)(8)—One Gorham Island Road, Westport, CT, 06880 | Health Care Providers & Services | First lien senior secured loan | S+ | 6.00% | 11/2030 | 76,930 | 74,767 | 69,237 | ||||||||||||||||||||||||||||||||||||||||||||||||
| PetVet Care Centers, LLC(3)(4)(8)—One Gorham Island Road, Westport, CT, 06880 | Health Care Providers & Services | First lien senior secured revolving loan | S+ | 6.00% | 11/2029 | 1,075 | 809 | — | ||||||||||||||||||||||||||||||||||||||||||||||||
| Pike Corp.(4)(9)—615 South College Street, Charlotte, NC, 28202 | Construction & Engineering | First lien senior secured loan | S+ | 4.50% | 12/2032 | 25,691 | 25,564 | 25,563 | ||||||||||||||||||||||||||||||||||||||||||||||||
| Pluralsight, LLC(3)(4)(9)—1500 Solana Boulevard, Westlake, TX, 76262 | IT Services | First lien senior secured loan | S+ | 3.00% | 1.50% | 8/2029 | 30,795 | 30,795 | 30,180 | |||||||||||||||||||||||||||||||||||||||||||||||
| Pluralsight, LLC(3)(4)(9)—1500 Solana Boulevard, Westlake, TX, 76262 | IT Services | First lien senior secured loan | S+ | 7.50% | 8/2029 | 35,340 | 34,303 | 28,890 | ||||||||||||||||||||||||||||||||||||||||||||||||
| Project Alpine Co-Invest Fund, LP(3)(4)—1450 Brickell Avenue, Miami, FL, 33131 | Application Software | LP Interest | N/A | N/A | 0.2% | $ | 13,333 | 16,381 | 17,509 | |||||||||||||||||||||||||||||||||||||||||||||||
| Project Hotel California Co-Invest Fund, L.P.(3)—11120 Four Points Drive, Austin, TX, 78726 | Systems Software | LP Interest | N/A | N/A | 0.1% | $ | 10,739 | 14,721 | 17,480 | |||||||||||||||||||||||||||||||||||||||||||||||
| Proofpoint, Inc.(3)(4)(14)—925 West Maude Avenue, Sunnyvale, CA, 94085 | Professional Services | Second lien senior secured loan | E+ | 5.75% | 12/2033 | € | 57,750 | 65,250 | 67,824 | |||||||||||||||||||||||||||||||||||||||||||||||
| Proofpoint, Inc.(3)(4)(9)—925 West Maude Avenue, Sunnyvale, CA, 94085 | Professional Services | Second lien senior secured loan | S+ | 5.75% | 12/2033 | 66,014 | 65,354 | 66,014 | ||||||||||||||||||||||||||||||||||||||||||||||||
| Proofpoint, Inc.(3)(9)—925 West Maude Avenue, Sunnyvale, CA, 94085 | Professional Services | First lien senior secured loan | S+ | 3.00% | 8/2028 | 3,135 | 3,127 | 3,148 | ||||||||||||||||||||||||||||||||||||||||||||||||
| QAD, Inc.(3)(4)(8)—101 Innovation Place, Santa Barbara, CA, 93108 | Industrial Conglomerates | First lien senior secured loan | S+ | 4.75% | 11/2027 | 87,260 | 87,260 | 87,260 | ||||||||||||||||||||||||||||||||||||||||||||||||
| RealPage, Inc.(3)(9)—2201 Lakeside Boulevard, Richardson, TX, 75082 | Real Estate Management & Development | First lien senior secured loan | S+ | 3.75% | 4/2028 | 34,738 | 34,594 | 34,814 | ||||||||||||||||||||||||||||||||||||||||||||||||
| Relativity ODA LLC(3)(4)(8)—231 South LaSalle Street, Chicago, IL, 60604 | Diversified Consumer Services | First lien senior secured loan | S+ | 4.50% | 5/2029 | 137,241 | 136,886 | 137,241 | ||||||||||||||||||||||||||||||||||||||||||||||||
| Replicated, Inc.(4)—8605 Santa Monica Boulevard, West Hollywood, CA, 90069 | IT Services | Series C Preferred Stock | N/A | N/A | 4.0% | 1,277,832 | 20,008 | 5,778 | ||||||||||||||||||||||||||||||||||||||||||||||||
| Revolut Ribbit Holdings, LLC(4)—7 Westferry Circus, London E14 4HB, United Kingdom | Diversified Financial Services | LLC Interest | N/A | N/A | <1% | 57,026 | 75,305 | 177,405 | ||||||||||||||||||||||||||||||||||||||||||||||||
| RL Datix Holdings (USA), Inc.(3)(4)(10)—311 South Wacker Drive, Chicago, IL, 60606 | Health Care Technology | First lien senior secured loan | S+ | 5.00% | 4/2031 | 104,855 | 104,856 | 104,855 | ||||||||||||||||||||||||||||||||||||||||||||||||
| RL Datix Holdings (USA), Inc.(3)(4)(19)—311 South Wacker Drive, Chicago, IL, 60606 | Health Care Technology | First lien senior secured GBP term loan | SA+ | 5.00% | 4/2031 | £ | 48,557 | 65,531 | 65,312 | |||||||||||||||||||||||||||||||||||||||||||||||
107
| ($ in thousands) Company | Industry | Type of Investment | Interest Rate | Maturity / Dissolution Date | Percentage of Class Held on a Fully Diluted Basis | Principal Number of Shares / Number of Units | Amortized Cost | Fair Value | ||||||||||||||||||||||||||||||||||||||||||||||||
| Rome Topco Holdings, LLC (dba SimpliSafe)(3)(4)—100 Summer Street, Boston, MA, 02110 | Commercial Services & Supplies | Class A Units | N/A | N/A | 0.0% | 1,157 | 1,157 | 1,157 | ||||||||||||||||||||||||||||||||||||||||||||||||
| Rome Topco Holdings, LLC (dba SimpliSafe)(3)(4)—100 Summer Street, Boston, MA, 02110 | Commercial Services & Supplies | Class B Units | N/A | N/A | 0.0% | 1,156,728 | — | — | ||||||||||||||||||||||||||||||||||||||||||||||||
| Romulus Intermediate Holdings 1 Inc. (dba PetVet Care Centers)(3)(4)(6)—One Gorham Island Road, Westport, CT, 06880 | Health Care Providers & Services | Series A Preferred Stock | N/A | 15.00% | N/A | 0.0% | 8,838 | 11,439 | 9,844 | |||||||||||||||||||||||||||||||||||||||||||||||
| Salinger Bidco Inc. (dba Surgical Information Systems)(3)(4)(9)—8000 Avalon Boulevard, Alpharetta, GA, 30009 | Health Care Technology | First lien senior secured loan | S+ | 5.75% | 8/2031 | 94,453 | 94,319 | 94,453 | ||||||||||||||||||||||||||||||||||||||||||||||||
| Salinger Bidco Inc. (dba Surgical Information Systems)(3)(4)(9)—8000 Avalon Boulevard, Alpharetta, GA, 30009 | Health Care Technology | First lien senior secured revolving loan | S+ | 5.75% | 5/2031 | 762 | 745 | 762 | ||||||||||||||||||||||||||||||||||||||||||||||||
| Saturn Ultimate, Inc.(3)(4)—1180 West Peachtree Street Northwest, Atlanta, GA, 30309 | Application Software | Common stock | N/A | N/A | 2.5% | 5,580,593 | 25,008 | 30,241 | ||||||||||||||||||||||||||||||||||||||||||||||||
| Securonix, Inc.(3)(4)(9)—5080 Spectrum Drive, Addison, TX, 75001 | Systems Software | First lien senior secured loan | S+ | 3.50% | 3.75% | 4/2029 | 41,073 | 38,729 | 37,069 | |||||||||||||||||||||||||||||||||||||||||||||||
| Sensor Technology Topco, Inc. (dba Humanetics)(3)(4)(14)—23300 Haggerty Road, Farmington Hills, MI, 48335 | Professional Services | First lien senior secured EUR term loan | E+ | 6.75% | 5/2028 | € | 11,480 | 12,416 | 13,483 | |||||||||||||||||||||||||||||||||||||||||||||||
| Sensor Technology Topco, Inc. (dba Humanetics)(3)(4)(14)—23300 Haggerty Road, Farmington Hills, MI, 48335 | Professional Services | First lien senior secured EUR delayed draw term loan | E+ | 7.25% | 5/2028 | € | 261 | 283 | 307 | |||||||||||||||||||||||||||||||||||||||||||||||
| Sensor Technology Topco, Inc. (dba Humanetics)(3)(4)(8)—23300 Haggerty Road, Farmington Hills, MI, 48335 | Professional Services | First lien senior secured revolving loan | S+ | 6.50% | 5/2028 | 1,846 | 1,846 | 1,846 | ||||||||||||||||||||||||||||||||||||||||||||||||
| Sensor Technology Topco, Inc. (dba Humanetics)(3)(4)(9)—23300 Haggerty Road, Farmington Hills, MI, 48335 | Professional Services | First lien senior secured loan | S+ | 6.50% | 5/2028 | 67,228 | 67,246 | 67,228 | ||||||||||||||||||||||||||||||||||||||||||||||||
| Sensor Technology Topco, Inc. (dba Humanetics)(3)(4)(9)—23300 Haggerty Road, Farmington Hills, MI, 48335 | Professional Services | First lien senior secured delayed draw term loan | S+ | 6.94% | 5/2028 | 1,287 | 1,287 | 1,287 | ||||||||||||||||||||||||||||||||||||||||||||||||
| Sentinel Buyer Corp. (dba SimpliSafe)(3)(4)(8)—100 Summer Street, Boston, MA, 02110 | Commercial Services & Supplies | First lien senior secured loan | S+ | 5.00% | 11/2032 | 23,856 | 23,621 | 23,618 | ||||||||||||||||||||||||||||||||||||||||||||||||
| Severin Acquisition, LLC (dba PowerSchool)(3)(4)(8)—150 Parkshore Drive, Folsom, CA, 95630 | IT Services | First lien senior secured loan | S+ | 2.50% | 2.25% | 10/2031 | 94,356 | 93,335 | 93,176 | |||||||||||||||||||||||||||||||||||||||||||||||
| Severin Acquisition, LLC (dba PowerSchool)(3)(4)(8)—150 Parkshore Drive, Folsom, CA, 95630 | IT Services | First lien senior secured delayed draw term loan | S+ | 4.75% | 10/2031 | 4,117 | 3,987 | 3,950 | ||||||||||||||||||||||||||||||||||||||||||||||||
108
| ($ in thousands) Company | Industry | Type of Investment | Interest Rate | Maturity / Dissolution Date | Percentage of Class Held on a Fully Diluted Basis | Principal Number of Shares / Number of Units | Amortized Cost | Fair Value | ||||||||||||||||||||||||||||||||||||||||||||||||
| Signifyd Inc.(4)(6)—99 Almaden Boulevard, San Jose, CA, 95113 | Internet & Direct Marketing Retail | Preferred equity | N/A | 9.00% | N/A | 6.6% | 2,755,121 | 151,974 | 156,245 | |||||||||||||||||||||||||||||||||||||||||||||||
| Simpler Postage, Inc. (dba Easypost)(3)(4)—2600 North Ashton Boulevard, Lehi, UT, 84043 | Application Software | Warrants | N/A | N/A | 2.9% | 216,891 | 2,635 | 2,356 | ||||||||||||||||||||||||||||||||||||||||||||||||
| Simpler Postage, Inc. (dba Easypost)(3)(4)(8)—2600 North Ashton Boulevard, Lehi, UT, 84043 | Application Software | First lien senior secured loan | S+ | 8.00% | 6/2029 | 65,114 | 62,838 | 61,381 | ||||||||||||||||||||||||||||||||||||||||||||||||
| Simplicity Financial Marketing Group Holdings, Inc.(3)(4)(9)—86 Summit Avenue, Summit, NJ, 07901 | Insurance | First lien senior secured loan | S+ | 4.75% | 12/2031 | 15,992 | 15,842 | 15,992 | ||||||||||||||||||||||||||||||||||||||||||||||||
| Sitecore Holding III A/S(3)(4)(14)—101 California StreetFloor 16, San Francisco, CA, 94111 | Systems Software | First lien senior secured EUR term loan | E+ | 7.00% | 3/2029 | € | 128,813 | 137,852 | 151,285 | |||||||||||||||||||||||||||||||||||||||||||||||
| Sitecore Holding III A/S(3)(4)(9)—101 California StreetFloor 16, San Francisco, CA, 94111 | Systems Software | First lien senior secured loan | S+ | 7.00% | 3/2029 | 22,333 | 22,294 | 22,333 | ||||||||||||||||||||||||||||||||||||||||||||||||
| Sitecore USA, Inc.(3)(4)(9)—101 California StreetFloor 16, San Francisco, CA, 94111 | Systems Software | First lien senior secured loan | S+ | 7.00 | 3/2029 | 134,589 | 134,351 | 134,589 | ||||||||||||||||||||||||||||||||||||||||||||||||
| SLA Eclipse Co-Invest, L.P.—3601 Walnut Street, Denver, CO, 80205 | Diversified Consumer Services | LP Interest | N/A | N/A | 0.9% | $ | 15,000 | 15,308 | 19,884 | |||||||||||||||||||||||||||||||||||||||||||||||
| Smarsh Inc.(3)(4)(9)—851 South West 6th Avenue, Portland, OR, 97204 | Diversified Financial Services | First lien senior secured revolving loan | S+ | 4.75% | 2/2029 | 90,327 | 90,041 | 89,849 | ||||||||||||||||||||||||||||||||||||||||||||||||
| Sophos Holdings, LLC(3)(8)—Abingdon Science Park, Abingdon OX14 3YP, United Kingdom | Systems Software | First lien senior secured loan | S+ | 3.50% | 3/2027 | 14,464 | 14,481 | 14,462 | ||||||||||||||||||||||||||||||||||||||||||||||||
| Sovos Compliance, LLC(3)(8)—200 Ballardvale Street, Wilmington, MA, 01887 | Professional Services | First lien senior secured loan | S+ | 3.25% | 8/2029 | 19,207 | 19,207 | 19,251 | ||||||||||||||||||||||||||||||||||||||||||||||||
| Space Exploration Technologies Corp.(3)(4)—1 Rocket Road, Hawthorne, CA, 90250 | Aerospace & Defense | Class A Common Stock | N/A | N/A | 0.0% | 419,311 | 23,013 | 162,425 | ||||||||||||||||||||||||||||||||||||||||||||||||
| Space Exploration Technologies Corp.(3)(4)—1 Rocket Road, Hawthorne, CA, 90250 | Aerospace & Defense | Class C Common Stock | N/A | N/A | 0.0% | 84,250 | 4,011 | 32,635 | ||||||||||||||||||||||||||||||||||||||||||||||||
| Spaceship Purchaser, Inc. (dba Squarespace)(3)(4)(9)—225 Varick Street, New York, NY, 10014 | IT Services | First lien senior secured loan | S+ | 3.75% | 10/2031 | 133,270 | 133,270 | 133,270 | ||||||||||||||||||||||||||||||||||||||||||||||||
| Storable Intermediate Holdings, LLC(3)(4)(8)—10900 Research Boulevard, Austin, TX, 78759 | Equity Real Estate Investment Trusts (REITs) | First lien senior secured loan | S+ | 6.00% | 4/2032 | 109,040 | 108,562 | 109,040 | ||||||||||||||||||||||||||||||||||||||||||||||||
| Storable, Inc.(3)(8)—10900 Research Boulevard, Austin, TX, 78759 | Equity Real Estate Investment Trusts (REITs) | First lien senior secured loan | S+ | 3.25% | 4/2031 | 9,926 | 9,894 | 9,964 | ||||||||||||||||||||||||||||||||||||||||||||||||
| Stripe Blue Owl Holdings LLC(3)(5)—399 Park Avenue, 37th Floor, New York, NY 10022 | Joint Venture | LLC Interest | N/A | N/A | 0.0% | $ | 17,493 | 17,493 | 17,493 | |||||||||||||||||||||||||||||||||||||||||||||||
109
| ($ in thousands) Company | Industry | Type of Investment | Interest Rate | Maturity / Dissolution Date | Percentage of Class Held on a Fully Diluted Basis | Principal Number of Shares / Number of Units | Amortized Cost | Fair Value | ||||||||||||||||||||||||||||||||||||||||||||||||
| Sunshine Software Holdings, Inc. (dba Cornerstone OnDemand, Inc.)(3)(4)(6)—1601 Cloverfield Boulevard, Santa Monica, CA, 90404 | Professional Services | Series A Preferred Stock | N/A | 10.50% | N/A | 0.0% | 28,000 | 42,704 | 36,535 | |||||||||||||||||||||||||||||||||||||||||||||||
| Talon MidCo 2 Limited(3)(4)(8)—10 Summer Street, Boston, MA, 02132 | Systems Software | First lien senior secured loan | S+ | 4.93% | 8/2028 | 35,627 | 35,617 | 35,627 | ||||||||||||||||||||||||||||||||||||||||||||||||
| Tamarack Intermediate, L.L.C. (dba Verisk 3E)(3)(4)(9)—3207 Grey Hawk Court, Carlsbad, CA, 92029 | Application Software | First lien senior secured loan | S+ | 5.00% | 3/2029 | 12,927 | 12,799 | 12,927 | ||||||||||||||||||||||||||||||||||||||||||||||||
| Themis Solutions Inc. (dba Clio)(3)(4)(8)—Suite 300 4611 Canada Way, Burnaby, BC V5G, 4X3, Canada | Diversified Consumer Services | First lien senior secured loan | S+ | 1.75% | 3.75% | 10/2032 | 80,606 | 79,822 | 79,800 | |||||||||||||||||||||||||||||||||||||||||||||||
| Thunder Purchaser, Inc. (dba Vector Solutions)(3)(4)(9)—4890 West Kennedy Boulevard, Tampa, FL, 33609 | Professional Services | First lien senior secured loan | S+ | 5.25% | 6/2028 | 138,359 | 137,768 | 138,359 | ||||||||||||||||||||||||||||||||||||||||||||||||
| Thunder Topco L.P. (dba Vector Solutions)(3)(4)—4890 West Kennedy Boulevard, Tampa, FL, 33609 | Professional Services | Common Units | N/A | N/A | 0.7% | 7,857,410 | 7,857 | 9,348 | ||||||||||||||||||||||||||||||||||||||||||||||||
| TK Operations Ltd (dba Travelperk, Inc.)(3)(4)(6)—33 Arch Street, Boston, MA, 02110 | Professional Services | First lien senior secured loan | N/A | 11.50% | 5/2029 | 53,901 | 51,177 | 52,284 | ||||||||||||||||||||||||||||||||||||||||||||||||
| TravelPerk, Inc.(3)(4)—33 Arch Street, Boston, MA, 02110 | Professional Services | Warrants | N/A | N/A | 0.6% | 259,807 | 4,447 | 5,764 | ||||||||||||||||||||||||||||||||||||||||||||||||
| Tricentis Operations Holdings, Inc.(3)(4)(9)—5301 Southwest Parkway, Austin, TX, 78735 | Systems Software | First lien senior secured loan | S+ | 1.38% | 4.88% | 2/2032 | 116,810 | 115,821 | 115,642 | |||||||||||||||||||||||||||||||||||||||||||||||
| Trucordia Insurance Holdings, LLC(3)(4)(8)—2745 West 600 North, Lindon, UT, 84042 | Insurance | Second lien senior secured loan | S+ | 5.75% | 6/2033 | 60,500 | 59,919 | 60,349 | ||||||||||||||||||||||||||||||||||||||||||||||||
| Valeris, Inc. (fka Phantom Purchaser, Inc.)(3)(4)(9)—150 Hilton Drive, Jeffersonville, IN, 47130 | Health Care Providers & Services | First lien senior secured loan | S+ | 5.00% | 9/2031 | 8,820 | 8,806 | 8,820 | ||||||||||||||||||||||||||||||||||||||||||||||||
| Valeris, Inc. (fka Phantom Purchaser, Inc.)(3)(4)(9)—150 Hilton Drive, Jeffersonville, IN, 47130 | Health Care Providers & Services | First lien senior secured loan | S+ | 4.75% | 9/2031 | 15,122 | 14,981 | 15,084 | ||||||||||||||||||||||||||||||||||||||||||||||||
| Valor Compute Infrastructure L.P.(3)(4)—1450 Page Mill Road, Palo Alto, CA, 94304 | Application Software | LP Interest | N/A | N/A | $ | 2,160 | 2,160 | 2,160 | ||||||||||||||||||||||||||||||||||||||||||||||||
| VCI Asset Holdings 1 LLC(3)(4)(6)—1450 Page Mill Road, Palo Alto, CA, 94304 | Application Software | First lien senior secured loan | N/A | 10.00% | 11/2030 | 123,409 | 122,198 | 122,175 | ||||||||||||||||||||||||||||||||||||||||||||||||
| VCI Intermediate TopCo 1 LLC(3)(4)—1450 Page Mill Road, Palo Alto, CA, 94304 | Application Software | Class B Units | N/A | N/A | $ | 6,170 | 6,172 | 6,170 | ||||||||||||||||||||||||||||||||||||||||||||||||
| Veeam Software Group(3)(4)—3000 Carillon Point, Seattle, WA, 98033 | Systems Software | Series C Preferred Shares | N/A | N/A | 0.2% | 7,402,296 | 54,830 | 54,830 | ||||||||||||||||||||||||||||||||||||||||||||||||
110
| ($ in thousands) Company | Industry | Type of Investment | Interest Rate | Maturity / Dissolution Date | Percentage of Class Held on a Fully Diluted Basis | Principal Number of Shares / Number of Units | Amortized Cost | Fair Value | ||||||||||||||||||||||||||||||||||||||||||||||||
| Velocity HoldCo III Inc. (dba VelocityEHS)(3)(4)(9)—222 Merchandise Mart Plaza, Chicago, IL, 60654 | Application Software | First lien senior secured loan | S+ | 5.50% | 5/2029 | 71,497 | 71,490 | 71,497 | ||||||||||||||||||||||||||||||||||||||||||||||||
| VEPF Torreys Aggregator, LLC (dba MINDBODY, Inc.)(3)(4)(6)—689 Tank Farm Road, San Luis Obispo, CA, 93401 | Hotels, Restaurants & Leisure | Series A Preferred Stock | N/A | 12.00 | N/A | 0.0% | 25,000 | 32,661 | 36,988 | |||||||||||||||||||||||||||||||||||||||||||||||
| Vermont Aus Pty Ltd(3)(4)(17)—1 Epping Road, North Ryde, New South Wales, 2113 Australia | Health Care Providers & Services | First lien senior secured AUD term loan | BBSY+ | 4.50% | 3/2028 | A$ | 12,841 | 8,480 | 8,563 | |||||||||||||||||||||||||||||||||||||||||||||||
| Vestwell Holdings Inc.(3)(4)—360 Madison Avenue, New York, NY, 10017 | Professional Services | Series D Preferred Stock | N/A | N/A | 0.5% | 304,350 | 6,022 | 6,646 | ||||||||||||||||||||||||||||||||||||||||||||||||
| Walker Edison Furniture Company LLC(3)(4)(6)—1553 West 9000 South, West Jordan, UT, 84088 | Internet & Direct Marketing Retail | First lien senior secured loan | N/A | 10.00% | 2/2026 | 4,501 | 4,386 | 4,535 | ||||||||||||||||||||||||||||||||||||||||||||||||
| Walker Edison Furniture Company LLC(3)(4)(9)—1553 West 9000 South, West Jordan, UT, 84088 | Internet & Direct Marketing Retail | First lien senior secured loan | S+ | 6.75% | 3/2027 | 15,903 | 11,139 | 154 | ||||||||||||||||||||||||||||||||||||||||||||||||
| Walker Edison Furniture Company LLC(3)(4)(9)—1553 West 9000 South, West Jordan, UT, 84088 | Internet & Direct Marketing Retail | First lien senior secured revolving loan | S+ | 6.25% | 3/2027 | 4,495 | 4,496 | — | ||||||||||||||||||||||||||||||||||||||||||||||||
| Walker Edison Holdco LLC(3)(4)—1553 West 9000 South, West Jordan, UT, 84088 | Internet & Direct Marketing Retail | Common Units | N/A | N/A | 0.0% | 98,319 | 9,500 | — | ||||||||||||||||||||||||||||||||||||||||||||||||
| WMC Bidco, Inc. (dba West Monroe)(3)(4)(6)—222 West Adams Street, Chicago, IL, 60606 | IT Services | Senior Preferred Stock | N/A | 11.25% | N/A | 0.0% | 57,231 | 89,850 | 89,704 | |||||||||||||||||||||||||||||||||||||||||||||||
| WP Irving Co-Invest, L.P.(3)(4)—11511 Reed Hartman Highway, Blue Ash, OH, 45241 | Health Care Technology | Partnership Units | N/A | N/A | 0.0% | 2,500,000 | 1,833 | 3,611 | ||||||||||||||||||||||||||||||||||||||||||||||||
| XOMA Corporation(3)(4)—2200 Powell Street, Emeryville, CA, 94608 | Pharmaceuticals | Warrants | N/A | N/A | 0.0% | 24,000 | 174 | 230 | ||||||||||||||||||||||||||||||||||||||||||||||||
| XPLOR T1, LLC(3)(4)(9)—11330 Olive BoulevardSuite 200, Creve Coeur, MO, 63141 | Application Software | First lien senior secured loan | S+ | 3.50% | 12/2032 | 18,354 | 18,262 | 18,354 | ||||||||||||||||||||||||||||||||||||||||||||||||
| Zendesk, Inc.(3)(4)(9)—181 South Fremont Street, San Francisco, CA, 94105 | Application Software | First lien senior secured loan | S+ | 5.00% | 11/2028 | 168,713 | 167,768 | 168,713 | ||||||||||||||||||||||||||||||||||||||||||||||||
| Zoro TopCo, Inc.(3)(4)(9)—181 South Fremont Street, San Francisco, CA, 94105 | Application Software | Series A Preferred Equity | S+ | 9.50% | N/A | 0.0% | 6,519 | 9,696 | 9,689 | |||||||||||||||||||||||||||||||||||||||||||||||
| Zoro TopCo, L.P.(3)(4)—181 South Fremont Street, San Francisco, CA, 94105 | Application Software | Class A Common Units | N/A | N/A | 0.2% | 1,644,254 | 17,739 | 18,455 | ||||||||||||||||||||||||||||||||||||||||||||||||
Total | $14,132,756 | $14,290,232 | ||||||||||||||||||||||||||||||||||||||||||||||||||||||
____________
(1) - (5) Reserved.
(6)Contains a fixed-rate structure.
(7)Unless otherwise indicated, loan contains a variable rate structure and may be subject to an interest rate floor. Variable rate loans bear interest at a rate that may be determined by reference to either the Secured Overnight Financing Rate (“SOFR” or “S,” which can include one-, three-, six- or twelve-month SOFR), Euro Interbank Offered Rate (“EURIBOR” or “E”, which can include one-, three- or six-month EURIBOR), SONIA (“SONIA” or “SA”), Australian Bank Bill Swap Bid Rate (“BBSY” or “BB”) (which can include one-, three-, or six-month BBSY) or an alternate base rate (which can include the Federal Funds Effective Rate or the Prime Rate), at the borrower’s option, and which reset periodically based on the terms of the loan agreement.
(8)The interest rate on these loans is subject to 1 month SOFR, which as of December 31, 2025 was 3.69%.
(9)The interest rate on these loans is subject to 3 month SOFR, which as of December 31, 2025 was 3.65%.
111
(10)The interest rate on these loans is subject to 6 month SOFR, which as of December 31, 2025 was 3.57%.
(11)The interest rate on these loans is subject to 12 month SOFR, which as of December 31, 2025 was 3.42%.
(12)The interest rate on these loans is subject to Prime, which as of December 31, 2025 was 6.75%.
(13)The interest rate on these loans is subject to 1 month EURIBOR, which as of December 31, 2025 was 1.94%.
(14)The interest rate on these loans is subject to 3 month EURIBOR, which as of December 31, 2025 was 2.03%.
(15)Reserved.
(16)Reserved.
(17)The interest rate on this loan is subject to 3 month BBSY, which as of December 31, 2025 was 3.74%.
(18)Reserved.
(19)The interest rate on these loans is subject to SONIA, which as of December 31, 2025 was 3.73%.
Specialty Financing Portfolio Companies and Joint Ventures
We leverage the expanding role that private lenders are being asked to play in the broader credit markets to evaluate cross-platform opportunities including strategic equity and accretive joint venture investments that have cash flow and credit profiles that provide consistent income.
Specialty Financing Portfolio Companies
Amergin was created to invest in a leasing platform focused on railcar, aviation and other long-lived transportation assets. Amergin acquires existing on-lease portfolios of new and end-of-life railcars and related equipment and selectively purchases off-lease assets and is building a commercial aircraft portfolio through aircraft financing and engine acquisition on a sale and lease back basis. Amergin consists of Amergin AssetCo and Amergin Asset Management LLC, which has entered into a Servicing Agreement with Amergin AssetCo. We made an initial equity commitment to Amergin AssetCo on July 1, 2022. As of December 31, 2025, our commitment to Amergin AssetCo is $62.2 million, of which $24.7 million is equity and $37.5 million is debt. We do not consolidate our equity interest in Amergin AssetCo.
BOCSO was formed to hold alternative credit assets, including asset-based finance (“ABF”). ABF is a subsector of private credit focused on generating income from pools of financial, physical or other assets. We believe exposure to alternative credit presents an attractive opportunity as alternative credit is a growing subsector of private credit. On September 18, 2025, we made an initial equity contribution to BOCSO. As of December 31, 2025, our investment at fair value in BOCSO was $57.7 million and our total commitment was $57.7 million. As of December 31, 2025, the portfolio consists of three investments totaling $0.5 billion at cost and fair value, respectively, ranging in cost from $24.8 million to $304.4 million and with a fair value ranging from $24.8 million to $303.9 million. The largest investment is 62% of the total cost of BOCSO’s portfolio. As of December 31, 2025, the portfolio asset class composition was 62% ABF – Specialty Finance, 33% ABF – Leasing, and 5% ABF – Commercial Real Estate. We do not consolidate our equity interest in BOCSO.
Fifth Season is a portfolio company created to invest in life insurance based assets, including secondary and tertiary life settlement and other life insurance exposures using detailed analytics, internal life expectancy review and sophisticated portfolio management techniques. On July 18, 2022, we made an initial equity investment in Fifth Season. As of December 31, 2025, our investment in Fifth Season was $184.5 million based on fair value. We do not consolidate our interest in Fifth Season.
LSI Financing DAC is a portfolio company formed to acquire contractual rights to revenue pursuant to earnout agreements generally in the life sciences space. On December 14, 2022, we made an initial equity commitment to LSI Financing DAC. As of December 31, 2025, our investment in LSI Financing DAC was $6.7 million based on fair value and our total commitment was $6.7 million. We do not consolidate our equity interest in LSI Financing DAC.
LSI Financing LLC is a separately managed portfolio company formed to indirectly own royalty purchase agreements and loans in the life sciences space. An affiliate of the Adviser provides consulting services to a subsidiary of LSI Financing LLC in exchange for a fee. The Adviser has agreed to waive a portion of the management fee payable by us pursuant to the Investment Advisory Agreement equal to the pro rata amount of such consulting fee. On November 25, 2024, we redeemed a portion of its interest in LSI Financing DAC in exchange for common shares of LSI Financing LLC. As of December 31, 2025, the fair value of our investment in LSI Financing LLC was $102.2 million and our total commitment was $124.4 million. We do not consolidate our equity interest in LSI Financing LLC.
Joint Ventures
On May 6, 2024, Credit SLF, a Delaware limited liability company, was formed as a joint venture between the Credit SLF Members. The Credit SLF Members co-manage Credit SLF. Credit SLF’s principal purpose is to make investments in senior secured loans to middle-market companies, broadly syndicated loans and senior and subordinated notes issued by collateralized loan obligations. Credit SLF is managed by a board consisting of an equal number of representatives appointed by each Credit SLF Member and which acts unanimously. Investment decisions must be approved by Credit SLF’s board. Our investment in Credit SLF is a co-investment made with our affiliates in accordance with the terms of the exemptive relief that we received from the SEC. We do not consolidate our non-controlling interest in Credit SLF.
112
On June 30, 2025, Blue Owl Leasing, a Delaware limited liability company, was formed as a joint venture between the Blue Owl Leasing Members. The Blue Owl Leasing Members co-manage Blue Owl Leasing. Blue Owl Leasing’s principal purpose is to make investments in leases and loans. Investment decisions must be approved by Blue Owl Leasing. Our investment in Blue Owl Leasing is a co-investment made with our affiliates in accordance with the terms of the exemptive relief that we received from the SEC. We do not consolidate our non-controlling interest in Blue Owl Leasing.
Results of Operations
For a discussion of our results for the year ended December 31, 2024, compared to the year ended December 31, 2023, please refer to “Management’s Discussion and Analysis of Financial Condition and Results of Operations” in our Annual Report on Form 10-K, filed with the SEC on March 6, 2025.
The table below represents the operating results for the following periods:
For the Years Ended December 31, | ||||||||||||||||||||
| ($ in thousands) | 2025 | 2024 | $ Change | |||||||||||||||||
| Total Investment Income | $ | 1,145,449 | $ | 684,034 | $ | 461,415 | ||||||||||||||
| Less: Expenses | 625,879 | 298,429 | 327,450 | |||||||||||||||||
| Net Investment Income (Loss) Before Taxes | $ | 519,570 | $ | 385,605 | $ | 133,965 | ||||||||||||||
| Less: Income taxes, including excise taxes | 7,489 | 11,463 | (3,974) | |||||||||||||||||
| Net Investment Income (Loss) After Taxes | $ | 512,081 | $ | 374,142 | $ | 137,939 | ||||||||||||||
| Net change in unrealized gain (loss) | 175,209 | 51,364 | 123,845 | |||||||||||||||||
| Net realized gain (loss) | 33,081 | (106,281) | 139,362 | |||||||||||||||||
| Net Increase (Decrease) in Net Assets Resulting from Operations | $ | 720,371 | $ | 319,225 | $ | 401,146 | ||||||||||||||
Net increase (decrease) in net assets resulting from operations can vary from period to period as a result of various factors, including the level of new investment commitments, expenses, the recognition of realized gains and losses and changes in unrealized appreciation and depreciation on the investment portfolio. For the year ended December 31, 2025, our net asset value per share increased, primarily driven by an increase from net change in unrealized gains.
Investment Income
The table below presents the investment income for the following periods:
| For the Years Ended December 31, | ||||||||||||||||||||
| ($ in thousands) | 2025 | 2024 | $ Change | |||||||||||||||||
| Interest income | $ | 939,380 | $ | 522,106 | $ | 417,274 | ||||||||||||||
| Payment-in-kind interest income | 92,826 | 106,432 | (13,606) | |||||||||||||||||
| Dividend income | 25,649 | 8,714 | 16,935 | |||||||||||||||||
| Payment-in-kind dividend income | 66,657 | 40,370 | 26,287 | |||||||||||||||||
| Other income | 20,937 | 6,412 | 14,525 | |||||||||||||||||
| Total investment income | $ | 1,145,449 | $ | 684,034 | $ | 461,415 | ||||||||||||||
We generate revenues primarily in the form of interest income from the investments we hold. In addition, we may generate income from dividends on either direct equity investments or equity interests obtained in connection with originating loans, such as options, warrants or conversion rights.
Year Ended December 31, 2025 Compared to the Year Ended December 31, 2024
Investment income increased to $1.1 billion for the year ended December 31, 2025, from $684.0 million for the same period in prior year primarily due to an increase in interest income as a result of an increase in our debt portfolio following the Mergers, which at par increased from $5.1 billion as of December 31, 2024 to $12.2 billion as of December 31, 2025. Included in interest income are other fees such as prepayment fees and accelerated amortization of upfront fees from unscheduled paydowns which are non-recurring in nature. Fees received from unscheduled paydowns increased to $23.4 million for the year ended December 31, 2025 from $16.3 million for the same period in prior year due to an increase in repayment activity for the period. Dividend income and PIK dividend income increased to $92.3 million from $49.1 million in the prior period, primarily due to an increase in investments which paid dividends following the Mergers. PIK interest income as a percentage of total investment income decreased to 8.1% for the year ended December 31, 2025 from 15.6% for the year ended December 31, 2024 primarily driven by a decrease in PIK interest earning
113
investments in our portfolio. PIK dividend income as a percentage of total investment income decreased to 5.8% for the year ended December 31, 2025 from 5.9% for the year ended December 31, 2024. Other income increased period-over-period due to an increase in incremental fee income, which are fees that are generally available to us as a result of closing investments and normally paid at the time of closing. We expect that investment income will vary based on a variety of factors including the pace of our originations and repayments.
Expenses
The table below presents our expenses for the following periods:
| For the Years Ended December 31, | ||||||||||||||||||||
| ($ in thousands) | 2025 | 2024 | $ Change | |||||||||||||||||
| Interest expense | $ | 321,492 | $ | 192,739 | $ | 128,753 | ||||||||||||||
Management fees, net(1) | 144,941 | 56,705 | 88,236 | |||||||||||||||||
| Performance based incentive fees | 93,377 | 40,961 | 52,416 | |||||||||||||||||
| Capital gains incentive fees | 37,529 | (5,487) | 43,016 | |||||||||||||||||
| Professional fees | 12,071 | 6,496 | 5,575 | |||||||||||||||||
| Listing advisory fees (net of Adviser reimbursement) | 4,821 | — | 4,821 | |||||||||||||||||
| Directors' fees | 1,091 | 1,034 | 57 | |||||||||||||||||
| Other general and administrative | 10,557 | 5,981 | 4,576 | |||||||||||||||||
| Total expenses | $ | 625,879 | $ | 298,429 | $ | 327,450 | ||||||||||||||
(1)Refer to “Note 3 — Agreements and Related Party Transactions” to our consolidated financial statements included in this Annual Report for additional details on management fee waiver.
Under the terms of the Administration Agreement, we reimburse the Adviser for services performed for us. In addition, pursuant to the terms of the Administration Agreement, the Adviser may delegate its obligations under the Administration Agreement to an affiliate or to a third party and we reimburse the Adviser for any services performed for us by such affiliate or third party.
Year Ended December 31, 2025 Compared to the Year Ended December 31, 2024
Total expenses increased to $625.9 million for the year ended December 31, 2025, from $298.4 million for the same period in the prior year primarily due to an increase in interest expense, management fees, and incentive fees following the Mergers. The increase in interest expense was driven by an increase in average daily borrowings to $4.8 billion from $3.0 billion primarily due to the assumption of OTF II’s debt facilities, offset by a decrease in the average interest rate to 6.0% from 6.1%, period over period. Management fees increased due to an increase in average adjusted gross assets as a result of our acquisition of OTF II and an increase in the management fee rate as a result of the listing. Performance based incentive fees increased due to an increase in net investment income driven by an increase in the size of the income producing portfolio as a result of our acquisition of OTF II and an increase in the incentive fee rate as a result of the listing. As a percentage of total assets, offering expenses, professional fees, directors’ fees and other general and administrative expenses remained relatively consistent.
Income Taxes, Including Excise Taxes
We have elected to be treated as a RIC under subchapter M of the Code, and we intend to operate in a manner so as to continue to qualify for the tax treatment applicable to RICs. To qualify for tax treatment as a RIC, we must, among other things, distribute to our shareholders in each taxable year generally at least the sum of (i) 90% of our investment company taxable income, as defined by the Code, and (ii) 90% of our net tax-exempt income for that taxable year. In addition, a RIC may, in certain cases, satisfy this distribution requirement by distributing dividends relating to a taxable year after the close of such taxable year under the “spillover dividend” provisions of Subchapter M. As of December 31, 2025 we have generated undistributed taxable earnings “spillover” of $0.40 per share. To maintain our tax treatment as a RIC, we, among other things, intend to make the requisite distributions to our shareholders, which generally relieves us from U.S. federal income taxes at corporate tax rates.
Depending on the level of taxable income earned in a tax year, we can be expected to carry forward taxable income (including net capital gains, if any) in excess of current year dividend distributions from the current tax year into the next tax year and pay a nondeductible 4% U.S. federal excise tax on such taxable income, as required. To the extent that we determine that our estimated current year annual taxable income will be in excess of estimated current year dividend distributions from such income, we will accrue excise tax on estimated excess taxable income.
114
For the years ended December 31, 2025 and 2024, we recorded U.S. federal and state corporate-level income tax expense/(benefit) of $7.5 million and $11.5 million, including U.S. federal excise tax expense of $7.5 million and $11.5 million, respectively.
Taxable Subsidiaries
Certain of our consolidated subsidiaries are subject to U.S. federal and state corporate-level income taxes. For the year ended December 31, 2025 and 2024 we recorded U.S. federal and state income tax expense/(benefit) of $(51) thousand and (6) thousand, respectively.
We recorded a net deferred tax liability of $797 thousand as of December 31, 2025, for taxable subsidiaries, which is significantly related to GAAP to tax outside basis differences in the taxable subsidiaries’ investment in certain partnership interests. We recorded a net deferred tax liability of $36 thousand for taxable subsidiaries as of December 31, 2024.
Net Change in Unrealized Gains (Losses)
We fair value our portfolio investments quarterly and any changes in fair value are recorded as unrealized gains or losses. During the following periods, net unrealized gains (losses) were:
| For the Years Ended December 31, | |||||||||||||||||
| ($ in thousands) | 2025 | 2024 | $ Change | ||||||||||||||
| Net change in unrealized gain (loss) on investments | $ | 146,218 | $ | 51,630 | $ | 94,588 | |||||||||||
| Net change in unrealized gain (loss) on translation of assets and liabilities in foreign currencies | 29,693 | (263) | 29,956 | ||||||||||||||
| Income tax (provision) benefit | (702) | (3) | (699) | ||||||||||||||
| Net change in unrealized gain (loss) | $ | 175,209 | $ | 51,364 | $ | 123,845 | |||||||||||
Year Ended December 31, 2025 Compared to the Year Ended December 31, 2024
For the year ended December 31, 2025, the net unrealized gain was primarily driven by an increase in the fair value of certain of our equity investments, partially offset by a decrease in the fair value of certain of our equity investments. As of December 31, 2025, the fair value of our debt investments as a percentage of principal was 99.3%, as compared to 99.0% as of December 31, 2024. For the year ended December 31, 2024, the net unrealized gain was primarily driven by an increase in the fair value of certain of our debt and equity investments and reversals of prior period unrealized losses that were realized during the period related to exited investments.
The ten largest contributors to the change in net unrealized gain (loss) on investments during the period consisted of the following:
| For the Year Ended December 31, 2025 | For the Year Ended December 31, 2024 | |||||||||||||
| Portfolio Company | Net Change in Unrealized Gain (Loss) | Portfolio Company | Net Change in Unrealized Gain (Loss) | |||||||||||
($ in millions) | ($ in millions) | |||||||||||||
| Space Exploration Technologies Corp. | $ | 105.0 | Space Exploration Technologies Corp. | $ | 43.8 | |||||||||
| Revolut Ribbit Holdings, LLC | 71.0 | Revolut Ribbit Holdings, LLC | 39.9 | |||||||||||
| Pluralsight, LLC | (33.2) | Robinhood Markets, Inc. | 33.6 | |||||||||||
| Halo Parent Newco, LLC | (23.9) | Klaviyo, Inc. | 17.0 | |||||||||||
| SalesLoft, Inc. | (17.7) | Peraton Corp. | (15.9) | |||||||||||
| Signifyd Inc. | 17.4 | Walker Edison Furniture Company LLC | (13.5) | |||||||||||
| Excalibur CombineCo, L.P. | (14.2) | Circle Internet Services, Inc. | (13.0) | |||||||||||
| E2Open Parent Holdings, Inc. | 13.1 | Cornerstone OnDemand, Inc. | (11.0) | |||||||||||
| Elliott Alto Co-Investor Aggregator L.P. | 10.8 | Toast, Inc. | (9.7) | |||||||||||
| Inovalon Holdings, Inc. | (10.2) | Algolia, Inc. | (7.6) | |||||||||||
| Remaining portfolio companies | 28.1 | Remaining portfolio companies | (12.0) | |||||||||||
| Total | $ | 146.2 | Total | $ | 51.6 | |||||||||
115
Net Realized Gains (Losses)
The realized gains and losses on fully exited portfolio companies, partially exited portfolio companies and foreign currency transactions during the following periods were:
| For the Years Ended December 31, | |||||||||||||||||
| ($ in thousands) | 2025 | 2024 | $ Change | ||||||||||||||
| Net realized gain (loss) on investments | $ | 54,560 | $ | (104,238) | $ | 158,798 | |||||||||||
| Net realized gain (loss) on foreign currency transactions | (21,479) | (2,043) | (19,436) | ||||||||||||||
| Net realized gain (loss) | $ | 33,081 | $ | (106,281) | $ | 139,362 | |||||||||||
For the year ended December 31, 2025, we recognized net realized gains on investments of $54.6 million, primarily driven by sales of certain of our equity investments. We incurred losses of $21.5 million on foreign currency transactions for the year ended December 31, 2025, primarily as a result of fluctuations in the AUD, GBP and EUR exchange rates versus USD.
Realized Gross Internal Rate of Return
Since we began investing in 2018 through December 31, 2025, our exited investments have resulted in an aggregate cash flow realized gross internal rate of return to us of over 10.5% (based on total capital invested of $7.5 billion and total proceeds from these exited investments of $9.0 billion.
IRR, is a measure of our discounted cash flows (inflows and outflows). Specifically, IRR is the discount rate at which the net present value of all cash flows is equal to zero. That is, IRR is the discount rate at which the present value of total capital invested in each of our investments is equal to the present value of all realized returns from that investment. Our IRR calculations are unaudited.
Capital invested, with respect to an investment, represents the aggregate cost basis allocable to the realized or unrealized portion of the investment, net of any upfront fees paid at closing for the term loan portion of the investment.
Realized returns, with respect to an investment, represents the total cash received with respect to each investment, including all amortization payments, interest, dividends, prepayment fees, upfront fees (except upfront fees paid at closing for the term loan portion of an investment), administrative fees, agent fees, amendment fees, accrued interest, and other fees and proceeds.
Gross IRR, with respect to an investment, is calculated based on the dates that we invested capital and dates we received distributions, regardless of when we made distributions to our shareholders. Initial investments are assumed to occur at time zero.
Gross IRR reflects historical results relating to our past performance and is not necessarily indicative of our future results. In addition, gross IRR does not reflect the effect of management fees, expenses, incentive fees or taxes borne, or to be borne, by us or our shareholders, and would be lower if it did.
Aggregate cash flow realized gross IRR on our exited investments reflects only invested and realized cash amounts as described above, and does not reflect any unrealized gains or losses in our portfolio.
Financial Condition, Liquidity and Capital Resources
Our liquidity and capital resources are generated primarily from cash flows from interest, dividends and fees earned from our investments and principal repayments, our credit facilities, and other secured and unsecured debt. The primary uses of our cash are (i) investments in portfolio companies and other investments and to comply with certain portfolio diversification requirements, (ii) the cost of operations (including paying or reimbursing our Adviser) and (iii) cash distributions to the holders of our shares.
We may from time to time enter into additional credit facilities, increase the size of our existing credit facilities, enter into additional debt securitization transactions or issue additional debt securities. Additional financings could include SPV drop down facilities and unsecured notes. Any such incurrence or issuance would be subject to prevailing market conditions, our liquidity requirements, contractual and regulatory restrictions and other factors. In accordance with the 1940 Act, with certain limited exceptions, we are only allowed to incur borrowings, issue debt securities or issue preferred stock, if immediately after the borrowing or issuance, the ratio of total assets (less total liabilities other than indebtedness) to total indebtedness plus preferred stock, is at least 150%. As of December 31, 2025 and December 31, 2024, our asset coverage was 226% and 220%, respectively. We seek to carefully consider our unfunded commitments for the purpose of planning our ongoing financial leverage. Further, we maintain sufficient borrowing capacity within the 150% asset coverage limitation to cover any outstanding unfunded commitments we are required to fund. Our current target ratio is 0.90x-1.25x. For the year ended December 31, 2025, our weighted average cost of debt was 6.7%. In addition, from time to time, we may seek to retire, repurchase, or exchange debt securities in open market purchases or by other means, including privately negotiated transactions, in each case dependent on market conditions, liquidity, contractual obligations, and other matters. The amounts involved in any such transactions, individually or in the aggregate, may be material.
As of December 31, 2025, cash, taken together with our available debt capacity of $1.45 billion is expected to be sufficient for our investing activities and to conduct our operations in the near term. Our long-term cash needs will include principal payments on
116
outstanding indebtedness and funding of additional portfolio investments. Funding for long-term cash needs will come from unused net proceeds from financing activities and our capital commitments. We believe that our liquidity and sources of capital are adequate to satisfy our short and long-term cash requirements. We cannot, however, be certain that these sources of funds will be available at a time and upon terms acceptable to us in sufficient amounts in the future.
As of December 31, 2025, we had $282.9 million in cash and restricted cash. During the year ended December 31, 2025, $916.0 million in cash was used in operating activities, primarily as a result of funding portfolio investments of $3.8 billion offset by sell downs and repayments of $1.9 billion and other operating activity of $920.0 million. Lastly, cash provided by financing activities was $0.9 billion during the period, primarily from net borrowings on debt.
Equity
We have the authority to issue 1,000,000,000 common shares at $0.01 per share par value.
On March 24, 2025, as a result of the Mergers, we issued an aggregate of approximately 250,738,523 shares of our common stock.
On June 12, 2025, our common stock was listed and began trading on the New York Stock Exchange (“NYSE”) under the symbol “OTF” (the “Exchange Listing”).
In connection with the Exchange Listing, the Board has determined to eliminate any outstanding fractional shares of our common stock (the “Fractional Shares”), as permitted by the Maryland General Corporation Law by rounding up the number of Fractional Shares held by each shareholder to the nearest whole share.
Our amended and restated articles of incorporation (the “Charter”) provides for three separate restricted periods during which shares of our common stock may not be transferred as follows:
•One period is 180 days after the Exchange Listing and applies to all of the shares of our common stock outstanding prior to the Listing (the “First Lock-Up Period”);
•One period is 270 days after the Exchange Listing and applies to two-thirds of the shares of our common stock outstanding prior to the Listing (the “Second Lock-Up Period”); and
•One period is 365 days after the Exchange Listing and applies to one-third of the shares of our common stock outstanding prior to the Listing (the “Third Lock-Up Period”).
In connection with the Exchange Listing, the Board waived the transfer restrictions with respect to 23,256,814 shares of our common stock and a pro rata portion of each shareholder’s shares of our common stock were released from each of the First, Second and Third Lock-Up Periods. Effective as of September 9, 2025, the Board waived the transfer restrictions with respect to 46,513,271 shares of our common stock and a pro rata portion of each shareholder’s shares of our common stock were released from the First Lock-Up Period. On November 4, 2025, the Board waived the transfer restrictions with respect to shares of the Company’s common stock as follows:
Approximate Number of Shares Being Released from Transfer Restrictions | Effective Date | |||||||
50.4 million(1) | November 13, 2025 | |||||||
49.1 million(2) | January 20, 2026 | |||||||
49.1 million(2) | February 20, 2026 | |||||||
49.1 million(3) | April 20, 2026 | |||||||
49.1 million(3) | May 20, 2026 | |||||||
(1)A pro rata portion of each shareholder’s shares of the Company’s common stock will be released from the First Lock-Up Period.
(2)A pro rata portion of each shareholder’s shares of the Company’s common stock will be released from the Second Lock-Up Period.
(3)A pro rata portion of each shareholder’s shares of the Company’s common stock will be released from the Third Lock-Up Period.
Generally, all of the Company’s common stock that has been outstanding for more than six months is eligible for public sale pursuant to Rule 144 under the Securities Act; however, certain affiliates will have to comply with the additional requirements relating to the manner of sale, volume limitation and notice provisions in order to rely on Rule 144.
117
Distributions
The table below reflects the distributions declared on shares of our common stock during the following periods:
For the Year Ended December 31, 2025 | ||||||||||||||||||||
| Date Declared | Record Date | Payment Date | Distribution per Share | |||||||||||||||||
| November 5, 2025 | December 31, 2025 | January 15, 2026 | $ | 0.35 | ||||||||||||||||
| August 5, 2025 | September 30, 2025 | October 15, 2025 | $ | 0.35 | ||||||||||||||||
| June 2, 2025 (supplemental dividend) | September 21, 2026 | October 6, 2026 | $ | 0.05 | ||||||||||||||||
| June 2, 2025 (supplemental dividend) | June 22, 2026 | July 7, 2026 | $ | 0.05 | ||||||||||||||||
| June 2, 2025 (supplemental dividend) | March 23, 2026 | April 7, 2026 | $ | 0.05 | ||||||||||||||||
| June 2, 2025 (supplemental dividend) | December 23, 2025 | January 7, 2026 | $ | 0.05 | ||||||||||||||||
| June 2, 2025 (supplemental dividend) | September 22, 2025 | October 7, 2025 | $ | 0.05 | ||||||||||||||||
| June 2, 2025 | June 30, 2025 | July 15, 2025 | $ | 0.35 | ||||||||||||||||
| March 14, 2025 | March 17, 2025 | March 18, 2025 | $ | 0.34 | ||||||||||||||||
For the Year Ended December 31, 2024 | ||||||||||||||||||||
| Date Declared | Record Date | Payment Date | Distribution per Share | |||||||||||||||||
| October 1, 2024 | December 31, 2024 | January 31, 2025 | $ | 0.33 | ||||||||||||||||
| August 6, 2024 | September 30, 2024 | November 15, 2024 | $ | 0.36 | ||||||||||||||||
| May 7, 2024 | June 28, 2024 | August 15, 2024 | $ | 0.40 | ||||||||||||||||
| February 21, 2024(1) | March 29, 2024 | May 15, 2024 | $ | 0.37 | ||||||||||||||||
(1)Expected to be paid or was partially paid from sources other than ordinary income, including long-term capital gains.
During certain periods, our distributions may exceed our earnings. As a result, it is possible that a portion of the distributions we make may represent a return of capital. A return of capital generally is a return of a shareholder’s investment rather than a return of earnings or gains derived from our investment activities. Each year, a statement on Form 1099-DIV identifying the tax character of the distributions will be mailed to our shareholders. The tax character of the distributions are not determined until our taxable year end.
Dividend Reinvestment
We have adopted a dividend reinvestment plan, pursuant to which, we will reinvest all cash distributions declared by the Board on behalf of our shareholders who do not elect to receive their distribution in cash as provided below. As a result, if the Board authorizes, and we declare, a cash dividend or other distribution, then our shareholders who have not opted out of our dividend reinvestment plan will have their cash distributions automatically reinvested in additional shares of our common stock rather than receiving the cash dividend or other distribution. As described below, we may purchase shares in the open market or use newly issued shares to implement the dividend reinvestment plan. Any fractional share otherwise issuable to a participant in the dividend reinvestment plan will instead be paid in cash.
Prior to the Exchange Listing, the number of shares to be issued to a shareholder under the dividend reinvestment plan was determined by dividing the total dollar amount of the distribution payable to such shareholder by the net asset value per share of the Company’s common stock, as of the last day of the Company’s calendar quarter immediately preceding the date such distribution was declared. In connection with listing our common stock on the NYSE, we entered into our second amended and restated dividend reinvestment plan, pursuant to which, if newly issued shares are used to implement the dividend reinvestment plan, the number of shares to be issued to a shareholder will be determined by dividing the total dollar amount of the cash dividend or distribution payable to a shareholder by the market price per share of our common stock at the close of regular trading on the NYSE on the payment date of a distribution, or if no sale is reported for such day, the average of the reported bid and ask prices. However, if the market price per share on the payment date of a cash dividend or distribution exceeds the most recently computed net asset value per share, we will issue shares at the greater of (i) the most recently computed net asset value per share and (ii) 95% of the current market price per share (or such lesser discount to the current market price per share that still exceeded the most recently computed net asset value per share). Pursuant to our second amended and restated dividend reinvestment plan, if shares are purchased in the open market to implement the dividend reinvestment plan, the number of shares to be issued to a shareholder shall be determined by dividing the dollar amount of the cash dividend payable to such shareholder by the weighted average price per share for all shares purchased by the plan administrator in the open market in connection with the dividend. Shareholders who receive distributions in the form of shares of common stock will be subject to the same U.S. federal, state and local tax consequences as if they received cash distributions.
118
The table below reflects the common stock issued pursuant to the dividend reinvestment plan during the following periods:
For the Year Ended December 31, 2025 | ||||||||||||||||||||
| Date Declared | Record Date | Payment Date | Shares | |||||||||||||||||
| August 5, 2025 | September 30, 2025 | October 15, 2025 | 1,885,921 | |||||||||||||||||
| June 2, 2025 (supplemental dividend) | September 22, 2025 | October 7, 2025 | 275,099 | |||||||||||||||||
| June 2, 2025 | June 30, 2025 | July 15, 2025 | 1,952,428 | |||||||||||||||||
| March 14, 2025 | March 17, 2025 | March 18, 2025 | 1,131,018 | |||||||||||||||||
| October 1, 2024 | December 31, 2024 | January 31, 2025 | 1,098,294 | |||||||||||||||||
For the Year Ended December 31, 2024 | ||||||||||||||||||||
| Date Declared | Record Date | Payment Date | Shares | |||||||||||||||||
| August 6, 2024 | September 30, 2024 | November 15, 2024 | 1,176,276 | |||||||||||||||||
| May 7, 2024 | June 28, 2024 | August 15, 2024 | 1,323,864 | |||||||||||||||||
| February 21, 2024 | March 29, 2024 | May 15, 2024 | 1,190,189 | |||||||||||||||||
| November 7, 2023 | December 29, 2023 | January 31, 2024 | 1,212,560 | |||||||||||||||||
2025 Stock Repurchase Program
On May 27, 2025, the Board approved the 2025 Stock Repurchase Program (the “2025 Stock Repurchase Program”) under which we may repurchase up to $200 million of its outstanding common stock. Under the 2025 Stock Repurchase Program, purchases may be made at management's discretion from time to time in open-market transactions, in accordance with applicable securities laws and regulations. Unless extended by the Board, the 2025 Stock Repurchase Program will terminate 18-months from the date of the Exchange Listing. As of December 31, 2025, 5,192,408 shares of our common stock have been repurchased pursuant to the 2025 Stock Repurchase Program for approximately $73.4 million since the 2025 Stock Repurchase Program’s inception.
Debt
Aggregate Borrowings
The tables below present debt obligations as of the following periods(4):
| December 31, 2025 | |||||||||||||||||||||||||||||
| ($ in thousands) | Aggregate Principal Committed | Outstanding Principal | Amount Available(1) | Unamortized Debt Issuance Costs (Premium) | Net Carrying Value | ||||||||||||||||||||||||
Revolving Credit Facility(2) | $ | 2,675,000 | $ | 1,480,000 | $ | 1,191,983 | $ | 23,718 | $ | 1,456,282 | |||||||||||||||||||
| SPV Asset Facility I | 700,000 | 700,000 | — | 8,398 | 691,602 | ||||||||||||||||||||||||
| SPV Asset Facility II | 400,000 | 325,000 | 75,000 | 4,536 | 320,464 | ||||||||||||||||||||||||
| SPV Asset Facility III | 1,100,000 | 624,500 | 64,924 | 11,413 | 613,087 | ||||||||||||||||||||||||
| SPV Asset Facility IV | 500,000 | 200,000 | 116,062 | 5,654 | 194,346 | ||||||||||||||||||||||||
| Athena CLO II | 375,000 | 375,000 | — | 3,932 | 371,068 | ||||||||||||||||||||||||
| Athena CLO IV | 240,000 | 240,000 | — | 2,346 | 237,654 | ||||||||||||||||||||||||
| Athena CLO V | 300,000 | 300,000 | — | 1,928 | 298,072 | ||||||||||||||||||||||||
| June 2026 Notes | 375,000 | 375,000 | — | 713 | 374,287 | ||||||||||||||||||||||||
| January 2027 Notes | 300,000 | 300,000 | — | 1,621 | 298,379 | ||||||||||||||||||||||||
March 2028 Notes(3) | 650,000 | 650,000 | — | 7,811 | 654,890 | ||||||||||||||||||||||||
| September 2028 Notes | 75,000 | 75,000 | — | 495 | 74,505 | ||||||||||||||||||||||||
April 2029 Notes(3) | 700,000 | 700,000 | — | 11,558 | 703,564 | ||||||||||||||||||||||||
| Total Debt | $ | 8,390,000 | $ | 6,344,500 | $ | 1,447,969 | $ | 84,123 | $ | 6,288,200 | |||||||||||||||||||
(1)The amount available reflects any limitations related to each credit facility’s borrowing base.
(2)The amount available is reduced by $3.0 million of outstanding letters of credit.
(3)Net carrying value is inclusive of change in fair market value of effective hedge.
(4)Refer to “Note 5 — Debt” to our consolidated financial statements included in this Annual Report for more information on our present debt obligations.
119
| December 31, 2024 | |||||||||||||||||||||||||||||
| ($ in thousands) | Aggregate Principal Committed | Outstanding Principal | Amount Available(1) | Unamortized Debt Issuance Costs (Premium) | Net Carrying Value | ||||||||||||||||||||||||
| Revolving Credit Facility | $ | 1,065,000 | $ | 313,004 | $ | 751,996 | $ | 14,675 | $ | 298,329 | |||||||||||||||||||
| SPV Asset Facility I | 700,000 | 600,000 | 100,000 | 9,552 | 590,448 | ||||||||||||||||||||||||
| SPV Asset Facility II | 400,000 | 300,000 | 100,000 | 4,753 | 295,247 | ||||||||||||||||||||||||
| June 2025 Notes | 210,000 | 210,000 | — | 623 | 209,377 | ||||||||||||||||||||||||
| December 2025 Notes | 650,000 | 650,000 | — | (1,495) | 651,495 | ||||||||||||||||||||||||
| June 2026 Notes | 375,000 | 375,000 | — | 2,227 | 372,773 | ||||||||||||||||||||||||
| January 2027 Notes | 300,000 | 300,000 | — | 3,145 | 296,855 | ||||||||||||||||||||||||
| CLO 2020-1 | 204,000 | 204,000 | — | 4,015 | 199,985 | ||||||||||||||||||||||||
| Total Debt | $ | 3,904,000 | $ | 2,952,004 | $ | 951,996 | $ | 37,495 | $ | 2,914,509 | |||||||||||||||||||
(1)The amount available reflects any collateral related limitations at the Company level related to each credit facility’s borrowing base.
The table below presents the components of interest expense for the following periods:
| For the Years Ended December 31, | |||||||||||
| ($ in thousands) | 2025 | 2024 | |||||||||
| Interest expense | $ | 293,568 | $ | 183,481 | |||||||
| Amortization of debt issuance costs, net | 27,061 | 9,258 | |||||||||
Net change in unrealized (gain) loss on effective interest rate swaps and hedged items(1) | 863 | — | |||||||||
| Total Interest Expense | $ | 321,492 | $ | 192,739 | |||||||
| Average interest rate | 6.0 | % | 6.1 | % | |||||||
| Average daily borrowings | $ | 4,810,826 | $ | 2,961,574 | |||||||
(1)Refer to “Note 5 — Debt — March 2028 Notes and April 2029 Notes” to our consolidated financial statements included in this Annual Report for details on the facility’s interest rate swap.
Off-Balance Sheet Arrangements
Portfolio Company Commitments
From time to time, we may enter into commitments to fund investments in the form of revolving credit, delayed draw, or equity commitments, which require us to provide funding when requested by portfolio companies in accordance with underlying loan agreements. We had the following outstanding commitments as of the following periods:
As of | ||||||||||||||
| ($ in thousands) | December 31, 2025 | December 31, 2024 | ||||||||||||
| Total unfunded revolving loan commitments | $ | 797,118 | $ | 315,345 | ||||||||||
| Total unfunded delayed draw loan commitments | $ | 947,440 | $ | 286,912 | ||||||||||
| Total unfunded debt commitments | $ | 1,744,558 | $ | 602,257 | ||||||||||
| Total unfunded specialty finance equity commitments | $ | 41,900 | $ | 6,080 | ||||||||||
| Total unfunded common equity commitments | $ | 8,113 | $ | — | ||||||||||
| Total unfunded equity commitments | $ | 50,013 | $ | 6,080 | ||||||||||
| Total unfunded commitments | $ | 1,794,571 | $ | 608,337 | ||||||||||
We seek to carefully consider our unfunded portfolio company commitments for the purpose of planning our ongoing financial leverage. Further, we consider any outstanding unfunded portfolio company commitments we are required to fund within the 150% asset coverage limitation. As of December 31, 2025, we believed we had adequate financial resources to satisfy the unfunded portfolio company commitments.
Other Commitments and Contingencies
On May 27, 2025, our Board approved a repurchase program (the “2025 Stock Repurchase Program”) under which we may repurchase up to $200 million of our outstanding common stock. Under the 2025 Stock Repurchase Program, purchases were made at
120
management's discretion from time to time in open-market transactions, in accordance with applicable securities laws and regulations. Unless extended by the Board, the 2025 Stock Repurchase Program will terminate 18-months from the date of the Exchange Listing. As of December 31, 2025, 5,192,408 shares of the Company’s common stock have been repurchased pursuant to the 2025 Stock Repurchase Program for approximately $73.4 million since the 2025 Stock Repurchase Program’s inception. All shares purchased by us pursuant to 2025 Stock Repurchase Program have been retired and are authorized and unissued shares.
From time to time, we may become a party to certain legal proceedings incidental to the normal course of our business. At December 31, 2025, management was not aware of any pending or threatened litigation.
Contractual Obligations
A summary of our contractual payment obligations under our credit facilities and notes as of December 31, 2025, is as follows:
| Payments Due by Period | |||||||||||||||||||||||||||||
| ($ in thousands) | Total | Less than 1 year | 1-3 years | 3-5 years | After 5 years | ||||||||||||||||||||||||
| Revolving Credit Facility | $ | 1,480,000 | $ | — | $ | — | $ | 1,480,000 | $ | — | |||||||||||||||||||
| SPV Asset Facility I | 700,000 | — | — | — | 700,000 | ||||||||||||||||||||||||
| SPV Asset Facility II | 325,000 | — | — | 325,000 | — | ||||||||||||||||||||||||
| SPV Asset Facility III | 624,500 | — | — | — | 624,500 | ||||||||||||||||||||||||
| SPV Asset Facility IV | 200,000 | — | — | 200,000 | — | ||||||||||||||||||||||||
| Athena CLO II | 375,000 | — | — | — | 375,000 | ||||||||||||||||||||||||
| Athena CLO IV | 240,000 | — | — | — | 240,000 | ||||||||||||||||||||||||
| Athena CLO V | 300,000 | — | — | — | 300,000 | ||||||||||||||||||||||||
| June 2026 Notes | 375,000 | 375,000 | — | — | — | ||||||||||||||||||||||||
| January 2027 Notes | 300,000 | — | 300,000 | — | — | ||||||||||||||||||||||||
| March 2028 Notes | 650,000 | — | 650,000 | — | — | ||||||||||||||||||||||||
| September 2028 Notes | 75,000 | — | 75,000 | — | — | ||||||||||||||||||||||||
| April 2029 Notes | 700,000 | — | — | 700,000 | — | ||||||||||||||||||||||||
| Total Contractual Obligations | $ | 6,344,500 | $ | 375,000 | $ | 1,025,000 | $ | 2,705,000 | $ | 2,239,500 | |||||||||||||||||||
Related-Party Transactions
We have entered into a number of business relationships with affiliated or related parties, including the following:
•the Investment Advisory Agreement;
•the Administration Agreement; and
•the License Agreement.
In addition to the aforementioned agreements, we, our Adviser and certain of our Adviser’s affiliates have been granted exemptive relief by the SEC to co-invest with other funds managed by the Adviser or certain affiliates, in a manner consistent with our investment objective, positions, policies, strategies and restrictions as well as regulatory requirements and other pertinent factors.
Additionally, we invest in Credit SLF, Blue Owl Leasing, and Stripe Blue Owl Holdings LLC (“Stripe Blue Owl”), controlled affiliated investments, and Amergin, BOCSO, Fifth Season, LSI Financing DAC, and LSI Financing LLC, which are non-controlled affiliated investments, as defined in the 1940 Act.
See “Note 3 —Agreements and Related Party Transactions” to our consolidated financial statements included in this Annual Report for further details.
Critical Accounting Policies
The preparation of the consolidated financial statements requires us to make estimates and assumptions that affect the reported amounts of assets, liabilities, revenues and expenses. Changes in the economic environment, financial markets, and any other parameters used in determining such estimates could cause actual results to differ. Our critical accounting policies should be read in connection with our risk factors as described in “ITEM 1A. RISK FACTORS.”
Investments at Fair Value
Investment transactions are recorded on the trade date. Realized gains or losses are measured by the difference between the net proceeds received (excluding prepayment fees, if any) and the amortized cost basis of the investment using the specific identification method without regard to unrealized gains or losses previously recognized, and include investments charged off during the period, net
121
of recoveries. The net change in unrealized gains or losses primarily reflects the change in investment values, including the reversal of previously recorded unrealized gains or losses with respect to investments realized during the period.
Rule 2a-5 under the 1940 Act establishes requirements for determining fair value in good faith for purposes of the 1940 Act. Pursuant to Rule 2a-5, the Board designated the Adviser as our valuation designee to perform fair value determinations relating to the value of assets held by us for which market quotations are not readily available.
Investments for which market quotations are readily available are typically valued at the average bid price of those market quotations. To validate market quotations, we utilize a number of factors to determine if the quotations are representative of fair value, including the source and number of the quotations. Debt and equity securities that are not publicly traded or whose market prices are not readily available, as is the case for substantially all of our investments, are valued at fair value as determined in good faith by our Adviser, as the valuation designee, based on, among other things, the input of independent third-party valuation firm(s) engaged at the direction of our Adviser.
As part of the valuation process, our Adviser, as the valuation designee, takes into account relevant factors in determining the fair value of our investments, including: the estimated enterprise value of a portfolio company (i.e., the total fair value of the portfolio company’s debt and equity), the nature and realizable value of any collateral, the portfolio company’s ability to make payments based on its earnings and cash flow, the markets in which the portfolio company does business, a comparison of the portfolio company’s securities to any similar publicly traded securities, and overall changes in the interest rate environment and the credit markets that may affect the price at which similar investments may be made in the future. When an external event such as a purchase transaction, public offering or subsequent equity sale occurs, the Adviser, as the valuation designee, considers whether the pricing indicated by the external event corroborates its valuation.
Our Adviser, as the valuation designee, undertakes a multi-step valuation process, which includes, among other procedures, the following:
•With respect to investments for which market quotations are readily available, those investments will typically be valued at the average bid price of those market quotations;
•With respect to investments for which market quotations are not readily available, the valuation process begins with the independent valuation firm(s) providing a preliminary valuation of each investment to the Adviser’s valuation committee;
•Preliminary valuation conclusions are documented and discussed with the Adviser’s valuation committee;
•Our Adviser, as the valuation designee, reviews the recommended valuations and determines the fair value of each investment;
•Each quarter, our Adviser, as the valuation designee, provides the Audit Committee a summary or description of material fair value matters that occurred in the prior quarter and on an annual basis, our Adviser, as the valuation designee, will provide the Audit Committee with a written assessment of the adequacy and effectiveness of its fair value process; and
•The Audit Committee oversees the valuation designee and will report to the Board on any valuation matters requiring the Board’s attention.
We conduct this valuation process on a quarterly basis.
We apply Financial Accounting Standards Board Accounting Standards Codification 820, Fair Value Measurements (“ASC 820”), as amended, which establishes a framework for measuring fair value in accordance with U.S. GAAP and required disclosures of fair value measurements. ASC 820 determines fair value to be the price that would be received for an investment in a current sale, which assumes an orderly transaction between market participants on the measurement date. Market participants are defined as buyers and sellers in the principal or most advantageous market (which may be a hypothetical market) that are independent, knowledgeable, and willing and able to transact. In accordance with ASC 820, we consider its principal market to be the market that has the greatest volume and level of activity. ASC 820 specifies a fair value hierarchy that prioritizes and ranks the level of observability of inputs used in determination of fair value. In accordance with ASC 820, these levels are summarized below:
•Level 1 – Valuations based on quoted prices in active markets for identical assets or liabilities that we have the ability to access.
•Level 2 – Valuations based on quoted prices in markets that are not active or for which all significant inputs are observable, either directly or indirectly.
•Level 3 – Valuations based on inputs that are unobservable and significant to the overall fair value measurement.
Transfers between levels, if any, are recognized at the beginning of the quarter in which the transfer occurred. In addition to using the above inputs in investment valuations, we apply the valuation policy approved by our Board that is consistent with ASC 820. Consistent with the valuation policy, our Adviser, as the valuation designee, evaluates the source of the inputs, including any markets in which our investments are trading (or any markets in which securities with similar attributes are trading), in determining fair value. When an investment is valued based on prices provided by reputable dealers or pricing services (that is, broker quotes), our Adviser,
122
as the valuation designee, subjects those prices to various criteria in making the determination as to whether a particular investment would qualify for treatment as a Level 2 or Level 3 investment. For example, our Adviser, as the valuation designee, or the independent valuation firm(s), review pricing support provided by dealers or pricing services in order to determine if observable market information is being used, versus unobservable inputs.
We apply the practical expedient provided by the ASC Topic 820 relating to investments in certain entities that calculate net asset value per share (or its equivalent). ASC Topic 820 permits an entity holding investments in certain entities that either are investment companies, or have attributes similar to an investment company, and calculate NAV per share or its equivalent for which the fair value is not readily determinable, to measure the fair value of such investments on the basis of that NAV per share, or its equivalent, without adjustment. Investments which are valued using NAV per share as a practical expedient are not categorized within the fair value hierarchy as per ASC Topic 820.
Due to the inherent uncertainty of determining the fair value of investments that do not have a readily available market value, the fair value of our investments may fluctuate from period to period. Additionally, the fair value of such investments may differ significantly from the values that would have been used had a ready market existed for such investments and may differ materially from the values that may ultimately be realized. Further, such investments are generally less liquid than publicly traded securities and may be subject to contractual and other restrictions on resale. If we were required to liquidate a portfolio investment in a forced or liquidation sale, it could realize amounts that are different from the amounts presented and such differences could be material.
In addition, changes in the market environment and other events that may occur over the life of the investments may cause the gains or losses ultimately realized on these investments to be different than the unrealized gains or losses reflected herein.
Financial and Derivative Instruments
Rule 18f-4 requires BDCs that use derivatives to, among other things, comply with a value-at-risk leverage limit, adopt a derivatives risk management program, and implement certain testing and board reporting procedures. Rule 18f-4 exempts BDCs that qualify as “limited derivatives users” from the aforementioned requirements, provided that these BDCs adopt written policies and procedures that are reasonably designed to manage the BDC’s derivatives risks and comply with certain recordkeeping requirements. Rule 18f-4 provides that a BDC may enter into an unfunded commitment agreement that is not a derivatives transaction, such as an agreement to provide financing to a portfolio company, if the BDC has, among other things, a reasonable belief, at the time it enters into such an agreement, that it will have sufficient cash and cash equivalents to meet its obligations with respect to all of its unfunded commitment agreements, in each case as it becomes due. Pursuant to Rule 18f-4, when we trade reverse repurchase agreements or similar financing transactions, including certain tender option bonds, we need to aggregate the amount of any other senior securities representing indebtedness (e.g., bank borrowings, if applicable) when calculating our asset coverage ratio. We currently qualify as a “limited derivatives user” and expect to continue to do so. We adopted a derivatives policy and comply with Rule 18f-4’s recordkeeping requirements.
Interest and Dividend Income Recognition
Interest income is recorded on the accrual basis and includes amortization and accretion of discounts or premiums. Certain investments may have contractual payment-in-kind (“PIK”) interest or dividends, the majority of which is structured at initial underwriting. PIK interest and dividends represent accrued interest or dividends that are added to the principal amount or liquidation amount of the investment on the respective interest or dividend payment dates rather than being paid in cash and generally become due at maturity or at the occurrence of a liquidation event. Discounts and premiums to par value on securities purchased are amortized into interest income over the contractual life of the respective security using the effective yield method. The amortized cost of investments represents the original cost adjusted for the amortization and accretion of discounts or premiums, if any. Upon prepayment of a loan or debt security, any prepayment premiums, unamortized upfront loan origination fees and unamortized discounts are recorded as interest income in the current period.
Loans are generally placed on non-accrual status when there is reasonable doubt that principal or interest will be collected in full. Accrued interest is generally reversed when a loan is placed on non-accrual status. Interest payments received on non-accrual loans may be recognized as income or applied to principal depending upon management’s judgment regarding collectability. If, at any point, we believe PIK interest is not expected to be realized, the investment generating PIK interest will be placed on non-accrual status. When a PIK investment is placed on non-accrual status, the accrued, uncapitalized interest or dividends are generally reversed through interest income. Non-accrual loans are restored to accrual status when past due principal and interest is paid current and, in management’s judgment, are likely to remain current. Management may make exceptions to this treatment and determine to not place a loan on non-accrual status if the loan has sufficient collateral value and is in the process of collection.
Dividend income on preferred equity securities is recorded on the accrual basis to the extent that such amounts are payable by the portfolio company and are expected to be collected. Dividend income on common equity securities is recorded on the record date for private portfolio companies or on the ex-dividend date for publicly-traded portfolio companies.
123
Distributions
We have elected to be treated for U.S. federal income tax purposes, and qualify annually thereafter, as a RIC under subchapter M of the Code. To maintain our tax treatment as a RIC, we must timely distribute (or be deemed to distribute) in each taxable year to our shareholders at least the sum of:
•90% of our investment company taxable income (which is generally our ordinary income plus the excess of realized short-term capital gains over realized net long-term capital losses), determined without regard to the deduction for dividends paid, for such taxable year; and
•90% of our net tax-exempt interest income (which is the excess of our gross tax-exempt interest income over certain disallowed deductions) for such taxable year.
As a RIC, we (but not our shareholders) generally will not be subject to U.S. federal tax on investment company taxable income and net capital gains that we distribute to our shareholders.
We intend to distribute annually all or substantially all of such income. To the extent that we retain our net capital gains or any investment company taxable income, we generally will be subject to U.S. federal income tax at corporate rates. We can be expected to carry forward our net capital gains or any investment company taxable income in excess of current year dividend distributions, and pay the U.S. federal excise tax as described below.
Amounts not distributed on a timely basis in accordance with a calendar year distribution requirement are subject to a nondeductible 4% U.S. federal excise tax payable by us. We may be subject to a nondeductible 4% U.S. federal excise tax if we do not distribute (or are treated as distributing) during each calendar year an amount at least equal to the sum of:
•98% of our net ordinary income excluding certain ordinary gains or losses for that calendar year;
•98.2% of our capital gain net income, adjusted for certain ordinary gains and losses, recognized for the twelve-month period ending on October 31 of that calendar year; and
•certain undistributed amounts from previous years in which we paid no U.S. federal income tax.
While we intend to distribute any income and capital gains in the manner necessary to minimize imposition of the 4% U.S. federal excise tax, sufficient amounts of our taxable income and capital gains may not be distributed and as a result, in such cases, the excise tax will be imposed. In such an event, we will be liable for this tax only on the amount by which we do not meet the foregoing distribution requirement.
We intend to pay quarterly distributions to our shareholders out of assets legally available for distribution. All distributions will be paid at the discretion of our Board and will depend on our earnings, financial condition, maintenance of our tax treatment as a RIC, compliance with applicable BDC regulations and such other factors as our Board may deem relevant from time to time.
To the extent our current taxable earnings for a year fall below the total amount of our distributions for that year, a portion of those distributions may be deemed a return of capital to our shareholders for U.S. federal income tax purposes. Thus, the source of a distribution to our shareholders may be the original capital invested by the shareholder rather than our income or gains. Shareholders should read written disclosure carefully and should not assume that the source of any distribution is our ordinary income or gains.
We have adopted an “opt out” dividend reinvestment plan for our common shareholders. As a result, if we declare a cash dividend or other distribution, each shareholder that has not “opted out” of our dividend reinvestment plan will have their dividends or distributions automatically reinvested in additional shares of our common stock rather than receiving cash distributions. Shareholders who receive distributions in the form of shares of common stock will be subject to the same U.S. federal, state and local tax consequences as if they received cash distributions.
Income Taxes
We have elected to be treated as a BDC under the 1940 Act. We have also elected to be treated as a RIC under the Code beginning with the taxable year ending December 31, 2018 and intend to continue to qualify as a RIC. So long as we maintain our tax treatment as a RIC, we generally will not pay U.S. federal income taxes on any ordinary income or capital gains that we distribute at least annually to our shareholders as dividends. Instead, any tax liability related to income earned and distributed by us represents obligations of our investors and will not be reflected in our consolidated financial statements. However, we will be subject to U.S. federal income tax imposed at corporate rates on any income, including capital gains, not distributed (or deemed distributed) to our stockholders.
To qualify as a RIC, we must, among other things, meet certain source-of-income and asset diversification requirements. In addition, to qualify for RIC tax treatment, we generally must distribute to our shareholders, for each taxable year, at least (i) 90% of our “investment company taxable income” for that year, which is generally our net ordinary income plus the excess, if any, of our realized net short-term capital gains over our realized net long-term capital losses and (ii) our net tax-exempt income. In order for us not to be subject to U.S. federal excise taxes, we must distribute annually an amount at least equal to the sum of (i) 98% of our net ordinary income (taking into account certain deferrals and elections) for the calendar year, (ii) 98.2% of our capital gains in excess of capital losses for the one-year period ending on October 31 of the calendar year and (iii) certain undistributed amounts from previous
124
years on which we paid no U.S. federal income tax. We, at our discretion, may carry forward taxable income in excess of calendar year dividends and pay a 4% nondeductible U.S. federal excise tax on this income.
Certain of our consolidated subsidiaries are subject to U.S. federal and state income taxes imposed at corporate rates.
We evaluate tax positions taken or expected to be taken in the course of preparing our consolidated financial statements to determine whether the tax positions are “more-likely-than-not” to be sustained by the applicable tax authority. Tax positions not deemed to meet the “more-likely-than-not” threshold are reserved and recorded as a tax benefit or expense in the current year. All penalties and interest associated with income taxes are included in income tax expense. Conclusions regarding tax positions are subject to review and may be adjusted at a later date based on factors including, but not limited to, on-going analyses of tax laws, regulations and interpretations thereof. There were no material uncertain tax positions through December 31, 2025. As applicable, our prior three tax years remain subject to examination by U.S. federal, state and local tax authorities.
Recent Developments
We have evaluated subsequent events through the date of issuance of these consolidated financial statements and determined there are no subsequent events to disclose except for the following:
January 2031 Notes
On January 23, 2026, we issued $400.0 million aggregate principal amount of 6.125% notes due 2031. In connection with the issuance of the January 2031 Notes, on January 20, 2026 we entered into a bilateral interest rate swap. The notional amount of the interest rate swap is $400.0 million. We will receive fixed rate interest at 6.125% and pay variable rate interest based on SOFR plus 2.495%. The interest rate swap matures on January 23, 2031.
Dividend
On February 18, 2026, the Board approved a first quarter dividend of $0.35 per share for stockholders of record as of March 31, 2026, payable on or before April 15, 2026.
2026 Stock Repurchase Program
On February 17, 2026, the Board approved a repurchase program (the “2026 Stock Repurchase Program”) under which we may repurchase up to $300 million of our common stock. Under the 2026 Repurchase Program, purchases may be made at management’s discretion from time to time in open-market transactions, including pursuant to trading plans with investment banks pursuant to Rule 10b5-1 of the Exchange Act, in accordance with all applicable rules and regulations. Unless extended by the Board, the 2026 Stock Repurchase Program will terminate 18-months from the date it was approved. Upon entering into the 2026 Stock Repurchase Program, the 2025 Stock Repurchase Program will terminate.
125
Item 7A. Quantitative and Qualitative Disclosures About Market Risk.
We are subject to financial market risks, including valuation risk, interest rate risk, currency risk, credit risk and inflation risk. Uncertainty with respect to the imposition of tariffs on and trade disputes with certain countries, the fluctuations in global interest rates, the ongoing war between Russia and Ukraine, continued political unrest in various countries such as Venezuela, the conflicts in the Middle East and North Africa regions, a prolonged government shutdown and concerns over future increases in inflation or adverse investor sentiment generally, introduced significant volatility in the financial markets, and the effects of this volatility has materially impacted and could continue to materially impact our market risks, including those listed below.
Valuation Risk
We have invested, and plan to continue to invest, primarily in illiquid debt and equity securities of private companies. Most of our investments will not have a readily available market price, and therefore, we will value these investments at fair value as determined in good faith by the Adviser, as our valuation designee, based on, among other things, the input of the independent third-party valuation firm(s) engaged at the direction of the Adviser, as our valuation designee, and in accordance with our valuation policy. There is no single standard for determining fair value. As a result, determining fair value requires that judgment be applied to the specific facts and circumstances of each portfolio investment while employing a consistently applied valuation process for the types of investments we make. If we were required to liquidate a portfolio investment in a forced or liquidation sale, we may realize amounts that are different from the amounts presented and such differences could be material. The independent third-party valuation firm(s) engaged at the discretion of the Adviser and its affiliates are full service financial institutions engaged in a variety of activities and from time to time we may receive or provide additional services to or from such independent third-party valuation firm(s).
Interest Rate Risk
Interest rate sensitivity refers to the change in earnings that may result from changes in the level of interest rates. We intend to fund portions of our investments with borrowings, and at such time, our net investment income will be affected by the difference between the rate at which we invest and the rate at which we borrow. Accordingly, we cannot assure you that a significant change in market interest rates will not have a material adverse effect on our net investment income.
In a low interest rate environment, the difference between the total interest income earned on interest earning assets and the total interest expense incurred on interest bearing liabilities may be compressed, reducing our net income and potentially adversely affecting our operating results. Conversely, in a rising interest rate environment, such difference could potentially increase thereby increasing our net income as indicated per the table below.
As of December 31, 2025, 96.2% of our debt investments based on fair value were floating rates. Additionally, the weighted average floating rate floor, based on fair value, of our debt investments was 0.8%. The Revolving Credit Facility, SPV Asset Facility I, SPV Asset Facility II, SPV Asset Facility III, SPV Asset Facility IV, Athena CLO II, and Athena CLO V bear interest at variable interest rates with an interest rate floor of 0.0%. The June 2026 Notes, January 2027 Notes, March 2028 Notes, September 2028 Notes and April 2029 Notes bear interest at fixed rates. The April 2029 Notes and March 2028 Notes are hedged against interest rate swap instruments. Athena CLO IV bears interest at fixed and variable rates.
Based on our Consolidated Statements of Assets and Liabilities as of December 31, 2025, the following table shows the annualized impact on net income of hypothetical base rate changes in interest rates on our debt investments (considering interest rate floors for floating rate instruments) assuming each floating rate investment is subject to 3-month reference rate and there are no changes in our investment and borrowing structure:
| ($ in thousands) | Interest Income | Interest Expense(1) | Net Income (2) | ||||||||||||||
| Up 300 basis points | $ | 355,900 | $ | 167,835 | $ | 188,065 | |||||||||||
| Up 200 basis points | $ | 237,267 | $ | 111,890 | $ | 125,377 | |||||||||||
| Up 100 basis points | $ | 118,633 | $ | 55,945 | $ | 62,688 | |||||||||||
| Down 100 basis points | $ | (118,633) | $ | (55,945) | $ | (62,688) | |||||||||||
| Down 200 basis points | $ | (237,215) | $ | (111,890) | $ | (125,325) | |||||||||||
| Down 300 basis points | $ | (352,874) | $ | (167,835) | $ | (185,039) | |||||||||||
(1)Includes the impact of our interest rate swaps as a result of interest rate changes.
(2)Excludes the impact of income based fees. See “Note 3 — Agreements and Related Party Transactions” to our consolidated financial statements included in this Annual Report for more information on the income based fees.
We may hedge against interest rate fluctuations by using hedging instruments such as additional interest rate swaps, futures, options, and forward contracts. While hedging activities may mitigate our exposure to adverse fluctuations in interest rates, certain hedging transactions, such as interest rate swap agreements, may also limit our ability to participate in the benefits of lower interest rates.
126
Currency Risk
From time to time, we may make investments that are denominated in a foreign currency, borrow in certain foreign currencies under our credit facilities or issue notes in certain foreign currencies. These investments, borrowings and issuances are translated into U.S. dollars at each balance sheet date, exposing us to movements in foreign exchange rates. We may employ hedging techniques to minimize these risks, but we cannot assure you that such strategies will be effective or without risk to us. We may seek to utilize instruments such as, but not limited to, forward contracts or cross currency swaps to seek to hedge against fluctuations in the relative values of our portfolio positions from changes in currency exchange rates. Instead of entering into a foreign currency forward contract in connection with loans or other investments denominated in a foreign currency, we may borrow in that currency to establish a natural hedge against our loan, or investment. To the extent the loan, issuance or investment is based on a floating rate other than a rate under which we can borrow under our credit facilities, we may utilize interest rate derivatives to hedge our exposure to changes in the associated rate.
Credit Risk
We generally endeavor to minimize our risk of exposure by limiting to reputable financial institutions the counterparties with which we enter into financial transactions. As of December 31, 2025 and December 31, 2024, we held the majority of our cash balances with a single highly rated money center bank and such balances are in excess of Federal Deposit Insurance Corporation insured limits. We seek to mitigate this exposure by monitoring the credit standing of these financial institutions.
Inflation Risk
Inflation is likely to continue in the near to medium-term, particularly in the United States, with the possibility that monetary policy may continue to tighten in response. Persistent inflationary pressures could affect our portfolio companies’ profit margins.
127
Item 8. Financial Statements and Supplementary Data
INDEX TO CONSOLIDATED FINANCIAL STATEMENTS
Report of Independent Registered Public Accounting Firm ( | F-2 | ||||
F-4 | |||||
F-4 | |||||
F-6 | |||||
F-48 | |||||
F-49 | |||||
F-51 | |||||
F-1
Report of Independent Registered Public Accounting Firm
To the Shareholders and Board of Directors
Blue Owl Technology Finance Corp.:
Opinion on the Consolidated Financial Statements
We have audited the accompanying consolidated statements of assets and liabilities of Blue Owl Technology Finance Corp. and subsidiaries (the Company), including the consolidated schedules of investments, as of December 31, 2025 and 2024, the related consolidated statements of operations, changes in net assets, and cash flows for each of the years in the three-year period ended December 31, 2025, and the related notes (collectively, the consolidated financial statements). We also have audited the Company’s internal control over financial reporting as of December 31, 2025, based on criteria established in the Internal Control – Integrated Framework (2013), issued by the Committee of Sponsoring Organizations of the Treadway Commission.
In our opinion, the consolidated financial statements referred to above present fairly, in all material respects, the financial position of the Company as of December 31, 2025 and 2024, and the results of its operations and its cash flows for each of the years in the three-year period ended December 31, 2025, in conformity with U.S. generally accepted accounting principles. Also in our opinion, the Company maintained, in all material respects, effective internal control over financial reporting as of December 31, 2025, based on criteria established in Internal Control – Integrated Framework (2013) issued by the Committee of Sponsoring Organizations of the Treadway Commission.
Basis for Opinions
The Company’s management is responsible for these consolidated financial statements, for maintaining effective internal control over financial reporting, and for its assessment of the effectiveness of internal control over financial reporting, included in the accompanying Management's Report on Internal Controls over Financial Reporting. Our responsibility is to express an opinion on the Company’s consolidated financial statements and an opinion on the Company’s internal control over financial reporting based on our audits. We are a public accounting firm registered with the Public Company Accounting Oversight Board (United States) (PCAOB) and are required to be independent with respect to the Company in accordance with the U.S. federal securities laws and the applicable rules and regulations of the Securities and Exchange Commission and the PCAOB.
We conducted our audits in accordance with the standards of the PCAOB. Those standards require that we plan and perform the audits to obtain reasonable assurance about whether the consolidated financial statements are free of material misstatement, whether due to error or fraud, and whether effective internal control over financial reporting was maintained in all material respects.
Our audits of the consolidated financial statements included performing procedures to assess the risks of material misstatement of the consolidated financial statements, whether due to error or fraud, and performing procedures that respond to those risks. Such procedures included examining, on a test basis, evidence regarding the amounts and disclosures in the consolidated financial statements. Such procedures also included confirmation of securities owned as of December 31, 2025 and 2024, by correspondence with the custodian, broker, agent banks, or portfolio companies; when replies were not received, we performed other appropriate auditing procedures. Our audits also included evaluating the accounting principles used and significant estimates made by management, as well as evaluating the overall presentation of the consolidated financial statements. Our audit of internal control over financial reporting included obtaining an understanding of internal control over financial reporting, assessing the risk that a material weakness exists, and testing and evaluating the design and operating effectiveness of internal control based on the assessed risk. Our audits also included performing such other procedures as we considered necessary in the circumstances. We believe that our audits provide a reasonable basis for our opinions.
Definition and Limitations of Internal Control Over Financial Reporting
A company’s internal control over financial reporting is a process designed to provide reasonable assurance regarding the reliability of financial reporting and the preparation of financial statements for external purposes in accordance with generally accepted accounting principles. A company’s internal control over financial reporting includes those policies and procedures that (1) pertain to the maintenance of records that, in reasonable detail, accurately and fairly reflect the transactions and dispositions of the assets of the company; (2) provide reasonable assurance that transactions are recorded as necessary to permit preparation of financial statements in accordance with generally accepted accounting principles, and that receipts and expenditures of the company are being made only in accordance with authorizations of management and directors of the company; and (3) provide reasonable assurance regarding prevention or timely detection of unauthorized acquisition, use, or disposition of the company’s assets that could have a material effect on the financial statements.
Because of its inherent limitations, internal control over financial reporting may not prevent or detect misstatements. Also, projections of any evaluation of effectiveness to future periods are subject to the risk that controls may become inadequate because of changes in conditions, or that the degree of compliance with the policies or procedures may deteriorate.
F-2
Critical Audit Matter
The critical audit matter communicated below is a matter arising from the current period audit of the consolidated financial statements that was communicated or required to be communicated to the audit committee and that: (1) relates to accounts or disclosures that are material to the consolidated financial statements and (2) involved our especially challenging, subjective, or complex judgments. The communication of a critical audit matter does not alter in any way our opinion on the consolidated financial statements, taken as a whole, and we are not, by communicating the critical audit matter below, providing a separate opinion on the critical audit matter or on the accounts or disclosures to which it relates.
Assessment of Fair Value of Investments
As discussed in Notes 2 and 6 to the consolidated financial statements, the Company determines fair value for investments that are not publicly traded or for which there is no readily determinable market value by using unobservable inputs and assumptions. As of December 31, 2025, the fair value of such investments (“Level 3 investments”) was $13.6 billion.
We identified the assessment of the fair value measurement of substantially all of the Level 3 investments as a critical audit matter. Subjective auditor judgment was required to evaluate these fair value measurements as they involved a high degree of measurement uncertainty. Specifically, the assessment of these fair value measurements encompassed the evaluation of assumptions related to market yields for similar investments and risk profiles used in yield analyses for debt and other interest-bearing investments and comparable financial performance multiples used in determining enterprise values for equity investments.
The following are the primary procedures we performed to address this critical audit matter. We evaluated the design and tested the operating effectiveness of certain internal controls related to the fair value measurement process, including controls related to the development of the market yields and financial performance multiples assumptions used in the Company’s fair value measurements. We evaluated the Company’s ability to estimate fair value by comparing a selection of prior period fair values to the prices of transactions occurring subsequent to the prior period fair value measurement date. We evaluated the Company’s market yields used to measure the fair value of its Level 3 investments by comparing such yields for a selection of investments to third-party market and industry data. We involved valuation professionals with specialized skills and knowledge who assisted in evaluating the reasonableness of the fair value measurement for a selection of Level 3 investments by:
•developing an independent estimate of the fair value using independent market yields and financial performance multiples that were developed using relevant market and portfolio company financial information
•comparing the results of our independent estimate of fair value to the Company’s fair value measurement.
/s/ KPMG LLP
We have served as the Company’s auditor since 2021.
New York, New York
February 18, 2026
F-3
Blue Owl Technology Finance Corp.
Consolidated Statements of Assets and Liabilities
(Amounts in thousands, except share and per share amounts)
| December 31, 2025 | December 31, 2024 | ||||||||||
| Assets | |||||||||||
| Investments at fair value | |||||||||||
Non-controlled, non-affiliated investments (amortized cost of $ | $ | $ | |||||||||
Non-controlled, affiliated investments (amortized cost of $ | |||||||||||
Controlled, affiliated investments (amortized cost of $ | |||||||||||
Total investments at fair value (amortized cost of $ | |||||||||||
Cash (restricted cash of $ | |||||||||||
Foreign cash (cost of $ | |||||||||||
| Interest receivable | |||||||||||
| Dividend income receivable | |||||||||||
| Prepaid expenses and other assets | |||||||||||
| Total Assets | $ | $ | |||||||||
| Liabilities | |||||||||||
Debt (net of unamortized debt issuance costs of $ | $ | $ | |||||||||
| Management fee payable | |||||||||||
| Distribution payable | |||||||||||
| Incentive fee payable | |||||||||||
| Payables to affiliates | |||||||||||
| Payable for investments purchased | |||||||||||
| Accrued expenses and other liabilities | |||||||||||
| Total Liabilities | $ | $ | |||||||||
| Commitments and contingencies (Note 8) | |||||||||||
| Net Assets | |||||||||||
Common shares $ | $ | $ | |||||||||
| Additional paid-in-capital | |||||||||||
| Total accumulated undistributed earnings | |||||||||||
| Total Net Assets | |||||||||||
| Total Liabilities and Net Assets | $ | $ | |||||||||
| Net Asset Value Per Share | $ | $ | |||||||||
The accompanying notes are an integral part of these consolidated financial statements.
F-4
Blue Owl Technology Finance Corp.
Consolidated Statements of Operations
(Amounts in thousands, except share and per share amounts)
| For the Years Ended December 31, | |||||||||||||||||
| 2025 | 2024 | 2023 | |||||||||||||||
| Investment Income | |||||||||||||||||
| Investment income from non-controlled, non-affiliated investments: | |||||||||||||||||
| Interest income | $ | $ | $ | ||||||||||||||
| Payment-in-kind interest income | |||||||||||||||||
| Dividend income | |||||||||||||||||
| Payment-in-kind dividend income | |||||||||||||||||
| Other income | |||||||||||||||||
| Total investment income from non-controlled, non-affiliated investments | |||||||||||||||||
| Investment income from non-controlled, affiliated investments: | |||||||||||||||||
| Interest income | |||||||||||||||||
| Payment-in-kind interest income | |||||||||||||||||
| Dividend income | |||||||||||||||||
| Payment-in-kind dividend income | |||||||||||||||||
| Other income | |||||||||||||||||
| Total investment income from non-controlled, affiliated investments | |||||||||||||||||
| Investment income from controlled, affiliated investments: | |||||||||||||||||
| Dividend income | |||||||||||||||||
| Total investment income from controlled, affiliated investments | |||||||||||||||||
| Total Investment Income | |||||||||||||||||
| Expenses | |||||||||||||||||
| Interest expense | $ | $ | $ | ||||||||||||||
Management fees, net(1) | |||||||||||||||||
| Performance based incentive fees | |||||||||||||||||
| Capital gains incentive fees | ( | ||||||||||||||||
| Professional fees | |||||||||||||||||
| Listing advisory fees (net of Adviser reimbursement) | |||||||||||||||||
| Directors' fees | |||||||||||||||||
| Other general and administrative | |||||||||||||||||
| Total Expenses | |||||||||||||||||
| Net Investment Income (Loss) Before Taxes | |||||||||||||||||
| Income tax expense (benefit), including excise tax expense (benefit) | |||||||||||||||||
| Net Investment Income (Loss) After Taxes | |||||||||||||||||
| Net Change in Unrealized Gain (Loss) | |||||||||||||||||
| Non-controlled, non-affiliated investments | $ | $ | $ | ||||||||||||||
| Non-controlled, affiliated investments | ( | ( | ( | ||||||||||||||
| Controlled, affiliated investments | ( | ||||||||||||||||
| Translation of assets and liabilities in foreign currencies and other transactions | ( | ||||||||||||||||
| Income tax (provision) benefit | ( | ( | |||||||||||||||
| Total Net Change in Unrealized Gain (Loss) | ( | ||||||||||||||||
| Net Realized Gain (Loss): | |||||||||||||||||
| Non-controlled, non-affiliated investments | $ | ( | $ | ( | $ | ||||||||||||
| Non-controlled, affiliated investments | ( | ||||||||||||||||
| Foreign currency transactions | ( | ( | ( | ||||||||||||||
| Total Net Realized Gain (Loss) | ( | ||||||||||||||||
| Total Net Realized and Change in Unrealized Gain (Loss) | ( | ||||||||||||||||
F-4
Blue Owl Technology Finance Corp.
Consolidated Statements of Operations
(Amounts in thousands, except share and per share amounts)
| Net Increase (Decrease) in Net Assets Resulting from Operations | $ | $ | $ | ||||||||||||||
| Earnings (Loss) Per Share - Basic and Diluted | $ | $ | $ | ||||||||||||||
| Weighted Average Shares Outstanding - Basic and Diluted | |||||||||||||||||
(1)Refer to “Note 3 — Agreements and Related Party Transactions” for additional details on management fee waiver.
The accompanying notes are an integral part of these consolidated financial statements.
F-5
Blue Owl Technology Finance Corp.
Consolidated Schedule of Investments
As of December 31, 2025
(Amounts in thousands, except share amounts)
| Interest | |||||||||||||||||||||||||||||||||||||||||||||||
| Company(1)(25) | Investment | Ref. Rate | Cash | PIK | Maturity Date | Par / Units | Amortized Cost(2)(27) | Fair Value | % of Net Assets | ||||||||||||||||||||||||||||||||||||||
| Non-controlled/non-affiliated portfolio company investments | |||||||||||||||||||||||||||||||||||||||||||||||
| Debt Investments(7) | |||||||||||||||||||||||||||||||||||||||||||||||
| Aerospace & Defense | |||||||||||||||||||||||||||||||||||||||||||||||
| Jeppesen Holdings, LLC(3)(4)(9) | First lien senior secured loan | S+ | 10/2032 | $ | $ | $ | |||||||||||||||||||||||||||||||||||||||||
| ManTech International Corporation(3)(4)(9) | First lien senior secured loan | S+ | 9/2029 | ||||||||||||||||||||||||||||||||||||||||||||
| Peraton Corp.(3)(9) | Second lien senior secured loan | S+ | 2/2029 | ||||||||||||||||||||||||||||||||||||||||||||
| % | |||||||||||||||||||||||||||||||||||||||||||||||
| Airlines | |||||||||||||||||||||||||||||||||||||||||||||||
| Accommodations Plus Technologies LLC(3)(4)(9) | First lien senior secured loan | S+ | 5/2032 | ||||||||||||||||||||||||||||||||||||||||||||
| % | |||||||||||||||||||||||||||||||||||||||||||||||
| Application Software | |||||||||||||||||||||||||||||||||||||||||||||||
| AI Titan Parent, Inc. (dba Prometheus Group)(3)(4)(8)(22) | First lien senior secured loan | S+ | 8/2031 | ||||||||||||||||||||||||||||||||||||||||||||
| AlphaSense, Inc.(3)(4)(9) | First lien senior secured loan | S+ | 6/2029 | ||||||||||||||||||||||||||||||||||||||||||||
| Anaplan, Inc.(3)(4)(9) | First lien senior secured loan | S+ | 6/2029 | ||||||||||||||||||||||||||||||||||||||||||||
| Armstrong Bidco Limited(3)(4)(19)(31) | First lien senior secured GBP term loan | SA+ | 6/2029 | £ | |||||||||||||||||||||||||||||||||||||||||||
| Arrow Borrower 2025, Inc. (dba AvidXchange)(3)(4)(9) | First lien senior secured loan | S+ | 10/2032 | ||||||||||||||||||||||||||||||||||||||||||||
| Artifact Bidco, Inc. (dba Avetta)(3)(4)(9) | First lien senior secured loan | S+ | 7/2031 | ||||||||||||||||||||||||||||||||||||||||||||
| Boxer Parent Company Inc. (f/k/a BMC)(3)(9) | First lien senior secured loan | S+ | 7/2031 | ||||||||||||||||||||||||||||||||||||||||||||
| BusinessSolver.com, Inc.(3)(4)(9) | First lien senior secured loan | S+ | 12/2032 | ||||||||||||||||||||||||||||||||||||||||||||
| CALABRIO, INC.(3)(4)(9) | First lien senior secured loan | S+ | 11/2032 | ||||||||||||||||||||||||||||||||||||||||||||
| Catalis Intermediate, Inc. (fka GovBrands Intermediate, Inc.)(3)(4)(9)(22) | First lien senior secured loan | S+ | 8/2027 | ||||||||||||||||||||||||||||||||||||||||||||
| CivicPlus, LLC(3)(4)(9) | First lien senior secured loan | S+ | 8/2030 | ||||||||||||||||||||||||||||||||||||||||||||
| CivicPlus, LLC(3)(4)(9)(22) | First lien senior secured delayed draw term loan | S+ | 8/2030 | ||||||||||||||||||||||||||||||||||||||||||||
| Coupa Holdings, LLC(3)(4)(9) | First lien senior secured loan | S+ | 2/2030 | ||||||||||||||||||||||||||||||||||||||||||||
| CP PIK DEBT ISSUER, LLC (dba CivicPlus, LLC)(3)(4)(10) | Unsecured notes | S+ | 6/2034 | ||||||||||||||||||||||||||||||||||||||||||||
| Einstein Parent, Inc. (dba Smartsheet)(3)(4)(9) | First lien senior secured loan | S+ | 1/2031 | ||||||||||||||||||||||||||||||||||||||||||||
| Gainsight, Inc.(3)(4)(9) | First lien senior secured loan | S+ | 7/2027 | ||||||||||||||||||||||||||||||||||||||||||||
| Granicus, Inc.(3)(4)(9) | First lien senior secured loan | S+ | 1/2031 | ||||||||||||||||||||||||||||||||||||||||||||
| Granicus, Inc.(3)(4)(9) | First lien senior secured delayed draw term loan | S+ | 1/2031 | ||||||||||||||||||||||||||||||||||||||||||||
| GS Acquisitionco, Inc. (dba insightsoftware)(3)(4)(9)(22) | First lien senior secured loan | S+ | 5/2028 | ||||||||||||||||||||||||||||||||||||||||||||
| Gusto, Inc.(3)(4)(9) | First lien senior secured loan | S+ | 11/2030 | ||||||||||||||||||||||||||||||||||||||||||||
| Infobip Inc.(3)(4)(9)(31) | First lien senior secured loan | S+ | 6/2029 | ||||||||||||||||||||||||||||||||||||||||||||
| JS Parent, Inc. (dba Jama Software)(3)(4)(9) | First lien senior secured loan | S+ | 4/2031 | ||||||||||||||||||||||||||||||||||||||||||||
| Lighthouse Buyer, Inc. (dba Harbor Compliance)(3)(4)(11)(22) | First lien senior secured loan | S+ | 12/2031 | ||||||||||||||||||||||||||||||||||||||||||||
F-6
Blue Owl Technology Finance Corp.
Consolidated Schedule of Investments
As of December 31, 2025
(Amounts in thousands, except share amounts)
| Interest | |||||||||||||||||||||||||||||||||||||||||||||||
| Company(1)(25) | Investment | Ref. Rate | Cash | PIK | Maturity Date | Par / Units | Amortized Cost(2)(27) | Fair Value | % of Net Assets | ||||||||||||||||||||||||||||||||||||||
| Magnet Forensics, LLC (f/k/a Grayshift, LLC)(3)(4)(8)(31) | First lien senior secured loan | S+ | 7/2028 | ||||||||||||||||||||||||||||||||||||||||||||
| Ministry Brands Holdings, LLC(3)(4)(8) | First lien senior secured loan | S+ | 12/2028 | ||||||||||||||||||||||||||||||||||||||||||||
| Ministry Brands Holdings, LLC(3)(4)(12)(22) | First lien senior secured revolving loan | S+ | 12/2027 | ||||||||||||||||||||||||||||||||||||||||||||
| Simpler Postage, Inc. (dba Easypost)(3)(4)(8)(22) | First lien senior secured loan | S+ | 6/2029 | ||||||||||||||||||||||||||||||||||||||||||||
| Tamarack Intermediate, L.L.C. (dba Verisk 3E)(3)(4)(9)(22) | First lien senior secured loan | S+ | 3/2029 | ||||||||||||||||||||||||||||||||||||||||||||
| VCI Asset Holdings 1 LLC(3)(4)(6)(31) | First lien senior secured loan | N/A | 11/2030 | ||||||||||||||||||||||||||||||||||||||||||||
| Velocity HoldCo III Inc. (dba VelocityEHS)(3)(4)(9) | First lien senior secured loan | S+ | 5/2029 | ||||||||||||||||||||||||||||||||||||||||||||
| XPLOR T1, LLC(3)(4)(9) | First lien senior secured loan | S+ | 12/2032 | ||||||||||||||||||||||||||||||||||||||||||||
| Zendesk, Inc.(3)(4)(9) | First lien senior secured loan | S+ | 11/2028 | ||||||||||||||||||||||||||||||||||||||||||||
| % | |||||||||||||||||||||||||||||||||||||||||||||||
| Banks | |||||||||||||||||||||||||||||||||||||||||||||||
| Finastra USA, Inc.(3)(4)(9)(31) | First lien senior secured loan | S+ | 9/2029 | ||||||||||||||||||||||||||||||||||||||||||||
| % | |||||||||||||||||||||||||||||||||||||||||||||||
| Beverages | |||||||||||||||||||||||||||||||||||||||||||||||
| Innovation Ventures HoldCo, LLC (dba 5 Hour Energy)(3)(4)(8) | First lien senior secured loan | S+ | 3/2027 | ||||||||||||||||||||||||||||||||||||||||||||
| % | |||||||||||||||||||||||||||||||||||||||||||||||
| Building Products | |||||||||||||||||||||||||||||||||||||||||||||||
| EET Buyer, Inc. (dba e-Emphasys)(3)(4)(9)(22) | First lien senior secured loan | S+ | 11/2027 | ||||||||||||||||||||||||||||||||||||||||||||
| % | |||||||||||||||||||||||||||||||||||||||||||||||
| Buildings & Real Estate | |||||||||||||||||||||||||||||||||||||||||||||||
| Associations, Inc.(3)(4)(9)(22) | First lien senior secured loan | S+ | 7/2028 | ||||||||||||||||||||||||||||||||||||||||||||
| Associations Finance, Inc.(3)(4)(6) | Unsecured notes | N/A | 5/2030 | ||||||||||||||||||||||||||||||||||||||||||||
| % | |||||||||||||||||||||||||||||||||||||||||||||||
| Capital Markets | |||||||||||||||||||||||||||||||||||||||||||||||
| CCM Midco, LLC (f/k/a Cresset Capital Management, LLC)(3)(4)(8)(22) | First lien senior secured loan | S+ | 6/2030 | ||||||||||||||||||||||||||||||||||||||||||||
| Denali Intermediate Holdings, Inc. (dba Dun & Bradstreet)(3)(4)(8) | First lien senior secured loan | S+ | 8/2032 | ||||||||||||||||||||||||||||||||||||||||||||
| % | |||||||||||||||||||||||||||||||||||||||||||||||
| Commercial Services & Supplies | |||||||||||||||||||||||||||||||||||||||||||||||
| Sentinel Buyer Corp. (dba SimpliSafe)(3)(4)(8) | First lien senior secured loan | S+ | 11/2032 | ||||||||||||||||||||||||||||||||||||||||||||
| % | |||||||||||||||||||||||||||||||||||||||||||||||
| Construction & Engineering | |||||||||||||||||||||||||||||||||||||||||||||||
| Dodge Construction Network LLC(3)(9) | First lien senior secured loan | S+ | 1/2029 | ||||||||||||||||||||||||||||||||||||||||||||
| Dodge Construction Network LLC(3)(4)(9) | First lien senior secured loan | S+ | 2/2029 | ||||||||||||||||||||||||||||||||||||||||||||
| Pike Corp.(4)(9) | First lien senior secured loan | S+ | 12/2032 | ||||||||||||||||||||||||||||||||||||||||||||
| % | |||||||||||||||||||||||||||||||||||||||||||||||
| Consumer Finance | |||||||||||||||||||||||||||||||||||||||||||||||
| Klarna Holding AB(3)(4)(9)(31) | Subordinated Floating Rate Notes | S+ | 4/2034 | ||||||||||||||||||||||||||||||||||||||||||||
| % | |||||||||||||||||||||||||||||||||||||||||||||||
F-7
Blue Owl Technology Finance Corp.
Consolidated Schedule of Investments
As of December 31, 2025
(Amounts in thousands, except share amounts)
| Interest | |||||||||||||||||||||||||||||||||||||||||||||||
| Company(1)(25) | Investment | Ref. Rate | Cash | PIK | Maturity Date | Par / Units | Amortized Cost(2)(27) | Fair Value | % of Net Assets | ||||||||||||||||||||||||||||||||||||||
| Diversified Consumer Services | |||||||||||||||||||||||||||||||||||||||||||||||
| Eagan Parent, Inc. (dba Elite)(3)(4)(9) | First lien senior secured loan | S+ | 9/2032 | ||||||||||||||||||||||||||||||||||||||||||||
| Icefall Parent, Inc. (dba EngageSmart)(3)(4)(9) | First lien senior secured loan | S+ | 1/2030 | ||||||||||||||||||||||||||||||||||||||||||||
| Litera Bidco LLC(3)(4)(8)(22) | First lien senior secured loan | S+ | 5/2028 | ||||||||||||||||||||||||||||||||||||||||||||
| Relativity ODA LLC(3)(4)(8) | First lien senior secured loan | S+ | 5/2029 | ||||||||||||||||||||||||||||||||||||||||||||
| Themis Solutions Inc. (dba Clio)(3)(4)(8)(31) | First lien senior secured loan | S+ | 10/2032 | ||||||||||||||||||||||||||||||||||||||||||||
| % | |||||||||||||||||||||||||||||||||||||||||||||||
| Diversified Financial Services | |||||||||||||||||||||||||||||||||||||||||||||||
| Blackhawk Network Holdings, Inc.(3)(9) | First lien senior secured loan | S+ | 3/2029 | ||||||||||||||||||||||||||||||||||||||||||||
| BTRS Holdings Inc. (dba Billtrust)(3)(4)(9)(22) | First lien senior secured loan | S+ | 12/2028 | ||||||||||||||||||||||||||||||||||||||||||||
| Computer Services, Inc. (dba CSI)(3)(4)(9) | First lien senior secured loan | S+ | 11/2031 | ||||||||||||||||||||||||||||||||||||||||||||
| Deerfield Dakota Holdings(3)(4)(9) | First lien senior secured loan | S+ | 9/2032 | ||||||||||||||||||||||||||||||||||||||||||||
| Hg Genesis 8 Sumoco Limited(3)(4)(19)(31) | Unsecured facility | SA+ | 9/2027 | £ | |||||||||||||||||||||||||||||||||||||||||||
| Hg Genesis 9 SumoCo Limited(3)(4)(14)(31) | Unsecured facility | E+ | 3/2029 | € | |||||||||||||||||||||||||||||||||||||||||||
| Hg Saturn Luchaco Limited(3)(4)(19)(31) | Unsecured facility | SA+ | 3/2027 | £ | |||||||||||||||||||||||||||||||||||||||||||
| Minotaur Acquisition, Inc. (dba Inspira Financial)(3)(4)(8) | First lien senior secured loan | S+ | 6/2030 | ||||||||||||||||||||||||||||||||||||||||||||
| ML Holdco, Inc. (dba Meridian Link)(3)(4)(9) | First lien senior secured loan | S+ | 10/2032 | ||||||||||||||||||||||||||||||||||||||||||||
| NMI Acquisitionco, Inc. (dba Network Merchants)(3)(4)(8) | First lien senior secured loan | S+ | 9/2028 | ||||||||||||||||||||||||||||||||||||||||||||
| Smarsh Inc.(3)(4)(9)(22) | First lien senior secured revolving loan | S+ | 2/2029 | ||||||||||||||||||||||||||||||||||||||||||||
| % | |||||||||||||||||||||||||||||||||||||||||||||||
| Diversified Support Services | |||||||||||||||||||||||||||||||||||||||||||||||
| CoreTrust Purchasing Group LLC(3)(4)(8) | First lien senior secured loan | S+ | 10/2029 | ||||||||||||||||||||||||||||||||||||||||||||
| % | |||||||||||||||||||||||||||||||||||||||||||||||
| Entertainment | |||||||||||||||||||||||||||||||||||||||||||||||
| Aerosmith Bidco 1 Limited (dba Audiotonix)(3)(4)(9)(31) | First lien senior secured loan | S+ | 7/2031 | ||||||||||||||||||||||||||||||||||||||||||||
| % | |||||||||||||||||||||||||||||||||||||||||||||||
| Equity Real Estate Investment Trusts (REITs) | |||||||||||||||||||||||||||||||||||||||||||||||
| Storable, Inc.(3)(8) | First lien senior secured loan | S+ | 4/2031 | ||||||||||||||||||||||||||||||||||||||||||||
| Storable Intermediate Holdings, LLC(3)(4)(8) | First lien senior secured loan | S+ | 4/2032 | ||||||||||||||||||||||||||||||||||||||||||||
| % | |||||||||||||||||||||||||||||||||||||||||||||||
| Food & Staples Retailing | |||||||||||||||||||||||||||||||||||||||||||||||
| IRI Group Holdings, Inc. (f/k/a Circana Group, L.P. (f/k/a The NPD Group, L.P.))(3)(4)(8) | First lien senior secured loan | S+ | 12/2029 | ||||||||||||||||||||||||||||||||||||||||||||
| % | |||||||||||||||||||||||||||||||||||||||||||||||
| Health Care Equipment & Supplies | |||||||||||||||||||||||||||||||||||||||||||||||
| Cambrex Corporation(3)(4)(8)(22) | First lien senior secured loan | S+ | 3/2032 | ||||||||||||||||||||||||||||||||||||||||||||
| Packaging Coordinators Midco, Inc.(3)(4)(9) | First lien senior secured loan | S+ | 10/2032 | ||||||||||||||||||||||||||||||||||||||||||||
F-8
Blue Owl Technology Finance Corp.
Consolidated Schedule of Investments
As of December 31, 2025
(Amounts in thousands, except share amounts)
| Interest | |||||||||||||||||||||||||||||||||||||||||||||||
| Company(1)(25) | Investment | Ref. Rate | Cash | PIK | Maturity Date | Par / Units | Amortized Cost(2)(27) | Fair Value | % of Net Assets | ||||||||||||||||||||||||||||||||||||||
| Packaging Coordinators Midco, Inc.(3)(4)(9)(22) | First lien senior secured delayed draw term loan | S+ | 1/2032 | ||||||||||||||||||||||||||||||||||||||||||||
| Packaging Coordinators Midco, Inc.(3)(4)(19) | First lien senior secured delayed draw term loan | S+ | 10/2032 | ||||||||||||||||||||||||||||||||||||||||||||
| PerkinElmer U.S. LLC(3)(4)(8) | First lien senior secured loan | S+ | 3/2029 | ||||||||||||||||||||||||||||||||||||||||||||
| % | |||||||||||||||||||||||||||||||||||||||||||||||
| Health Care Providers & Services | |||||||||||||||||||||||||||||||||||||||||||||||
| Bristol Hospice L.L.C.(3)(4)(9) | First lien senior secured loan | S+ | 8/2032 | ||||||||||||||||||||||||||||||||||||||||||||
| Covetrus, Inc.(3)(4)(9) | Second lien senior secured loan | S+ | 10/2030 | ||||||||||||||||||||||||||||||||||||||||||||
| Engage Debtco Limited(3)(4)(9)(31) | First lien senior secured loan | S+ | 7/2029 | ||||||||||||||||||||||||||||||||||||||||||||
| Engage Debtco Limited(3)(4)(9)(31) | First lien senior secured delayed draw term loan | S+ | 7/2029 | ||||||||||||||||||||||||||||||||||||||||||||
| EresearchTechnology, Inc. (dba Clario)(3)(4)(8)(22) | First lien senior secured loan | S+ | 1/2032 | ||||||||||||||||||||||||||||||||||||||||||||
| KWOL Acquisition, Inc. (dba Worldwide Clinical Trials)(3)(4)(8)(22) | First lien senior secured loan | S+ | 12/2029 | ||||||||||||||||||||||||||||||||||||||||||||
| Natural Partners, LLC(3)(4)(9)(31) | First lien senior secured loan | S+ | 11/2030 | ||||||||||||||||||||||||||||||||||||||||||||
| OneOncology, LLC(3)(4)(9) | First lien senior secured loan | S+ | 6/2030 | ||||||||||||||||||||||||||||||||||||||||||||
| OneOncology, LLC(3)(4)(9) | First lien senior secured delayed draw term loan | S+ | 6/2030 | ||||||||||||||||||||||||||||||||||||||||||||
| OneOncology, LLC(3)(4)(9)(22) | First lien senior secured delayed draw term loan | S+ | 6/2030 | ||||||||||||||||||||||||||||||||||||||||||||
| PetVet Care Centers, LLC(3)(4)(8) | First lien senior secured loan | S+ | 11/2030 | ||||||||||||||||||||||||||||||||||||||||||||
| PetVet Care Centers, LLC(3)(4)(8)(22) | First lien senior secured revolving loan | S+ | 11/2029 | ||||||||||||||||||||||||||||||||||||||||||||
| Valeris, Inc. (fka Phantom Purchaser, Inc.)(3)(4)(9) | First lien senior secured loan | S+ | 9/2031 | ||||||||||||||||||||||||||||||||||||||||||||
| Valeris, Inc. (fka Phantom Purchaser, Inc.)(3)(4)(9) | First lien senior secured loan | S+ | 9/2031 | ||||||||||||||||||||||||||||||||||||||||||||
| Vermont Aus Pty Ltd(3)(4)(17)(31) | First lien senior secured AUD term loan | BBSY+ | 3/2028 | A$ | |||||||||||||||||||||||||||||||||||||||||||
| % | |||||||||||||||||||||||||||||||||||||||||||||||
| Health Care Technology | |||||||||||||||||||||||||||||||||||||||||||||||
| Athenahealth Group Inc.(3)(8) | First lien senior secured loan | S+ | 2/2029 | ||||||||||||||||||||||||||||||||||||||||||||
| BCPE Osprey Buyer, Inc. (dba PartsSource)(3)(4)(9) | First lien senior secured loan | S+ | 8/2028 | ||||||||||||||||||||||||||||||||||||||||||||
| BCPE Osprey Buyer, Inc. (dba PartsSource)(3)(4)(8)(22) | First lien senior secured revolving loan | S+ | 8/2026 | ||||||||||||||||||||||||||||||||||||||||||||
| BCPE Osprey Buyer, Inc. (dba PartsSource)(3)(4)(8) | First lien senior secured delayed draw term loan | S+ | 8/2028 | ||||||||||||||||||||||||||||||||||||||||||||
| Color Intermediate, LLC (dba ClaimsXten)(3)(4)(9) | First lien senior secured loan | S+ | 10/2029 | ||||||||||||||||||||||||||||||||||||||||||||
| CT Technologies Intermediate Holdings, Inc. (& Smart Holdings Corp.) (dba Datavant)(3)(4)(8)(22) | First lien senior secured loan | S+ | 8/2031 | ||||||||||||||||||||||||||||||||||||||||||||
| CT Technologies Intermediate Holdings, Inc. (& Smart Holdings Corp.) (dba Datavant)(3)(4)(8)(22) | First lien senior secured delayed draw term loan | S+ | 8/2031 | ||||||||||||||||||||||||||||||||||||||||||||
| GI Ranger Intermediate, LLC (dba Rectangle Health)(3)(4)(9)(22) | First lien senior secured revolving loan | S+ | 10/2027 | ||||||||||||||||||||||||||||||||||||||||||||
| GI Ranger Intermediate, LLC (dba Rectangle Health)(3)(4)(9) | First lien senior secured loan | S+ | 10/2028 | ||||||||||||||||||||||||||||||||||||||||||||
| Greenway Health, LLC(3)(4)(9) | First lien senior secured loan | S+ | 4/2029 | ||||||||||||||||||||||||||||||||||||||||||||
F-9
Blue Owl Technology Finance Corp.
Consolidated Schedule of Investments
As of December 31, 2025
(Amounts in thousands, except share amounts)
| Interest | |||||||||||||||||||||||||||||||||||||||||||||||
| Company(1)(25) | Investment | Ref. Rate | Cash | PIK | Maturity Date | Par / Units | Amortized Cost(2)(27) | Fair Value | % of Net Assets | ||||||||||||||||||||||||||||||||||||||
| Himalaya Topco LLC (dba HealthEdge)(3)(4)(8) | First lien senior secured loan | S+ | 6/2032 | ||||||||||||||||||||||||||||||||||||||||||||
| Hyland Software, Inc.(3)(4)(9) | First lien senior secured loan | S+ | 9/2030 | ||||||||||||||||||||||||||||||||||||||||||||
| Indikami Bidco, LLC (dba IntegriChain)(3)(4)(8) | First lien senior secured loan | S+ | 12/2030 | ||||||||||||||||||||||||||||||||||||||||||||
| Indikami Bidco, LLC (dba IntegriChain)(3)(4)(8) | First lien senior secured delayed draw term loan | S+ | 12/2030 | ||||||||||||||||||||||||||||||||||||||||||||
| Indikami Bidco, LLC (dba IntegriChain)(3)(4)(8)(22) | First lien senior secured revolving loan | S+ | 6/2030 | ||||||||||||||||||||||||||||||||||||||||||||
| Inovalon Holdings, Inc.(3)(4)(9) | First lien senior secured loan | S+ | 11/2028 | ||||||||||||||||||||||||||||||||||||||||||||
| Inovalon Holdings, Inc.(3)(4)(9) | Second lien senior secured loan | S+ | 11/2033 | ||||||||||||||||||||||||||||||||||||||||||||
| Intelerad Medical Systems Incorporated (fka 11849573 Canada Inc.)(3)(4)(9)(31) | First lien senior secured loan | S+ | 8/2026 | ||||||||||||||||||||||||||||||||||||||||||||
| Interoperability Bidco, Inc. (dba Lyniate)(3)(4)(9)(22) | First lien senior secured loan | S+ | 3/2028 | ||||||||||||||||||||||||||||||||||||||||||||
| Modernizing Medicine, Inc. (dba ModMed)(3)(4)(9) | First lien senior secured loan | S+ | 4/2032 | ||||||||||||||||||||||||||||||||||||||||||||
| Neptune Holdings, Inc. (dba NexTech)(3)(4)(9) | First lien senior secured loan | S+ | 8/2030 | ||||||||||||||||||||||||||||||||||||||||||||
| RL Datix Holdings (USA), Inc.(3)(4)(10) | First lien senior secured loan | S+ | 4/2031 | ||||||||||||||||||||||||||||||||||||||||||||
| RL Datix Holdings (USA), Inc.(3)(4)(19) | First lien senior secured GBP term loan | SA+ | 4/2031 | £ | |||||||||||||||||||||||||||||||||||||||||||
| Salinger Bidco Inc. (dba Surgical Information Systems)(3)(4)(9) | First lien senior secured loan | S+ | 8/2031 | ||||||||||||||||||||||||||||||||||||||||||||
| Salinger Bidco Inc. (dba Surgical Information Systems)(3)(4)(9)(22) | First lien senior secured revolving loan | S+ | 5/2031 | ||||||||||||||||||||||||||||||||||||||||||||
| % | |||||||||||||||||||||||||||||||||||||||||||||||
| Hotels, Restaurants & Leisure | |||||||||||||||||||||||||||||||||||||||||||||||
| MINDBODY, Inc.(3)(4)(9) | First lien senior secured loan | S+ | 9/2027 | ||||||||||||||||||||||||||||||||||||||||||||
| % | |||||||||||||||||||||||||||||||||||||||||||||||
| Household Durables | |||||||||||||||||||||||||||||||||||||||||||||||
| BCTO BSI Buyer, Inc. (dba Buildertrend)(3)(4)(9) | First lien senior secured loan | S+ | 12/2028 | ||||||||||||||||||||||||||||||||||||||||||||
| % | |||||||||||||||||||||||||||||||||||||||||||||||
| Industrial Conglomerates | |||||||||||||||||||||||||||||||||||||||||||||||
| Aptean Acquiror, Inc. (dba Aptean)(3)(4)(9) | First lien senior secured loan | S+ | 1/2031 | ||||||||||||||||||||||||||||||||||||||||||||
| Aptean Acquiror, Inc. (dba Aptean)(3)(4)(8)(22) | First lien senior secured revolving loan | S+ | 1/2031 | ||||||||||||||||||||||||||||||||||||||||||||
| QAD, Inc.(3)(4)(8) | First lien senior secured loan | S+ | 11/2027 | ||||||||||||||||||||||||||||||||||||||||||||
| % | |||||||||||||||||||||||||||||||||||||||||||||||
| Insurance | |||||||||||||||||||||||||||||||||||||||||||||||
| AmeriLife Holdings LLC(3)(4)(9)(22) | First lien senior secured loan | S+ | 8/2029 | ||||||||||||||||||||||||||||||||||||||||||||
| AmeriLife Holdings LLC(3)(4)(9)(22) | First lien senior secured revolving loan | S+ | 8/2028 | ||||||||||||||||||||||||||||||||||||||||||||
| Asurion, LLC(3)(8) | First lien senior secured loan | S+ | 8/2028 | ||||||||||||||||||||||||||||||||||||||||||||
| Asurion, LLC(3)(8) | Second lien senior secured loan | S+ | 1/2028 | ||||||||||||||||||||||||||||||||||||||||||||
| Diamond Insure Bidco (dba Acturis)(3)(4)(14)(31) | First lien senior secured EUR term loan | E+ | 7/2031 | € | |||||||||||||||||||||||||||||||||||||||||||
| Diamond Insure Bidco (dba Acturis)(3)(4)(19)(31) | First lien senior secured GBP term loan | SA+ | 7/2031 | £ | |||||||||||||||||||||||||||||||||||||||||||
F-10
Blue Owl Technology Finance Corp.
Consolidated Schedule of Investments
As of December 31, 2025
(Amounts in thousands, except share amounts)
| Interest | |||||||||||||||||||||||||||||||||||||||||||||||
| Company(1)(25) | Investment | Ref. Rate | Cash | PIK | Maturity Date | Par / Units | Amortized Cost(2)(27) | Fair Value | % of Net Assets | ||||||||||||||||||||||||||||||||||||||
| Galway Borrower LLC(3)(4)(9)(22) | First lien senior secured delayed draw term loan | S+ | 9/2028 | ||||||||||||||||||||||||||||||||||||||||||||
| Integrity Marketing Acquisition, LLC(3)(4)(9) | First lien senior secured loan | S+ | 8/2028 | ||||||||||||||||||||||||||||||||||||||||||||
| Iris Specialty Acquisition LLC (dba Integrated Specialty Coverages)(3)(4)(9) | First lien senior secured loan | S+ | 11/2032 | ||||||||||||||||||||||||||||||||||||||||||||
| One, Inc. Software Corporation(3)(4)(9) | First lien senior secured loan | S+ | 12/2032 | ||||||||||||||||||||||||||||||||||||||||||||
| Simplicity Financial Marketing Group Holdings, Inc.(3)(4)(9)(22) | First lien senior secured loan | S+ | 12/2031 | ||||||||||||||||||||||||||||||||||||||||||||
| Trucordia Insurance Holdings, LLC(3)(4)(8) | Second lien senior secured loan | S+ | 6/2033 | ||||||||||||||||||||||||||||||||||||||||||||
| % | |||||||||||||||||||||||||||||||||||||||||||||||
| Internet & Direct Marketing Retail | |||||||||||||||||||||||||||||||||||||||||||||||
| Aurelia Netherlands B.V.(3)(4)(14)(31) | First lien senior secured EUR term loan | E+ | 5/2031 | € | |||||||||||||||||||||||||||||||||||||||||||
| % | |||||||||||||||||||||||||||||||||||||||||||||||
| IT Services | |||||||||||||||||||||||||||||||||||||||||||||||
| Flexera Software LLC(3)(4)(9) | First lien senior secured loan | S+ | 8/2032 | ||||||||||||||||||||||||||||||||||||||||||||
| Flexera Software LLC(3)(4)(13) | First lien senior secured EUR term loan | E+ | 8/2032 | € | |||||||||||||||||||||||||||||||||||||||||||
| Kaseya Inc.(3)(8) | First lien senior secured loan | S+ | 3/2032 | ||||||||||||||||||||||||||||||||||||||||||||
| Kaseya Inc.(3)(8) | Second lien senior secured loan | S+ | 3/2033 | ||||||||||||||||||||||||||||||||||||||||||||
| Severin Acquisition, LLC (dba PowerSchool)(3)(4)(8) | First lien senior secured loan | S+ | 10/2031 | ||||||||||||||||||||||||||||||||||||||||||||
| Severin Acquisition, LLC (dba PowerSchool)(3)(4)(8)(22) | First lien senior secured delayed draw term loan | S+ | 10/2031 | ||||||||||||||||||||||||||||||||||||||||||||
| Spaceship Purchaser, Inc. (dba Squarespace)(3)(4)(9) | First lien senior secured loan | S+ | 10/2031 | ||||||||||||||||||||||||||||||||||||||||||||
| % | |||||||||||||||||||||||||||||||||||||||||||||||
| Life Sciences Tools & Services | |||||||||||||||||||||||||||||||||||||||||||||||
| Bamboo US BidCo LLC(3)(4)(14) | First lien senior secured EUR term loan | E+ | 9/2030 | € | |||||||||||||||||||||||||||||||||||||||||||
| Bamboo US BidCo LLC(3)(4)(9) | First lien senior secured delayed draw term loan | S+ | 9/2030 | ||||||||||||||||||||||||||||||||||||||||||||
| Bamboo US BidCo LLC(3)(4)(8)(22) | First lien senior secured delayed draw term loan | S+ | 9/2030 | ||||||||||||||||||||||||||||||||||||||||||||
| Bracket Intermediate Holding Corp.(3)(4)(9) | First lien senior secured loan | S+ | 10/2031 | ||||||||||||||||||||||||||||||||||||||||||||
| Commander Buyer, Inc. (dba CenExel)(3)(4)(9) | First lien senior secured loan | S+ | 6/2032 | ||||||||||||||||||||||||||||||||||||||||||||
| Creek Parent, Inc. (dba Catalent)(3)(4)(8) | First lien senior secured loan | S+ | 12/2031 | ||||||||||||||||||||||||||||||||||||||||||||
| % | |||||||||||||||||||||||||||||||||||||||||||||||
| Media | |||||||||||||||||||||||||||||||||||||||||||||||
| Monotype Imaging Holdings Inc.(3)(4)(8)(22) | First lien senior secured loan | S+ | 2/2031 | ||||||||||||||||||||||||||||||||||||||||||||
| % | |||||||||||||||||||||||||||||||||||||||||||||||
| Multiline Retail | |||||||||||||||||||||||||||||||||||||||||||||||
| PDI TA Holdings, Inc.(3)(4)(9)(22) | First lien senior secured loan | S+ | 2/2031 | ||||||||||||||||||||||||||||||||||||||||||||
| % | |||||||||||||||||||||||||||||||||||||||||||||||
| Pharmaceuticals | |||||||||||||||||||||||||||||||||||||||||||||||
F-11
Blue Owl Technology Finance Corp.
Consolidated Schedule of Investments
As of December 31, 2025
(Amounts in thousands, except share amounts)
| Interest | |||||||||||||||||||||||||||||||||||||||||||||||
| Company(1)(25) | Investment | Ref. Rate | Cash | PIK | Maturity Date | Par / Units | Amortized Cost(2)(27) | Fair Value | % of Net Assets | ||||||||||||||||||||||||||||||||||||||
| Foundation Consumer Brands, LLC(3)(4)(9) | First lien senior secured loan | S+ | 2/2029 | ||||||||||||||||||||||||||||||||||||||||||||
| Pacific BidCo Inc.(3)(4)(10)(31) | First lien senior secured delayed draw term loan | S+ | 8/2029 | ||||||||||||||||||||||||||||||||||||||||||||
| % | |||||||||||||||||||||||||||||||||||||||||||||||
| Professional Services | |||||||||||||||||||||||||||||||||||||||||||||||
| BCTO WIW Holdings, Inc. (dba When I Work)(3)(4)(6) | Senior convertible notes | N/A | 8/2030 | ||||||||||||||||||||||||||||||||||||||||||||
| Certinia Inc.(3)(4)(9) | First lien senior secured loan | S+ | 8/2031 | ||||||||||||||||||||||||||||||||||||||||||||
| CloudPay, Inc.(3)(4)(9)(31) | First lien senior secured loan | S+ | 7/2029 | ||||||||||||||||||||||||||||||||||||||||||||
| Cornerstone OnDemand, Inc.(3)(4)(8) | Second lien senior secured loan | S+ | 10/2029 | ||||||||||||||||||||||||||||||||||||||||||||
| Gerson Lehrman Group, Inc.(3)(4)(9) | First lien senior secured loan | S+ | 12/2028 | ||||||||||||||||||||||||||||||||||||||||||||
| Proofpoint, Inc.(3)(9) | First lien senior secured loan | S+ | 8/2028 | ||||||||||||||||||||||||||||||||||||||||||||
| Proofpoint, Inc.(3)(4)(14) | Second lien senior secured loan | E+ | 12/2033 | € | |||||||||||||||||||||||||||||||||||||||||||
| Proofpoint, Inc.(3)(4)(9) | Second lien senior secured loan | S+ | 12/2033 | ||||||||||||||||||||||||||||||||||||||||||||
| Sensor Technology Topco, Inc. (dba Humanetics)(3)(4)(9) | First lien senior secured loan | S+ | 5/2028 | ||||||||||||||||||||||||||||||||||||||||||||
| Sensor Technology Topco, Inc. (dba Humanetics)(3)(4)(14) | First lien senior secured EUR term loan | E+ | 5/2028 | € | |||||||||||||||||||||||||||||||||||||||||||
| Sensor Technology Topco, Inc. (dba Humanetics)(3)(4)(14) | First lien senior secured EUR delayed draw term loan | E+ | 5/2028 | € | |||||||||||||||||||||||||||||||||||||||||||
| Sensor Technology Topco, Inc. (dba Humanetics)(3)(4)(9) | First lien senior secured delayed draw term loan | S+ | 5/2028 | ||||||||||||||||||||||||||||||||||||||||||||
| Sensor Technology Topco, Inc. (dba Humanetics)(3)(4)(8)(22) | First lien senior secured revolving loan | S+ | 5/2028 | ||||||||||||||||||||||||||||||||||||||||||||
| Sovos Compliance, LLC(3)(8) | First lien senior secured loan | S+ | 8/2029 | ||||||||||||||||||||||||||||||||||||||||||||
| Thunder Purchaser, Inc. (dba Vector Solutions)(3)(4)(9) | First lien senior secured loan | S+ | 6/2028 | ||||||||||||||||||||||||||||||||||||||||||||
| TK Operations Ltd (dba Travelperk, Inc.)(3)(4)(6)(31) | First lien senior secured loan | N/A | 5/2029 | ||||||||||||||||||||||||||||||||||||||||||||
| % | |||||||||||||||||||||||||||||||||||||||||||||||
| Real Estate Management & Development | |||||||||||||||||||||||||||||||||||||||||||||||
| RealPage, Inc.(3)(9) | First lien senior secured loan | S+ | 4/2028 | ||||||||||||||||||||||||||||||||||||||||||||
| % | |||||||||||||||||||||||||||||||||||||||||||||||
| Specialty Retail | |||||||||||||||||||||||||||||||||||||||||||||||
| McQueen Bidco PTY LTD. (dba Infomedia)(3)(4)(9)(31) | First lien senior secured loan | S+ | 12/2032 | ||||||||||||||||||||||||||||||||||||||||||||
| OECONNECTION LLC(3)(4)(8) | First lien senior secured loan | S+ | 12/2032 | ||||||||||||||||||||||||||||||||||||||||||||
| % | |||||||||||||||||||||||||||||||||||||||||||||||
| Systems Software | |||||||||||||||||||||||||||||||||||||||||||||||
| Acquia Inc.(3)(4)(9) | First lien senior secured loan | S+ | 10/2026 | ||||||||||||||||||||||||||||||||||||||||||||
| Activate Holdings (US) Corp. (dba Absolute Software)(3)(4)(9)(31) | First lien senior secured loan | S+ | 7/2030 | ||||||||||||||||||||||||||||||||||||||||||||
| Appfire Technologies, LLC(3)(4)(9)(22) | First lien senior secured loan | S+ | 3/2028 | ||||||||||||||||||||||||||||||||||||||||||||
| Arctic Wolf Networks, Inc.(3)(4)(9) | First lien senior secured loan | S+ | 2/2030 | ||||||||||||||||||||||||||||||||||||||||||||
| Arctic Wolf Networks, Inc.(3)(4)(6) | Senior convertible notes | N/A | 11/2030 | ||||||||||||||||||||||||||||||||||||||||||||
| Azurite Intermediate Holdings, Inc. (dba Alteryx, Inc.)(3)(4)(8) | First lien senior secured loan | S+ | 3/2031 | ||||||||||||||||||||||||||||||||||||||||||||
| Barracuda Parent, LLC(3)(9) | First lien senior secured loan | S+ | 8/2029 | ||||||||||||||||||||||||||||||||||||||||||||
F-12
Blue Owl Technology Finance Corp.
Consolidated Schedule of Investments
As of December 31, 2025
(Amounts in thousands, except share amounts)
| Interest | |||||||||||||||||||||||||||||||||||||||||||||||
| Company(1)(25) | Investment | Ref. Rate | Cash | PIK | Maturity Date | Par / Units | Amortized Cost(2)(27) | Fair Value | % of Net Assets | ||||||||||||||||||||||||||||||||||||||
| Barracuda Parent, LLC(3)(4)(9) | Second lien senior secured loan | S+ | 8/2030 | ||||||||||||||||||||||||||||||||||||||||||||
| Barracuda Parent, LLC(3)(4)(9) | First lien senior secured loan | S+ | 8/2029 | ||||||||||||||||||||||||||||||||||||||||||||
| Bayshore Intermediate #2, L.P. (dba Boomi)(3)(4)(9) | First lien senior secured loan | S+ | 10/2028 | ||||||||||||||||||||||||||||||||||||||||||||
| Bayshore Intermediate #2, L.P. (dba Boomi)(3)(4)(9)(22) | First lien senior secured revolving loan | S+ | 10/2027 | ||||||||||||||||||||||||||||||||||||||||||||
| Circle Internet Services, Inc.(4)(29) | Subordinated Convertible Security | N/A | N/A | ||||||||||||||||||||||||||||||||||||||||||||
| ConnectWise, LLC(3)(9) | First lien senior secured loan | S+ | 9/2028 | ||||||||||||||||||||||||||||||||||||||||||||
| Crewline Buyer, Inc. (dba New Relic)(3)(4)(9) | First lien senior secured loan | S+ | 11/2030 | ||||||||||||||||||||||||||||||||||||||||||||
| Databricks, Inc.(3)(4)(8) | First lien senior secured loan | S+ | 1/2031 | ||||||||||||||||||||||||||||||||||||||||||||
| Delinea Buyer, Inc. (f/k/a Centrify)(3)(4)(9) | First lien senior secured loan | S+ | 3/2028 | ||||||||||||||||||||||||||||||||||||||||||||
| Delta TopCo, Inc. (dba Infoblox, Inc.)(3)(8) | Second lien senior secured loan | S+ | 11/2030 | ||||||||||||||||||||||||||||||||||||||||||||
| Forescout Technologies, Inc.(3)(4)(9) | First lien senior secured loan | S+ | 5/2032 | ||||||||||||||||||||||||||||||||||||||||||||
| H&F Opportunities LUX III S.À R.L (dba Checkmarx)(3)(4)(8)(31) | First lien senior secured loan | S+ | 4/2027 | ||||||||||||||||||||||||||||||||||||||||||||
| LogRhythm, Inc.(3)(4)(9) | First lien senior secured loan | S+ | 7/2029 | ||||||||||||||||||||||||||||||||||||||||||||
| Securonix, Inc.(3)(4)(9) | First lien senior secured loan | S+ | 4/2029 | ||||||||||||||||||||||||||||||||||||||||||||
| Sitecore Holding III A/S(3)(4)(14) | First lien senior secured EUR term loan | E+ | 3/2029 | € | |||||||||||||||||||||||||||||||||||||||||||
| Sitecore Holding III A/S(3)(4)(9) | First lien senior secured loan | S+ | 3/2029 | ||||||||||||||||||||||||||||||||||||||||||||
| Sitecore USA, Inc.(3)(4)(9) | First lien senior secured loan | S+ | 3/2029 | ||||||||||||||||||||||||||||||||||||||||||||
| Sophos Holdings, LLC(3)(8)(31) | First lien senior secured loan | S+ | 3/2027 | ||||||||||||||||||||||||||||||||||||||||||||
| Talon MidCo 2 Limited(3)(4)(8)(31) | First lien senior secured loan | S+ | 8/2028 | ||||||||||||||||||||||||||||||||||||||||||||
| Tricentis Operations Holdings, Inc.(3)(4)(9) | First lien senior secured loan | S+ | 2/2032 | ||||||||||||||||||||||||||||||||||||||||||||
| % | |||||||||||||||||||||||||||||||||||||||||||||||
| Wireless Telecommunication Services | |||||||||||||||||||||||||||||||||||||||||||||||
| CCI BUYER, INC. (dba Consumer Cellular)(3)(4)(9) | First lien senior secured loan | S+ | 5/2032 | ||||||||||||||||||||||||||||||||||||||||||||
| % | |||||||||||||||||||||||||||||||||||||||||||||||
| Total non-controlled/non-affiliated debt investments | $ | $ | % | ||||||||||||||||||||||||||||||||||||||||||||
| Total non-controlled/non-affiliated misc. debt commitments(22)(23)(Note 8) | $ | ( | $ | ( | % | ||||||||||||||||||||||||||||||||||||||||||
| Total non-controlled/non-affiliated portfolio company debt investments | $ | $ | % | ||||||||||||||||||||||||||||||||||||||||||||
| Equity Investments | |||||||||||||||||||||||||||||||||||||||||||||||
| Aerospace & Defense | |||||||||||||||||||||||||||||||||||||||||||||||
| Space Exploration Technologies Corp.(3)(4)(29)(30) | Class A Common Stock | N/A | N/A | ||||||||||||||||||||||||||||||||||||||||||||
| Space Exploration Technologies Corp.(3)(4)(29)(30) | Class C Common Stock | N/A | N/A | ||||||||||||||||||||||||||||||||||||||||||||
| % | |||||||||||||||||||||||||||||||||||||||||||||||
| Application Software | |||||||||||||||||||||||||||||||||||||||||||||||
| 6Sense Insights, Inc.(3)(4)(29)(30) | Series E-1 Preferred Stock | N/A | N/A | ||||||||||||||||||||||||||||||||||||||||||||
| Alpha Partners Technology Merger Corp(29)(30)(31) | Common stock | N/A | N/A | ||||||||||||||||||||||||||||||||||||||||||||
F-13
Blue Owl Technology Finance Corp.
Consolidated Schedule of Investments
As of December 31, 2025
(Amounts in thousands, except share amounts)
| Interest | |||||||||||||||||||||||||||||||||||||||||||||||
| Company(1)(25) | Investment | Ref. Rate | Cash | PIK | Maturity Date | Par / Units | Amortized Cost(2)(27) | Fair Value | % of Net Assets | ||||||||||||||||||||||||||||||||||||||
| Alpha Partners Technology Merger Corp(29)(30)(31) | Warrants | N/A | N/A | ||||||||||||||||||||||||||||||||||||||||||||
| AlphaSense, LLC(3)(4)(29)(30) | Series E Preferred Shares | N/A | N/A | ||||||||||||||||||||||||||||||||||||||||||||
| Bird Holding B.V. (fka MessageBird Holding B.V.)(3)(4)(29)(30)(31) | Extended Series C Warrants | N/A | N/A | ||||||||||||||||||||||||||||||||||||||||||||
| Diligent Preferred Issuer, Inc. (dba Diligent Corporation)(3)(4)(6)(30) | Preferred Stock | N/A | N/A | ||||||||||||||||||||||||||||||||||||||||||||
| EShares, Inc. (dba Carta)(4)(29)(30) | Series E Preferred Stock | N/A | N/A | ||||||||||||||||||||||||||||||||||||||||||||
| Insight CP (Blocker) Holdings, L.P. (dba CivicPlus, LLC)(3)(4)(29)(30)(31) | LP Interest | N/A | N/A | $ | |||||||||||||||||||||||||||||||||||||||||||
| Nylas, Inc.(4)(29)(30) | Series C Preferred Stock | N/A | N/A | ||||||||||||||||||||||||||||||||||||||||||||
| Project Alpine Co-Invest Fund, LP(3)(4)(29)(30)(31) | LP Interest | N/A | N/A | $ | |||||||||||||||||||||||||||||||||||||||||||
| Saturn Ultimate, Inc.(3)(4)(29)(30) | Common stock | N/A | N/A | ||||||||||||||||||||||||||||||||||||||||||||
| Simpler Postage, Inc. (dba Easypost)(3)(4)(29)(30) | Warrants | N/A | N/A | ||||||||||||||||||||||||||||||||||||||||||||
| Valor Compute Infrastructure L.P.(3)(4)(22)(29)(30)(31) | LP Interest | N/A | N/A | $ | |||||||||||||||||||||||||||||||||||||||||||
| VCI Intermediate TopCo 1 LLC(3)(4)(29)(30)(31) | Class B Units | N/A | N/A | $ | |||||||||||||||||||||||||||||||||||||||||||
| Zoro TopCo, L.P.(3)(4)(29)(30) | Class A Common Units | N/A | N/A | ||||||||||||||||||||||||||||||||||||||||||||
| Zoro TopCo, Inc.(3)(4)(9)(30) | Series A Preferred Equity | S+ | N/A | ||||||||||||||||||||||||||||||||||||||||||||
| % | |||||||||||||||||||||||||||||||||||||||||||||||
| Capital Markets | |||||||||||||||||||||||||||||||||||||||||||||||
| Acorns Grow Incorporated(3)(4)(6)(30)(31) | Series F Preferred Stock | N/A | N/A | ||||||||||||||||||||||||||||||||||||||||||||
| % | |||||||||||||||||||||||||||||||||||||||||||||||
| Commercial Services & Supplies | |||||||||||||||||||||||||||||||||||||||||||||||
| Rome Topco Holdings, LLC (dba SimpliSafe)(3)(4)(29)(30) | Class A Units | N/A | N/A | ||||||||||||||||||||||||||||||||||||||||||||
| Rome Topco Holdings, LLC (dba SimpliSafe)(3)(4)(29)(30) | Class B Units | N/A | N/A | ||||||||||||||||||||||||||||||||||||||||||||
| % | |||||||||||||||||||||||||||||||||||||||||||||||
| Construction & Engineering | |||||||||||||||||||||||||||||||||||||||||||||||
| Dodge Construction Network Holdings, L.P.(3)(4)(29)(30) | Class A-2 Common Units | N/A | N/A | ||||||||||||||||||||||||||||||||||||||||||||
| Dodge Construction Network Holdings, L.P.(3)(4)(6)(30) | Series A Preferred Units | N/A | N/A | ||||||||||||||||||||||||||||||||||||||||||||
| % | |||||||||||||||||||||||||||||||||||||||||||||||
| Diversified Consumer Services | |||||||||||||||||||||||||||||||||||||||||||||||
| SLA Eclipse Co-Invest, L.P.(29)(30)(31) | LP Interest | N/A | N/A | $ | |||||||||||||||||||||||||||||||||||||||||||
| % | |||||||||||||||||||||||||||||||||||||||||||||||
| Diversified Financial Services | |||||||||||||||||||||||||||||||||||||||||||||||
| Amergin Asset Management, LLC(3)(4)(29)(30) | Specialty finance equity investment | N/A | N/A | ||||||||||||||||||||||||||||||||||||||||||||
| Brex, Inc.(3)(4)(29)(30) | Class A Units | N/A | N/A | ||||||||||||||||||||||||||||||||||||||||||||
| Brex, Inc.(4)(29)(30) | Preferred Stock | N/A | N/A | ||||||||||||||||||||||||||||||||||||||||||||
| Juniper Square, Inc.(3)(4)(29)(30) | Warrants | N/A | N/A | ||||||||||||||||||||||||||||||||||||||||||||
| % | |||||||||||||||||||||||||||||||||||||||||||||||
| Health Care Equipment & Supplies | |||||||||||||||||||||||||||||||||||||||||||||||
F-14
Blue Owl Technology Finance Corp.
Consolidated Schedule of Investments
As of December 31, 2025
(Amounts in thousands, except share amounts)
| Interest | |||||||||||||||||||||||||||||||||||||||||||||||
| Company(1)(25) | Investment | Ref. Rate | Cash | PIK | Maturity Date | Par / Units | Amortized Cost(2)(27) | Fair Value | % of Net Assets | ||||||||||||||||||||||||||||||||||||||
| KPCI Co-Invest 2, L.P.(3)(4)(29)(30)(31) | Class A Units | N/A | N/A | ||||||||||||||||||||||||||||||||||||||||||||
| % | |||||||||||||||||||||||||||||||||||||||||||||||
| Health Care Technology | |||||||||||||||||||||||||||||||||||||||||||||||
| BEHP Co-Investor II, L.P.(3)(4)(29)(30)(31) | LP Interest | N/A | N/A | $ | |||||||||||||||||||||||||||||||||||||||||||
| Minerva Holdco, Inc.(3)(4)(6)(30) | Senior A Preferred Stock | N/A | N/A | ||||||||||||||||||||||||||||||||||||||||||||
| ModMed Software Midco Holdings, Inc. (dba ModMed)(3)(4)(6)(30) | Series A Preferred Units | N/A | N/A | ||||||||||||||||||||||||||||||||||||||||||||
| Orange Blossom Parent, Inc.(3)(4)(29)(30) | Common Units | N/A | N/A | ||||||||||||||||||||||||||||||||||||||||||||
| WP Irving Co-Invest, L.P.(3)(4)(29)(30)(31) | Partnership Units | N/A | N/A | ||||||||||||||||||||||||||||||||||||||||||||
| % | |||||||||||||||||||||||||||||||||||||||||||||||
| Health Care Providers & Services | |||||||||||||||||||||||||||||||||||||||||||||||
| KWOL Acquisition, Inc. (dba Worldwide Clinical Trials)(3)(4)(29)(30) | Class A Interest | N/A | N/A | ||||||||||||||||||||||||||||||||||||||||||||
| Romulus Intermediate Holdings 1 Inc. (dba PetVet Care Centers)(3)(4)(6)(30) | Series A Preferred Stock | N/A | N/A | ||||||||||||||||||||||||||||||||||||||||||||
| % | |||||||||||||||||||||||||||||||||||||||||||||||
| Hotels, Restaurants & Leisure | |||||||||||||||||||||||||||||||||||||||||||||||
| VEPF Torreys Aggregator, LLC (dba MINDBODY, Inc.)(3)(4)(6)(30) | Series A Preferred Stock | N/A | N/A | ||||||||||||||||||||||||||||||||||||||||||||
| % | |||||||||||||||||||||||||||||||||||||||||||||||
| Insurance | |||||||||||||||||||||||||||||||||||||||||||||||
| Accelerate Topco Holdings, LLC(3)(4)(29)(30) | Common Units | N/A | N/A | ||||||||||||||||||||||||||||||||||||||||||||
| % | |||||||||||||||||||||||||||||||||||||||||||||||
| Internet & Direct Marketing Retail | |||||||||||||||||||||||||||||||||||||||||||||||
| Kajabi Holdings, LLC(4)(29)(30) | Senior Preferred Class D Units | N/A | N/A | ||||||||||||||||||||||||||||||||||||||||||||
| Linked Store Cayman Ltd. (dba Nuvemshop)(3)(4)(29)(30)(31) | Series E Preferred Stock | N/A | N/A | ||||||||||||||||||||||||||||||||||||||||||||
| % | |||||||||||||||||||||||||||||||||||||||||||||||
| IT Services | |||||||||||||||||||||||||||||||||||||||||||||||
| JumpCloud, Inc.(4)(29)(30) | Series B Preferred Stock | N/A | N/A | ||||||||||||||||||||||||||||||||||||||||||||
| JumpCloud, Inc.(4)(29)(30) | Series F Preferred Stock | N/A | N/A | ||||||||||||||||||||||||||||||||||||||||||||
| Nscale Global Holdings Limited(3)(4)(29)(30)(31) | Preferred equity | N/A | N/A | $ | |||||||||||||||||||||||||||||||||||||||||||
| Nscale Global Holdings Limited(3)(4)(29)(30)(31) | Series B Preferred Shares | N/A | N/A | ||||||||||||||||||||||||||||||||||||||||||||
| Knockout Intermediate Holdings I Inc. (dba Kaseya Inc.)(3)(4)(10)(30) | Perpetual Preferred Stock | S+ | N/A | ||||||||||||||||||||||||||||||||||||||||||||
| Replicated, Inc.(4)(29)(30) | Series C Preferred Stock | N/A | N/A | ||||||||||||||||||||||||||||||||||||||||||||
| WMC Bidco, Inc. (dba West Monroe)(3)(4)(6)(30) | Senior Preferred Stock | N/A | N/A | ||||||||||||||||||||||||||||||||||||||||||||
| % | |||||||||||||||||||||||||||||||||||||||||||||||
| Life Sciences Tools & Services | |||||||||||||||||||||||||||||||||||||||||||||||
| Baypine Commander Co-Invest, LP(3)(4)(29)(30)(31) | LP Interest | N/A | N/A | $ | |||||||||||||||||||||||||||||||||||||||||||
| % | |||||||||||||||||||||||||||||||||||||||||||||||
| Pharmaceuticals | |||||||||||||||||||||||||||||||||||||||||||||||
F-15
Blue Owl Technology Finance Corp.
Consolidated Schedule of Investments
As of December 31, 2025
(Amounts in thousands, except share amounts)
| Interest | |||||||||||||||||||||||||||||||||||||||||||||||
| Company(1)(25) | Investment | Ref. Rate | Cash | PIK | Maturity Date | Par / Units | Amortized Cost(2)(27) | Fair Value | % of Net Assets | ||||||||||||||||||||||||||||||||||||||
| XOMA Corporation(3)(4)(29)(30) | Warrants | N/A | N/A | ||||||||||||||||||||||||||||||||||||||||||||
| % | |||||||||||||||||||||||||||||||||||||||||||||||
| Professional Services | |||||||||||||||||||||||||||||||||||||||||||||||
| CloudPay, Inc.(3)(4)(6)(30)(31) | Series E Preferred Stock | N/A | N/A | ||||||||||||||||||||||||||||||||||||||||||||
| Sunshine Software Holdings, Inc. (dba Cornerstone OnDemand, Inc.)(3)(4)(6)(30) | Series A Preferred Stock | N/A | N/A | ||||||||||||||||||||||||||||||||||||||||||||
| Thunder Topco L.P. (dba Vector Solutions)(3)(4)(29)(30) | Common Units | N/A | N/A | ||||||||||||||||||||||||||||||||||||||||||||
| TravelPerk, Inc.(3)(4)(29)(30)(31) | Warrants | N/A | N/A | ||||||||||||||||||||||||||||||||||||||||||||
| Vestwell Holdings Inc.(3)(4)(29)(30) | Series D Preferred Stock | N/A | N/A | ||||||||||||||||||||||||||||||||||||||||||||
| % | |||||||||||||||||||||||||||||||||||||||||||||||
| Road & Rail | |||||||||||||||||||||||||||||||||||||||||||||||
| Bolt Technology OÜ(4)(29)(30)(31) | Preferred Stock | N/A | N/A | ||||||||||||||||||||||||||||||||||||||||||||
| % | |||||||||||||||||||||||||||||||||||||||||||||||
| Systems Software | |||||||||||||||||||||||||||||||||||||||||||||||
| Algolia, Inc.(4)(29)(30) | Series C Preferred Stock | N/A | N/A | ||||||||||||||||||||||||||||||||||||||||||||
| Algolia, Inc.(4)(29)(30) | Series D Preferred Stock | N/A | N/A | ||||||||||||||||||||||||||||||||||||||||||||
| Arctic Wolf Networks, Inc.(4)(29)(30) | Preferred Stock | N/A | N/A | ||||||||||||||||||||||||||||||||||||||||||||
| Axonius, Inc.(4)(29)(30) | Series E Preferred Stock | N/A | N/A | ||||||||||||||||||||||||||||||||||||||||||||
| Brooklyn Lender Co-Invest 2, L.P. (dba Boomi)(3)(4)(29)(30) | Common Units | N/A | N/A | ||||||||||||||||||||||||||||||||||||||||||||
| Chrome Investors LP(3)(4)(22)(29)(30)(31) | LP Interest | N/A | N/A | $ | |||||||||||||||||||||||||||||||||||||||||||
| Circle Internet Services, Inc.(4)(29)(30) | Warrants | N/A | N/A | ||||||||||||||||||||||||||||||||||||||||||||
| Circle Internet Services, Inc.(4)(29)(30) | Series D Preferred Stock | N/A | N/A | ||||||||||||||||||||||||||||||||||||||||||||
| Circle Internet Services, Inc.(4)(29)(30) | Series E Preferred Stock | N/A | N/A | ||||||||||||||||||||||||||||||||||||||||||||
| Circle Internet Services, Inc.(4)(29)(30) | Series F Preferred Stock | N/A | N/A | ||||||||||||||||||||||||||||||||||||||||||||
| Elliott Alto Co-Investor Aggregator L.P.(3)(4)(29)(30)(31) | LP Interest | N/A | N/A | $ | |||||||||||||||||||||||||||||||||||||||||||
| Excalibur CombineCo, L.P.(3)(4)(29)(30) | Class A Units | N/A | N/A | ||||||||||||||||||||||||||||||||||||||||||||
| Halo Purchaser, LLC(3)(4)(6)(30) | Class B PIK Preferred Equity | N/A | N/A | ||||||||||||||||||||||||||||||||||||||||||||
| Halo Purchaser, LLC(3)(4)(29)(30) | Class H Warrant Units | N/A | N/A | ||||||||||||||||||||||||||||||||||||||||||||
| HARNESS INC.(4)(29)(30)(32) | Series D Preferred Stock | N/A | N/A | ||||||||||||||||||||||||||||||||||||||||||||
| Illumio, Inc.(4)(29)(30) | Common stock | N/A | N/A | ||||||||||||||||||||||||||||||||||||||||||||
| Illumio, Inc.(4)(29)(30) | Series F Preferred Stock | N/A | N/A | ||||||||||||||||||||||||||||||||||||||||||||
| Project Hotel California Co-Invest Fund, L.P.(3)(29)(30)(31) | LP Interest | N/A | N/A | $ | |||||||||||||||||||||||||||||||||||||||||||
| Veeam Software Group(3)(4)(29)(30) | Series C Preferred Shares | N/A | N/A | ||||||||||||||||||||||||||||||||||||||||||||
| % | |||||||||||||||||||||||||||||||||||||||||||||||
| Thrifts & Mortgage Finance | |||||||||||||||||||||||||||||||||||||||||||||||
| Blend Labs, Inc.(3)(4)(29)(30) | Warrants | N/A | N/A | ||||||||||||||||||||||||||||||||||||||||||||
| % | |||||||||||||||||||||||||||||||||||||||||||||||
| Total non-controlled/non-affiliated portfolio company equity investments | $ | $ | % | ||||||||||||||||||||||||||||||||||||||||||||
| Total non-controlled/non-affiliated portfolio company investments | $ | $ | % | ||||||||||||||||||||||||||||||||||||||||||||
F-16
Blue Owl Technology Finance Corp.
Consolidated Schedule of Investments
As of December 31, 2025
(Amounts in thousands, except share amounts)
| Interest | |||||||||||||||||||||||||||||||||||||||||||||||
| Company(1)(25) | Investment | Ref. Rate | Cash | PIK | Maturity Date | Par / Units | Amortized Cost(2)(27) | Fair Value | % of Net Assets | ||||||||||||||||||||||||||||||||||||||
| Non-controlled/affiliated portfolio company investments | |||||||||||||||||||||||||||||||||||||||||||||||
| Debt Investments(7) | |||||||||||||||||||||||||||||||||||||||||||||||
| Diversifed Financial Services | |||||||||||||||||||||||||||||||||||||||||||||||
| AAM Series 1.1 Rail and Domestic Intermodal Feeder, LLC(3)(4)(6)(24)(31) | Specialty finance debt investment | N/A | 7/2030 | ||||||||||||||||||||||||||||||||||||||||||||
| AAM Series 2.1 Aviation Feeder, LLC(3)(4)(6)(24)(31) | Specialty finance debt investment | N/A | 11/2030 | ||||||||||||||||||||||||||||||||||||||||||||
| % | |||||||||||||||||||||||||||||||||||||||||||||||
| Insurance | |||||||||||||||||||||||||||||||||||||||||||||||
| Coherent Group Inc.(3)(4)(6)(24)(31) | Convertible notes | N/A | 3/2027 | ||||||||||||||||||||||||||||||||||||||||||||
| % | |||||||||||||||||||||||||||||||||||||||||||||||
| Internet & Direct Marketing Retail | |||||||||||||||||||||||||||||||||||||||||||||||
| Walker Edison Furniture Company LLC(3)(4)(9)(22)(24)(28)(29) | First lien senior secured loan | S+ | 3/2027 | ||||||||||||||||||||||||||||||||||||||||||||
| Walker Edison Furniture Company LLC(3)(4)(6)(22)(24)(28)(29) | First lien senior secured loan | N/A | 2/2026 | ||||||||||||||||||||||||||||||||||||||||||||
| Walker Edison Furniture Company LLC(3)(4)(9)(22)(24)(28)(29) | First lien senior secured revolving loan | S+ | 3/2027 | ||||||||||||||||||||||||||||||||||||||||||||
| % | |||||||||||||||||||||||||||||||||||||||||||||||
| IT Services | |||||||||||||||||||||||||||||||||||||||||||||||
| Pluralsight, LLC(3)(4)(9)(24) | First lien senior secured loan | S+ | 8/2029 | ||||||||||||||||||||||||||||||||||||||||||||
| Pluralsight, LLC(3)(4)(9)(24)(28)(29) | First lien senior secured loan | S+ | 8/2029 | ||||||||||||||||||||||||||||||||||||||||||||
| % | |||||||||||||||||||||||||||||||||||||||||||||||
| Total non-controlled/affiliated debt investments | $ | $ | % | ||||||||||||||||||||||||||||||||||||||||||||
| Total non-controlled/affiliated misc. debt commitments(22)(23)(Note 8) | ( | % | |||||||||||||||||||||||||||||||||||||||||||||
| Total non-controlled/affiliated portfolio company debt investments | $ | $ | % | ||||||||||||||||||||||||||||||||||||||||||||
| Equity Investments | |||||||||||||||||||||||||||||||||||||||||||||||
| Asset Based Lending and Fund Finance | |||||||||||||||||||||||||||||||||||||||||||||||
| Blue Owl Cross-Strategy Opportunities LLC(3)(5)(24)(26)(30)(31)(34) | Specialty finance equity investment | N/A | N/A | $ | |||||||||||||||||||||||||||||||||||||||||||
| % | |||||||||||||||||||||||||||||||||||||||||||||||
| Diversified Financial Services | |||||||||||||||||||||||||||||||||||||||||||||||
| AAM Series 1.1 Rail and Domestic Intermodal Feeder, LLC(3)(4)(22)(24)(29)(30)(31) | Specialty finance equity investment | N/A | N/A | ||||||||||||||||||||||||||||||||||||||||||||
| AAM Series 2.1 Aviation Feeder, LLC(3)(4)(24)(29)(30)(31) | Specialty finance equity investment | N/A | N/A | ||||||||||||||||||||||||||||||||||||||||||||
| % | |||||||||||||||||||||||||||||||||||||||||||||||
| Insurance | |||||||||||||||||||||||||||||||||||||||||||||||
| Coherent Group Inc.(4)(24)(29)(30)(31) | Series B Preferred Shares | N/A | N/A | ||||||||||||||||||||||||||||||||||||||||||||
| Fifth Season Investments LLC(3)(4)(24)(30) | Specialty finance equity investment | N/A | N/A | ||||||||||||||||||||||||||||||||||||||||||||
| % | |||||||||||||||||||||||||||||||||||||||||||||||
| Internet & Direct Marketing Retail | |||||||||||||||||||||||||||||||||||||||||||||||
| Signifyd Inc.(4)(6)(24)(30) | Preferred equity | N/A | N/A | ||||||||||||||||||||||||||||||||||||||||||||
F-17
Blue Owl Technology Finance Corp.
Consolidated Schedule of Investments
As of December 31, 2025
(Amounts in thousands, except share amounts)
| Interest | |||||||||||||||||||||||||||||||||||||||||||||||
| Company(1)(25) | Investment | Ref. Rate | Cash | PIK | Maturity Date | Par / Units | Amortized Cost(2)(27) | Fair Value | % of Net Assets | ||||||||||||||||||||||||||||||||||||||
| Walker Edison Holdco LLC(3)(4)(24)(29)(30) | Common Units | N/A | N/A | ||||||||||||||||||||||||||||||||||||||||||||
| % | |||||||||||||||||||||||||||||||||||||||||||||||
| IT Services | |||||||||||||||||||||||||||||||||||||||||||||||
| Paradigmatic Holdco LLC (dba Pluralsight)(3)(4)(24)(29)(30) | Common stock | N/A | N/A | ||||||||||||||||||||||||||||||||||||||||||||
| % | |||||||||||||||||||||||||||||||||||||||||||||||
| Pharmaceuticals | |||||||||||||||||||||||||||||||||||||||||||||||
| LSI Financing 1 DAC(3)(4)(24)(30)(31) | Specialty finance equity investment | N/A | N/A | $ | |||||||||||||||||||||||||||||||||||||||||||
| LSI Financing LLC(3)(5)(22)(24)(29)(30)(31) | Specialty finance equity investment | N/A | N/A | $ | |||||||||||||||||||||||||||||||||||||||||||
| % | |||||||||||||||||||||||||||||||||||||||||||||||
| Systems Software | |||||||||||||||||||||||||||||||||||||||||||||||
| Help HP SCF Investor, LP(3)(4)(24)(29)(30) | LP Interest | N/A | N/A | $ | |||||||||||||||||||||||||||||||||||||||||||
| % | |||||||||||||||||||||||||||||||||||||||||||||||
| Total non-controlled/affiliated portfolio company equity investments | $ | $ | % | ||||||||||||||||||||||||||||||||||||||||||||
| Total non-controlled/affiliated portfolio company investments | $ | $ | % | ||||||||||||||||||||||||||||||||||||||||||||
| Controlled/affiliated portfolio company investments | |||||||||||||||||||||||||||||||||||||||||||||||
| Equity Investments | |||||||||||||||||||||||||||||||||||||||||||||||
| Diversified Financial Services | |||||||||||||||||||||||||||||||||||||||||||||||
| Revolut Ribbit Holdings, LLC(4)(24)(29)(30)(31) | LLC Interest | N/A | N/A | ||||||||||||||||||||||||||||||||||||||||||||
| % | |||||||||||||||||||||||||||||||||||||||||||||||
| Joint ventures | |||||||||||||||||||||||||||||||||||||||||||||||
| Blue Owl Credit SLF LLC(3)(5)(24)(26)(30)(31) | LLC Interest | N/A | N/A | $ | |||||||||||||||||||||||||||||||||||||||||||
| Blue Owl Leasing LLC(3)(5)(24)(26)(30)(31) | LLC Interest | N/A | N/A | $ | |||||||||||||||||||||||||||||||||||||||||||
| Stripe Blue Owl Holdings LLC(3)(5)(24)(26)(29)(30)(31) | LLC Interest | N/A | N/A | $ | |||||||||||||||||||||||||||||||||||||||||||
| % | |||||||||||||||||||||||||||||||||||||||||||||||
| Total controlled/affiliated portfolio company equity investments | $ | $ | % | ||||||||||||||||||||||||||||||||||||||||||||
| Total controlled/affiliated portfolio company investments | $ | $ | % | ||||||||||||||||||||||||||||||||||||||||||||
| Total Investments | $ | $ | % | ||||||||||||||||||||||||||||||||||||||||||||
| Interest Rate Swaps as of December 31, 2025 | |||||||||||||||||||||||||||||||||||||||||||||||||||||
| Company Receives | Company Pays | Maturity Date | Notional Amount | Fair Value | Upfront Payments/Receipts | Change in Unrealized Appreciation / (Depreciation) | Hedged Instrument | Footnote Reference | |||||||||||||||||||||||||||||||||||||||||||||
Interest rate swap(a) | S + | 3/4/2029 | April 2029 Notes | Note 5 | |||||||||||||||||||||||||||||||||||||||||||||||||
Interest rate swap(b) | S + | 2/15/2028 | March 2028 Notes | Note 5 | |||||||||||||||||||||||||||||||||||||||||||||||||
| Total | $ | $ | $ | ||||||||||||||||||||||||||||||||||||||||||||||||||
(a) The Company has an International Swaps and Derivatives Association (“ISDA”) agreement with Goldman Sachs Bank USA.
(b) The Company has an International Swaps and Derivatives Association (“ISDA”) agreement with SMBC Capital Markets, Inc.
F-18
Blue Owl Technology Finance Corp.
Consolidated Schedule of Investments
As of December 31, 2025
(Amounts in thousands, except share amounts)
| Forward Contracts as of December 31, 2025 | |||||||||||||||||||||||||||||
| Notional Amount to be Purchased | Notional Amount to be Sold | Counterparty | Settlement Date | Change in Unrealized Appreciation / (Depreciation) | |||||||||||||||||||||||||
| Foreign currency forward contract | $ | £ | Goldman Sachs Bank USA | 1/20/2026 | $ | ( | |||||||||||||||||||||||
| Foreign currency forward contract | $ | £ | SMBC Capital Markets, Inc. | 1/20/2026 | ( | ||||||||||||||||||||||||
| Foreign currency forward contract | $ | € | SMBC Capital Markets, Inc. | 7/17/2026 | |||||||||||||||||||||||||
| Foreign currency forward contract | $ | € | Goldman Sachs Bank USA | 7/17/2026 | |||||||||||||||||||||||||
| Foreign currency forward contract | $ | € | SMBC Capital Markets, Inc. | 7/17/2026 | ( | ||||||||||||||||||||||||
| Foreign currency forward contract | $ | A$ | Goldman Sachs Bank USA | 1/20/2026 | ( | ||||||||||||||||||||||||
| Total | $ | ( | |||||||||||||||||||||||||||
(1)Certain portfolio company investments are subject to contractual restrictions on sales. Refer to footnote 30 for additional information on our restricted securities.
(2)The amortized cost represents the original cost adjusted for the amortization or accretion of premium or discount, as applicable, on debt investments using the effective interest method.
(3)Represents co-investment made with the Company’s affiliates in accordance with the terms of an order for exemptive relief that an affiliate of the Company’s investment adviser received from the U.S. Securities and Exchange Commission. See “Note 3 — Agreements and Related Party Transactions”.
(4)These investments were valued using unobservable inputs and are considered Level 3 investments.
(5)Investment measured at net asset value (“NAV”).
(6)Contains a fixed-rate structure.
(7)Unless otherwise indicated, loan contains a variable rate structure and may be subject to an interest rate floor. Variable rate loans bear interest at a rate that may be determined by reference to either the Secured Overnight Financing Rate (“SOFR” or “S,” which can include one-, three-, six- or twelve-month SOFR), Euro Interbank Offered Rate (“EURIBOR” or “E”, which can include one-, three- or six-month EURIBOR), SONIA (“SONIA” or “SA”), Australian Bank Bill Swap Bid Rate (“BBSY” or “BB”) (which can include one-, three-, or six-month BBSY) or an alternate base rate (which can include the Federal Funds Effective Rate or the Prime Rate), at the borrower’s option, and which reset periodically based on the terms of the loan agreement.
(8)The interest rate on these loans is subject to 1 month SOFR, which as of December 31, 2025 was 3.69%.
(9)The interest rate on these loans is subject to 3 month SOFR, which as of December 31, 2025 was 3.65%.
(10)The interest rate on these loans is subject to 6 month SOFR, which as of December 31, 2025 was 3.57%.
(11)The interest rate on these loans is subject to 12 month SOFR, which as of December 31, 2025 was 3.42%.
(12)The interest rate on these loans is subject to Prime, which as of December 31, 2025 was 6.75% .
(13)The interest rate on these loans is subject to 1 month EURIBOR, which as of December 31, 2025 was 1.94%.
(14)The interest rate on these loans is subject to 3 month EURIBOR, which as of December 31, 2025 was 2.03%.
(15)Reserved.
(16)Reserved.
(17)The interest rate on this loan is subject to 3 month BBSY, which as of December 31, 2025 was 3.74%.
(18)Reserved.
(19)The interest rate on these loans is subject to SONIA, which as of December 31, 2025 was 3.73%.
(20)Reserved.
(21)Reserved.
(22)Position or portion thereof is a partially unfunded debt or equity commitment. See below for more information on the Company’s commitments. See “Note 8—Commitments and Contingencies”.
| Unfunded | ||||||||||||||||||||||||||||||||
| Portfolio Company | Commitment Type | Commitment Expiration Date | Funded Commitment | Commitment | Fair Value(23) | |||||||||||||||||||||||||||
| Non-controlled/non-affiliated - debt commitments | ||||||||||||||||||||||||||||||||
| Aerosmith Bidco 1 Limited (dba Audiotonix) | First lien senior secured delayed draw term loan | 7/2027 | $ | $ | $ | |||||||||||||||||||||||||||
| AI Titan Parent, Inc. (dba Prometheus Group) | First lien senior secured delayed draw term loan | 9/2026 | ||||||||||||||||||||||||||||||
| AlphaSense, Inc. | First lien senior secured delayed draw term loan | 6/2029 | ( | |||||||||||||||||||||||||||||
| AmeriLife Holdings LLC | First lien senior secured delayed draw term loan | 6/2026 | ||||||||||||||||||||||||||||||
| AmeriLife Holdings LLC | First lien senior secured delayed draw term loan | 2/2027 | ( | |||||||||||||||||||||||||||||
F-19
Blue Owl Technology Finance Corp.
Consolidated Schedule of Investments
As of December 31, 2025
(Amounts in thousands, except share amounts)
| Unfunded | ||||||||||||||||||||||||||||||||
| Portfolio Company | Commitment Type | Commitment Expiration Date | Funded Commitment | Commitment | Fair Value(23) | |||||||||||||||||||||||||||
| Appfire Technologies, LLC | First lien senior secured delayed draw term loan | 6/2026 | ||||||||||||||||||||||||||||||
| Aptean Acquiror, Inc. (dba Aptean) | First lien senior secured delayed draw term loan | 2/2027 | ||||||||||||||||||||||||||||||
| Artifact Bidco, Inc. (dba Avetta) | First lien senior secured delayed draw term loan | 7/2027 | ||||||||||||||||||||||||||||||
| Associations, Inc. | First lien senior secured delayed draw term loan | 7/2028 | ||||||||||||||||||||||||||||||
| Associations, Inc. | First lien senior secured delayed draw term loan | 2/2027 | ||||||||||||||||||||||||||||||
| Bamboo US BidCo LLC | First lien senior secured delayed draw term loan | 11/2026 | ||||||||||||||||||||||||||||||
| Bracket Intermediate Holding Corp. | First lien senior secured delayed draw term loan | 10/2027 | ( | |||||||||||||||||||||||||||||
| BusinessSolver.com, Inc. | First lien senior secured delayed draw term loan | 12/2027 | ( | |||||||||||||||||||||||||||||
| Cambrex Corporation | First lien senior secured delayed draw term loan | 3/2027 | ||||||||||||||||||||||||||||||
| Cambrex Corporation | First lien senior secured delayed draw term loan | 9/2026 | ||||||||||||||||||||||||||||||
| CCM Midco, LLC (f/k/a Cresset Capital Management, LLC) | First lien senior secured delayed draw term loan | 1/2027 | ||||||||||||||||||||||||||||||
| CCM Midco, LLC (f/k/a Cresset Capital Management, LLC) | First lien senior secured delayed draw term loan | 6/2026 | ||||||||||||||||||||||||||||||
| CivicPlus, LLC | First lien senior secured delayed draw term loan | 5/2027 | ||||||||||||||||||||||||||||||
| CivicPlus, LLC | First lien senior secured delayed draw term loan | 12/2027 | ||||||||||||||||||||||||||||||
| Commander Buyer, Inc. (dba CenExel) | First lien senior secured delayed draw term loan | 6/2027 | ||||||||||||||||||||||||||||||
| Computer Services, Inc. (dba CSI) | First lien senior secured delayed draw term loan | 11/2027 | ||||||||||||||||||||||||||||||
| CoreTrust Purchasing Group LLC | First lien senior secured delayed draw term loan | 5/2026 | ||||||||||||||||||||||||||||||
| Coupa Holdings, LLC | First lien senior secured delayed draw term loan | 6/2027 | ||||||||||||||||||||||||||||||
| CT Technologies Intermediate Holdings, Inc. (& Smart Holdings Corp.) (dba Datavant) | First lien senior secured delayed draw term loan | 7/2027 | ||||||||||||||||||||||||||||||
| CT Technologies Intermediate Holdings, Inc. (& Smart Holdings Corp.) (dba Datavant) | First lien senior secured delayed draw term loan | 8/2027 | ( | |||||||||||||||||||||||||||||
| Databricks, Inc. | First lien senior secured delayed draw term loan | 7/2026 | ||||||||||||||||||||||||||||||
| Eagan Parent, Inc. (dba Elite) | First lien senior secured delayed draw term loan | 9/2027 | ( | |||||||||||||||||||||||||||||
| Databricks, Inc. | First lien senior secured delayed draw term loan | 7/2026 | ||||||||||||||||||||||||||||||
| EET Buyer, Inc. (dba e-Emphasys) | First lien senior secured delayed draw term loan | 1/2027 | ||||||||||||||||||||||||||||||
| EresearchTechnology, Inc. (dba Clario) | First lien senior secured delayed draw term loan | 1/2027 | ||||||||||||||||||||||||||||||
| Galway Borrower LLC | First lien senior secured delayed draw term loan | 7/2026 | ||||||||||||||||||||||||||||||
F-20
Blue Owl Technology Finance Corp.
Consolidated Schedule of Investments
As of December 31, 2025
(Amounts in thousands, except share amounts)
| Unfunded | ||||||||||||||||||||||||||||||||
| Portfolio Company | Commitment Type | Commitment Expiration Date | Funded Commitment | Commitment | Fair Value(23) | |||||||||||||||||||||||||||
| GS Acquisitionco, Inc. (dba insightsoftware) | First lien senior secured delayed draw term loan | 5/2027 | ( | |||||||||||||||||||||||||||||
| GS Acquisitionco, Inc. (dba insightsoftware) | First lien senior secured delayed draw term loan | 3/2026 | ||||||||||||||||||||||||||||||
| Gusto, Inc. | First lien senior secured delayed draw term loan | 11/2027 | ||||||||||||||||||||||||||||||
| Himalaya Topco LLC (dba HealthEdge) | First lien senior secured delayed draw term loan | 12/2027 | ( | |||||||||||||||||||||||||||||
| Himalaya Topco LLC (dba HealthEdge) | First lien senior secured delayed draw term loan | 6/2027 | ( | |||||||||||||||||||||||||||||
| Integrity Marketing Acquisition, LLC | First lien senior secured delayed draw term loan | 8/2026 | ||||||||||||||||||||||||||||||
| Interoperability Bidco, Inc. (dba Lyniate) | First lien senior secured delayed draw term loan | 6/2026 | ( | |||||||||||||||||||||||||||||
| Iris Specialty Acquisition LLC (dba Integrated Specialty Coverages) | First lien senior secured delayed draw term loan | 11/2028 | ( | |||||||||||||||||||||||||||||
| KWOL Acquisition, Inc. (dba Worldwide Clinical Trials) | First lien senior secured delayed draw term loan | 8/2027 | ||||||||||||||||||||||||||||||
| KWOL Acquisition, Inc. (dba Worldwide Clinical Trials) | First lien senior secured delayed draw term loan | 8/2027 | ||||||||||||||||||||||||||||||
| Lighthouse Buyer, Inc. (dba Harbor Compliance) | First lien senior secured delayed draw term loan | 12/2028 | ( | |||||||||||||||||||||||||||||
| Litera Bidco LLC | First lien senior secured delayed draw term loan | 5/2027 | ||||||||||||||||||||||||||||||
| Litera Bidco LLC | First lien senior secured delayed draw term loan | 11/2026 | ||||||||||||||||||||||||||||||
| ManTech International Corporation | First lien senior secured delayed draw term loan | 2/2026 | ||||||||||||||||||||||||||||||
| ML Holdco, Inc. (dba Meridian Link) | First lien senior secured delayed draw term loan | 10/2027 | ( | |||||||||||||||||||||||||||||
| Monotype Imaging Holdings Inc. | First lien senior secured delayed draw term loan | 2/2026 | ||||||||||||||||||||||||||||||
| OECONNECTION LLC | First lien senior secured delayed draw term loan | 12/2032 | ( | |||||||||||||||||||||||||||||
| One, Inc. Software Corporation | First lien senior secured delayed draw term loan | 12/2027 | ( | |||||||||||||||||||||||||||||
| OneOncology, LLC | First lien senior secured delayed draw term loan | 10/2027 | ||||||||||||||||||||||||||||||
| Packaging Coordinators Midco, Inc. | First lien senior secured delayed draw term loan | 4/2026 | ||||||||||||||||||||||||||||||
| Packaging Coordinators Midco, Inc. | First lien senior secured delayed draw term loan | 4/2026 | ||||||||||||||||||||||||||||||
| PerkinElmer U.S. LLC | First lien senior secured delayed draw term loan | 10/2027 | ||||||||||||||||||||||||||||||
| Pike Corp. | First lien senior secured delayed draw term loan | 12/2028 | ( | |||||||||||||||||||||||||||||
| RL Datix Holdings (USA), Inc. | First lien senior secured delayed draw term loan | 4/2027 | ||||||||||||||||||||||||||||||
| Salinger Bidco Inc. (dba Surgical Information Systems) | First lien senior secured delayed draw term loan | 8/2026 | ||||||||||||||||||||||||||||||
| Sentinel Buyer Corp. (dba SimpliSafe) | First lien senior secured delayed draw term loan | 11/2027 | ( | |||||||||||||||||||||||||||||
F-21
Blue Owl Technology Finance Corp.
Consolidated Schedule of Investments
As of December 31, 2025
(Amounts in thousands, except share amounts)
| Unfunded | ||||||||||||||||||||||||||||||||
| Portfolio Company | Commitment Type | Commitment Expiration Date | Funded Commitment | Commitment | Fair Value(23) | |||||||||||||||||||||||||||
| Severin Acquisition, LLC (dba PowerSchool) | First lien senior secured delayed draw term loan | 10/2027 | ||||||||||||||||||||||||||||||
| Simpler Postage, Inc. (dba Easypost) | First lien senior secured delayed draw term loan | 6/2026 | ||||||||||||||||||||||||||||||
| Simplicity Financial Marketing Group Holdings, Inc. | First lien senior secured delayed draw term loan | 12/2026 | ||||||||||||||||||||||||||||||
| Smarsh Inc. | First lien senior secured delayed draw term loan | 1/2027 | ( | |||||||||||||||||||||||||||||
| Spaceship Purchaser, Inc. (dba Squarespace) | First lien senior secured delayed draw term loan | 10/2027 | ||||||||||||||||||||||||||||||
| Tamarack Intermediate, L.L.C. (dba Verisk 3E) | First lien senior secured delayed draw term loan | 7/2027 | ||||||||||||||||||||||||||||||
| Themis Solutions Inc. (dba Clio) | First lien senior secured delayed draw term loan | 10/2027 | ( | |||||||||||||||||||||||||||||
| Tricentis Operations Holdings, Inc. | First lien senior secured delayed draw term loan | 2/2027 | ( | |||||||||||||||||||||||||||||
| Unit4 Group Holding B.V. | First lien senior secured EUR delayed draw term loan | 1/2030 | ||||||||||||||||||||||||||||||
| Unit4 Group Holding B.V. | First lien senior secured EUR term loan | 1/2033 | ||||||||||||||||||||||||||||||
| Zendesk, Inc. | First lien senior secured delayed draw term loan | 5/2026 | ||||||||||||||||||||||||||||||
| Accommodations Plus Technologies LLC | First lien senior secured revolving loan | 5/2032 | ( | |||||||||||||||||||||||||||||
| Acquia Inc.* | First lien senior secured revolving loan | 10/2026 | ||||||||||||||||||||||||||||||
| Activate Holdings (US) Corp. (dba Absolute Software) | First lien senior secured revolving loan | 7/2029 | ||||||||||||||||||||||||||||||
| Aerosmith Bidco 1 Limited (dba Audiotonix) | First lien senior secured revolving loan | 7/2030 | ||||||||||||||||||||||||||||||
| AI Titan Parent, Inc. (dba Prometheus Group) | First lien senior secured revolving loan | 8/2031 | ( | |||||||||||||||||||||||||||||
| AmeriLife Holdings LLC | First lien senior secured revolving loan | 8/2028 | ||||||||||||||||||||||||||||||
| Anaplan, Inc. | First lien senior secured revolving loan | 6/2028 | ||||||||||||||||||||||||||||||
| Appfire Technologies, LLC | First lien senior secured revolving loan | 3/2028 | ||||||||||||||||||||||||||||||
| Aptean Acquiror, Inc. (dba Aptean) | First lien senior secured revolving loan | 1/2031 | ||||||||||||||||||||||||||||||
| Arrow Borrower 2025, Inc. (dba AvidXchange) | First lien senior secured revolving loan | 10/2032 | ( | |||||||||||||||||||||||||||||
| Artifact Bidco, Inc. (dba Avetta) | First lien senior secured revolving loan | 7/2030 | ||||||||||||||||||||||||||||||
| Associations, Inc. | First lien senior secured revolving loan | 7/2028 | ||||||||||||||||||||||||||||||
| Azurite Intermediate Holdings, Inc. (dba Alteryx, Inc.) | First lien senior secured revolving loan | 3/2031 | ||||||||||||||||||||||||||||||
| Bamboo US BidCo LLC | First lien senior secured revolving loan | 10/2029 | ||||||||||||||||||||||||||||||
| Bayshore Intermediate #2, L.P. (dba Boomi) | First lien senior secured revolving loan | 10/2027 | ||||||||||||||||||||||||||||||
F-22
Blue Owl Technology Finance Corp.
Consolidated Schedule of Investments
As of December 31, 2025
(Amounts in thousands, except share amounts)
| Unfunded | ||||||||||||||||||||||||||||||||
| Portfolio Company | Commitment Type | Commitment Expiration Date | Funded Commitment | Commitment | Fair Value(23) | |||||||||||||||||||||||||||
| BCPE Osprey Buyer, Inc. (dba PartsSource) | First lien senior secured revolving loan | 8/2026 | ||||||||||||||||||||||||||||||
| BCTO BSI Buyer, Inc. (dba Buildertrend) | First lien senior secured revolving loan | 12/2028 | ||||||||||||||||||||||||||||||
| Bracket Intermediate Holding Corp. | First lien senior secured revolving loan | 10/2031 | ( | |||||||||||||||||||||||||||||
| Bristol Hospice L.L.C. | First lien senior secured revolving loan | 8/2032 | ||||||||||||||||||||||||||||||
| BTRS Holdings Inc. (dba Billtrust) | First lien senior secured revolving loan | 12/2028 | ||||||||||||||||||||||||||||||
| BusinessSolver.com, Inc. | First lien senior secured revolving loan | 12/2032 | ( | |||||||||||||||||||||||||||||
| Cambrex Corporation | First lien senior secured revolving loan | 3/2032 | ||||||||||||||||||||||||||||||
| Catalis Intermediate, Inc. (fka GovBrands Intermediate, Inc.) | First lien senior secured revolving loan | 8/2027 | ||||||||||||||||||||||||||||||
| CCI BUYER, INC. (dba Consumer Cellular) | First lien senior secured revolving loan | 5/2032 | ||||||||||||||||||||||||||||||
| CCM Midco, LLC (f/k/a Cresset Capital Management, LLC) | First lien senior secured revolving loan | 6/2029 | ||||||||||||||||||||||||||||||
| Certinia Inc. | First lien senior secured revolving loan | 8/2031 | ( | |||||||||||||||||||||||||||||
| CivicPlus, LLC | First lien senior secured revolving loan | 8/2030 | ||||||||||||||||||||||||||||||
| Commander Buyer, Inc. (dba CenExel) | First lien senior secured revolving loan | 6/2032 | ||||||||||||||||||||||||||||||
| CoreTrust Purchasing Group LLC | First lien senior secured revolving loan | 10/2029 | ||||||||||||||||||||||||||||||
| Coupa Holdings, LLC | First lien senior secured revolving loan | 2/2029 | ||||||||||||||||||||||||||||||
| Creek Parent, Inc. (dba Catalent) | First lien senior secured revolving loan | 12/2031 | ( | |||||||||||||||||||||||||||||
| Crewline Buyer, Inc. (dba New Relic) | First lien senior secured revolving loan | 11/2030 | ( | |||||||||||||||||||||||||||||
| CT Technologies Intermediate Holdings, Inc. (& Smart Holdings Corp.) (dba Datavant) | First lien senior secured revolving loan | 8/2031 | ||||||||||||||||||||||||||||||
| Deerfield Dakota Holdings | First lien senior secured revolving loan | 9/2032 | ( | |||||||||||||||||||||||||||||
| Delinea Buyer, Inc. (f/k/a Centrify) | First lien senior secured revolving loan | 3/2027 | ||||||||||||||||||||||||||||||
| Denali Intermediate Holdings, Inc. (dba Dun & Bradstreet) | First lien senior secured revolving loan | 8/2032 | ( | |||||||||||||||||||||||||||||
| Eagan Parent, Inc. (dba Elite) | First lien senior secured revolving loan | 9/2032 | ( | |||||||||||||||||||||||||||||
| EET Buyer, Inc. (dba e-Emphasys) | First lien senior secured revolving loan | 11/2027 | ||||||||||||||||||||||||||||||
| Einstein Parent, Inc. (dba Smartsheet) | First lien senior secured revolving loan | 1/2031 | ( | |||||||||||||||||||||||||||||
| EresearchTechnology, Inc. (dba Clario) | First lien senior secured revolving loan | 10/2031 | ||||||||||||||||||||||||||||||
| Flexera Software LLC | First lien senior secured revolving loan | 8/2032 | ( | |||||||||||||||||||||||||||||
F-23
Blue Owl Technology Finance Corp.
Consolidated Schedule of Investments
As of December 31, 2025
(Amounts in thousands, except share amounts)
| Unfunded | ||||||||||||||||||||||||||||||||
| Portfolio Company | Commitment Type | Commitment Expiration Date | Funded Commitment | Commitment | Fair Value(23) | |||||||||||||||||||||||||||
| Forescout Technologies, Inc. | First lien senior secured revolving loan | 5/2031 | ( | |||||||||||||||||||||||||||||
| Foundation Consumer Brands, LLC | First lien senior secured revolving loan | 2/2029 | ( | |||||||||||||||||||||||||||||
| Gainsight, Inc. | First lien senior secured revolving loan | 7/2027 | ||||||||||||||||||||||||||||||
| Galway Borrower LLC | First lien senior secured revolving loan | 9/2028 | ||||||||||||||||||||||||||||||
| Gerson Lehrman Group, Inc. | First lien senior secured revolving loan | 12/2028 | ||||||||||||||||||||||||||||||
| GI Ranger Intermediate, LLC (dba Rectangle Health) | First lien senior secured revolving loan | 10/2027 | ||||||||||||||||||||||||||||||
| Granicus, Inc. | First lien senior secured revolving loan | 1/2031 | ||||||||||||||||||||||||||||||
| GS Acquisitionco, Inc. (dba insightsoftware) | First lien senior secured revolving loan | 5/2028 | ||||||||||||||||||||||||||||||
| H&F Opportunities LUX III S.À R.L (dba Checkmarx) | First lien senior secured revolving loan | 4/2027 | ||||||||||||||||||||||||||||||
| Himalaya Topco LLC (dba HealthEdge) | First lien senior secured revolving loan | 6/2032 | ( | |||||||||||||||||||||||||||||
| Hyland Software, Inc. | First lien senior secured revolving loan | 9/2029 | ||||||||||||||||||||||||||||||
| Icefall Parent, Inc. (dba EngageSmart) | First lien senior secured revolving loan | 1/2030 | ||||||||||||||||||||||||||||||
| Indikami Bidco, LLC (dba IntegriChain) | First lien senior secured revolving loan | 6/2030 | ||||||||||||||||||||||||||||||
| Integrity Marketing Acquisition, LLC | First lien senior secured revolving loan | 8/2028 | ||||||||||||||||||||||||||||||
| Intelerad Medical Systems Incorporated (fka 11849573 Canada Inc.)* | First lien senior secured revolving loan | 8/2026 | ||||||||||||||||||||||||||||||
| Interoperability Bidco, Inc. (dba Lyniate) | First lien senior secured revolving loan | 3/2028 | ||||||||||||||||||||||||||||||
| IRI Group Holdings, Inc. (f/k/a Circana Group, L.P. (f/k/a The NPD Group, L.P.)) | First lien senior secured revolving loan | 12/2028 | ||||||||||||||||||||||||||||||
| Iris Specialty Acquisition LLC (dba Integrated Specialty Coverages) | First lien senior secured revolving loan | 11/2032 | ( | |||||||||||||||||||||||||||||
| Jeppesen Holdings, LLC | First lien senior secured multi-currency revolving loan | 10/2032 | ( | |||||||||||||||||||||||||||||
| JS Parent, Inc. (dba Jama Software) | First lien senior secured revolving loan | 4/2031 | ||||||||||||||||||||||||||||||
| KWOL Acquisition, Inc. (dba Worldwide Clinical Trials) | First lien senior secured revolving loan | 12/2029 | ( | |||||||||||||||||||||||||||||
| Lighthouse Buyer, Inc. (dba Harbor Compliance) | First lien senior secured revolving loan | 12/2031 | ||||||||||||||||||||||||||||||
| Litera Bidco LLC | First lien senior secured revolving loan | 5/2028 | ||||||||||||||||||||||||||||||
| LogRhythm, Inc. | First lien senior secured revolving loan | 7/2029 | ( | |||||||||||||||||||||||||||||
| Magnet Forensics, LLC (f/k/a Grayshift, LLC) | First lien senior secured revolving loan | 7/2028 | ||||||||||||||||||||||||||||||
| ManTech International Corporation | First lien senior secured revolving loan | 9/2028 | ||||||||||||||||||||||||||||||
F-24
Blue Owl Technology Finance Corp.
Consolidated Schedule of Investments
As of December 31, 2025
(Amounts in thousands, except share amounts)
| Unfunded | ||||||||||||||||||||||||||||||||
| Portfolio Company | Commitment Type | Commitment Expiration Date | Funded Commitment | Commitment | Fair Value(23) | |||||||||||||||||||||||||||
| McQueen Bidco PTY LTD. (dba Infomedia) | First lien senior secured revolving loan | 12/2032 | ( | |||||||||||||||||||||||||||||
| MINDBODY, Inc. | First lien senior secured revolving loan | 9/2027 | ||||||||||||||||||||||||||||||
| Ministry Brands Holdings, LLC | First lien senior secured revolving loan | 12/2027 | ||||||||||||||||||||||||||||||
| Minotaur Acquisition, Inc. (dba Inspira Financial) | First lien senior secured revolving loan | 6/2030 | ||||||||||||||||||||||||||||||
| Modernizing Medicine, Inc. (dba ModMed) | First lien senior secured revolving loan | 4/2032 | ( | |||||||||||||||||||||||||||||
| Monotype Imaging Holdings Inc. | First lien senior secured revolving loan | 2/2030 | ||||||||||||||||||||||||||||||
| Natural Partners, LLC | First lien senior secured revolving loan | 11/2030 | ||||||||||||||||||||||||||||||
| Neptune Holdings, Inc. (dba NexTech) | First lien senior secured revolving loan | 8/2029 | ( | |||||||||||||||||||||||||||||
| NMI Acquisitionco, Inc. (dba Network Merchants) | First lien senior secured revolving loan | 9/2028 | ||||||||||||||||||||||||||||||
| OECONNECTION LLC | First lien senior secured revolving loan | 12/2032 | ( | |||||||||||||||||||||||||||||
| OneOncology, LLC | First lien senior secured revolving loan | 6/2029 | ||||||||||||||||||||||||||||||
| One, Inc. Software Corporation | First lien senior secured revolving loan | 12/2032 | ( | |||||||||||||||||||||||||||||
| Packaging Coordinators Midco, Inc. | First lien senior secured revolving loan | 10/2032 | ( | |||||||||||||||||||||||||||||
| PDI TA Holdings, Inc. | First lien senior secured revolving loan | 2/2031 | ||||||||||||||||||||||||||||||
| PetVet Care Centers, LLC | First lien senior secured revolving loan | 11/2029 | ||||||||||||||||||||||||||||||
| Pike Corp. | First lien senior secured revolving loan | 12/2032 | ( | |||||||||||||||||||||||||||||
| QAD, Inc. | First lien senior secured revolving loan | 11/2027 | ||||||||||||||||||||||||||||||
| Relativity ODA LLC | First lien senior secured revolving loan | 5/2029 | ||||||||||||||||||||||||||||||
| RL Datix Holdings (USA), Inc. | First lien senior secured revolving loan | 10/2030 | ||||||||||||||||||||||||||||||
| Salinger Bidco Inc. (dba Surgical Information Systems) | First lien senior secured revolving loan | 5/2031 | ||||||||||||||||||||||||||||||
| Securonix, Inc. | First lien senior secured revolving loan | 4/2028 | ( | |||||||||||||||||||||||||||||
| Sensor Technology Topco, Inc. (dba Humanetics) | First lien senior secured revolving loan | 5/2028 | ||||||||||||||||||||||||||||||
| Severin Acquisition, LLC (dba PowerSchool) | First lien senior secured revolving loan | 10/2031 | ( | |||||||||||||||||||||||||||||
| Simplicity Financial Marketing Group Holdings, Inc. | First lien senior secured revolving loan | 12/2031 | ||||||||||||||||||||||||||||||
| Smarsh Inc. | First lien senior secured revolving loan | 2/2029 | ||||||||||||||||||||||||||||||
| Spaceship Purchaser, Inc. (dba Squarespace) | First lien senior secured revolving loan | 10/2031 | ||||||||||||||||||||||||||||||
F-25
Blue Owl Technology Finance Corp.
Consolidated Schedule of Investments
As of December 31, 2025
(Amounts in thousands, except share amounts)
| Unfunded | ||||||||||||||||||||||||||||||||
| Portfolio Company | Commitment Type | Commitment Expiration Date | Funded Commitment | Commitment | Fair Value(23) | |||||||||||||||||||||||||||
| Talon MidCo 2 Limited | First lien senior secured revolving loan | 8/2028 | ||||||||||||||||||||||||||||||
| Tamarack Intermediate, L.L.C. (dba Verisk 3E) | First lien senior secured revolving loan | 3/2029 | ||||||||||||||||||||||||||||||
| Themis Solutions Inc. (dba Clio) | First lien senior secured revolving loan | 10/2032 | ( | |||||||||||||||||||||||||||||
| Thunder Purchaser, Inc. (dba Vector Solutions) | First lien senior secured revolving loan | 6/2027 | ||||||||||||||||||||||||||||||
| Tricentis Operations Holdings, Inc. | First lien senior secured revolving loan | 2/2032 | ( | |||||||||||||||||||||||||||||
| Unit4 Group Holding B.V. | First lien senior secured EUR revolving loan | 1/2033 | ||||||||||||||||||||||||||||||
| Valeris, Inc. (fka Phantom Purchaser, Inc.) | First lien senior secured revolving loan | 9/2031 | ( | |||||||||||||||||||||||||||||
| Velocity HoldCo III Inc. (dba VelocityEHS) | First lien senior secured revolving loan | 5/2029 | ||||||||||||||||||||||||||||||
| Zendesk, Inc. | First lien senior secured revolving loan | 11/2028 | ||||||||||||||||||||||||||||||
| Total non-controlled/non-affiliated - debt commitments | $ | $ | $ | ( | ||||||||||||||||||||||||||||
| Non-controlled/non-affiliated - equity commitments | ||||||||||||||||||||||||||||||||
| Chrome Investors LP | LP Interest | N/A | $ | $ | $ | |||||||||||||||||||||||||||
| Valor Compute Infrastructure L.P. | LP Interest | N/A | ||||||||||||||||||||||||||||||
| Total non-controlled/non-affiliated - equity commitments | $ | $ | $ | |||||||||||||||||||||||||||||
| Non-controlled/affiliated - debt commitments | ||||||||||||||||||||||||||||||||
| Pluralsight, LLC | First lien senior secured delayed draw term loan | 8/2029 | $ | $ | $ | ( | ||||||||||||||||||||||||||
| Walker Edison Furniture Company LLC | First lien senior secured delayed draw term loan | 3/2027 | ||||||||||||||||||||||||||||||
| Walker Edison Furniture Company LLC | First lien senior secured delayed draw term loan | 2/2026 | ||||||||||||||||||||||||||||||
| Pluralsight, LLC | First lien senior secured revolving loan | 8/2029 | ( | |||||||||||||||||||||||||||||
| Walker Edison Furniture Company LLC* | First lien senior secured revolving loan | 3/2027 | ||||||||||||||||||||||||||||||
| Total non-controlled/affiliated - debt commitments | $ | $ | $ | ( | ||||||||||||||||||||||||||||
| Non-controlled/affiliated - equity commitments | ||||||||||||||||||||||||||||||||
| AAM Series 1.1 Rail and Domestic Intermodal Feeder, LLC | Specialty finance equity investment | N/A | $ | $ | $ | |||||||||||||||||||||||||||
| LSI Financing LLC | Specialty finance equity investment | N/A | ||||||||||||||||||||||||||||||
| Total non-controlled/affiliated - equity commitments | $ | $ | $ | |||||||||||||||||||||||||||||
| Total Portfolio Company Commitments | $ | $ | $ | ( | ||||||||||||||||||||||||||||
*Fully funded
(23)The negative cost and fair value results from unamortized fees, which are capitalized to the investment cost of unfunded commitments.
(24)As defined in the Investment Company Act of 1940, as amended (the “1940 Act”), the Company is deemed to “control” a portfolio company if the Company owns more than 25% of the portfolio company's voting securities or has the power to exercise control over management or policies, including
F-26
Blue Owl Technology Finance Corp.
Consolidated Schedule of Investments
As of December 31, 2025
(Amounts in thousands, except share amounts)
through a management agreement. As defined in the 1940 Act, the Company is an “affiliated person” of this portfolio company if the Company owns more than 5% or more of the portfolio company’s outstanding voting securities. Transactions related to the Company’s investments in non-controlled affiliates and controlled affiliates for the period ended December 31, 2025 were as follows:
| Company | Fair Value at December 31, 2024 | Gross Additions (a) | Gross Reductions (b) | Net Change in Unrealized Gain/(Loss) | Realized Gains/(Loss) | Transfers | Fair Value at December 31, 2025 | Interest and PIK Interest Income | Dividend and PIK Dividend Income | Other Income | ||||||||||||||||||||||||||||||||||||||||||||||||||||
| Non-Controlled Affiliates | ||||||||||||||||||||||||||||||||||||||||||||||||||||||||||||||
AAM Series 1.1 Rail and Domestic Intermodal Feeder, LLC(c) | $ | $ | $ | ( | $ | $ | $ | $ | $ | $ | $ | |||||||||||||||||||||||||||||||||||||||||||||||||||
AAM Series 2.1 Aviation Feeder, LLC(c) | ( | |||||||||||||||||||||||||||||||||||||||||||||||||||||||||||||
| Blue Owl Cross-Strategy Opportunities LLC | ||||||||||||||||||||||||||||||||||||||||||||||||||||||||||||||
| Coherent Group Inc. | ( | |||||||||||||||||||||||||||||||||||||||||||||||||||||||||||||
| Fifth Season Investments LLC | ||||||||||||||||||||||||||||||||||||||||||||||||||||||||||||||
| Help HP SCF Investor, LP | ( | |||||||||||||||||||||||||||||||||||||||||||||||||||||||||||||
| LSI Financing 1 DAC | ( | ( | ||||||||||||||||||||||||||||||||||||||||||||||||||||||||||||
| LSI Financing LLC | ( | |||||||||||||||||||||||||||||||||||||||||||||||||||||||||||||
| Pluralsight, LLC | ( | ( | ||||||||||||||||||||||||||||||||||||||||||||||||||||||||||||
| Securiti, Inc. | ( | |||||||||||||||||||||||||||||||||||||||||||||||||||||||||||||
| Signifyd Inc. | ||||||||||||||||||||||||||||||||||||||||||||||||||||||||||||||
| Walker Edison Furniture Company LLC | ( | ( | ( | ( | ||||||||||||||||||||||||||||||||||||||||||||||||||||||||||
| Total Non-Controlled Affiliates | $ | $ | $ | ( | $ | ( | $ | $ | $ | $ | $ | $ | ||||||||||||||||||||||||||||||||||||||||||||||||||
| Controlled Affiliates | ||||||||||||||||||||||||||||||||||||||||||||||||||||||||||||||
Blue Owl Credit SLF LLC (d) | $ | $ | $ | $ | ( | $ | $ | $ | $ | $ | $ | |||||||||||||||||||||||||||||||||||||||||||||||||||
Blue Owl Leasing LLC (d) | ( | |||||||||||||||||||||||||||||||||||||||||||||||||||||||||||||
| Stripe Blue Owl Holdings LLC | ||||||||||||||||||||||||||||||||||||||||||||||||||||||||||||||
| Revolut Ribbit Holdings, LLC | ||||||||||||||||||||||||||||||||||||||||||||||||||||||||||||||
| Total Controlled Affiliates | $ | $ | $ | $ | $ | $ | $ | $ | $ | $ | ||||||||||||||||||||||||||||||||||||||||||||||||||||
(a)Gross additions include increases in the cost basis of investments resulting from new investments, payment-in-kind interest (“PIK”) or dividends, and the amortization of any unearned income or discounts on equity investments, as applicable.
(b)Gross reductions include decreases in the cost basis of investments resulting from principal collections related to investment repayments or sales, and the amortization of any premiums on equity investments, as applicable.
(c)In connection with its investment in AAM Series 1.1 Rail and Domestic Intermodal Feeder, LLC and AAM Series 2.1 Aviation Feeder, LLC (collectively, “Amergin AssetCo”) the Company made a minority investment in Amergin Asset Management, LLC, which has entered into a Servicing Agreement with Amergin AssetCo.
(d)For further description of the Company's investment in Blue Owl Credit SLF LLC (“Credit SLF”), and Blue Owl Leasing LLC (“Blue Owl Leasing”), see “Note 4 — Investments.”
F-27
Blue Owl Technology Finance Corp.
Consolidated Schedule of Investments
As of December 31, 2025
(Amounts in thousands, except share amounts)
(25)Unless otherwise indicated, the Company’s portfolio companies are pledged as collateral supporting the amounts outstanding under the Revolving Credit Facility, SPV Asset Facility I, SPV Asset Facility II, SPV Asset Facility III, SPV Asset Facility IV, Athena CLO II, Athena CLO IV and CLO 2020-1. See “Note 5 — Debt”.
(26)This portfolio company is not pledged as collateral supporting the amounts outstanding under the Revolving Credit Facility, SPV Asset Facility I, SPV Asset Facility II, SPV Asset Facility III, SPV Asset Facility IV, Athena CLO II, Athena CLO IV and CLO 2020-1. See “Note 5 — Debt”.
(27)As of December 31, 2025, the net estimated unrealized gain for U.S. federal income tax purposes was $335.5 million based on a tax cost basis of $14.0 billion. As of December 31, 2025, the estimated aggregate gross unrealized loss for U.S. federal income tax purposes was $101.7 million and the estimated aggregate gross unrealized gain for U.S. federal income tax purposes was $437.2 million.
(28)Loan was on non-accrual status as of December 31, 2025.
(29)Non-income producing investment.
(30)Security acquired in transaction exempt from registration under the Securities Act of 1933, as amended (the “Securities Act”), and may be deemed to be “restricted securities” under the Securities Act. As of December 31, 2025, the aggregate fair value of these securities is $2.2 billion or 27.7 % of the Company’s net assets. The acquisition dates of the restricted securities are as follows:
| Portfolio Company | Investment | Acquisition Date | ||||||||||||
| 6Sense Insights, Inc. | Series E-1 Preferred Stock | January 20, 2022 | ||||||||||||
| AAM Series 1.1 Rail and Domestic Intermodal Feeder, LLC | Specialty finance equity investment | July 01, 2022 | ||||||||||||
| AAM Series 2.1 Aviation Feeder, LLC | Specialty finance equity investment | July 01, 2022 | ||||||||||||
| Accelerate Topco Holdings, LLC | Common Units | March 24, 2025 | ||||||||||||
| Acorns Grow Incorporated | Series F Preferred Stock | March 24, 2025 | ||||||||||||
| Algolia, Inc. | Series D Preferred Stock | July 19, 2021 | ||||||||||||
| Algolia, Inc. | Series C Preferred Stock | August 30, 2019 | ||||||||||||
| Alpha Partners Technology Merger Corp | Common stock | July 23, 2021 | ||||||||||||
| Alpha Partners Technology Merger Corp | Warrants | July 21, 2023 | ||||||||||||
| AlphaSense, LLC | Series E Preferred Shares | June 27, 2024 | ||||||||||||
| Amergin Asset Management, LLC | Specialty finance equity investment | July 01, 2022 | ||||||||||||
| Arctic Wolf Networks, Inc. | Preferred Stock | July 07, 2021 | ||||||||||||
| Axonius, Inc. | Series E Preferred Stock | March 24, 2025 | ||||||||||||
| Baypine Commander Co-Invest, LP | LP Interest | June 24, 2025 | ||||||||||||
| BEHP Co-Investor II, L.P. | LP Interest | May 06, 2022 | ||||||||||||
| Blend Labs, Inc. | Warrants | July 02, 2021 | ||||||||||||
Blue Owl Credit SLF LLC(a) | LLC Interest | August 01, 2024 | ||||||||||||
| Blue Owl Cross-Strategy Opportunities LLC | Specialty finance equity investment | September 19, 2025 | ||||||||||||
Blue Owl Leasing LLC(b) | Joint Venture | October 14, 2025 | ||||||||||||
| Bolt Technology OÜ | Preferred Stock | December 10, 2021 | ||||||||||||
| Brex, Inc. | Class A Units | August 15, 2025 | ||||||||||||
| Brex, Inc. | Preferred Stock | November 30, 2021 | ||||||||||||
| Brooklyn Lender Co-Invest 2, L.P. (dba Boomi) | Common Units | October 01, 2021 | ||||||||||||
| Chrome Investors LP | LP Interest | January 25, 2025 | ||||||||||||
| Circle Internet Services, Inc. | Series D Preferred Stock | May 20, 2019 | ||||||||||||
| Circle Internet Services, Inc. | Series E Preferred Stock | February 28, 2020 | ||||||||||||
| Circle Internet Services, Inc. | Series F Preferred Stock | May 04, 2021 | ||||||||||||
| Circle Internet Services, Inc. | Warrants | May 20, 2019 | ||||||||||||
| CloudPay, Inc. | Series E Preferred Stock | July 31, 2024 | ||||||||||||
| Coherent Group Inc. | Series B Preferred Shares | March 24, 2025 | ||||||||||||
| Diligent Preferred Issuer, Inc. (dba Diligent Corporation) | Preferred Stock | April 06, 2021 | ||||||||||||
| Dodge Construction Network Holdings, L.P. | Series A Preferred Units | March 16, 2022 | ||||||||||||
| Dodge Construction Network Holdings, L.P. | Class A-2 Common Units | March 16, 2022 | ||||||||||||
| Elliott Alto Co-Investor Aggregator L.P. | LP Interest | September 28, 2022 | ||||||||||||
| EShares, Inc. (dba Carta) | Series E Preferred Stock | August 01, 2019 | ||||||||||||
| Excalibur CombineCo, L.P. | Class A Units | July 02, 2024 | ||||||||||||
F-28
Blue Owl Technology Finance Corp.
Consolidated Schedule of Investments
As of December 31, 2025
(Amounts in thousands, except share amounts)
| Portfolio Company | Investment | Acquisition Date | ||||||||||||
| Fifth Season Investments LLC | Specialty finance equity investment | October 17, 2022 | ||||||||||||
| Fifth Season Investments LLC | Specialty finance equity investment | November 03, 2025 | ||||||||||||
| Halo Purchaser, LLC | Class H Warrant Units | October 15, 2021 | ||||||||||||
| Halo Purchaser, LLC | Class B PIK Preferred Equity | October 15, 2021 | ||||||||||||
| HARNESS INC. | Series D Preferred Stock | June 11, 2024 | ||||||||||||
| Help HP SCF Investor, LP | LP Interest | April 28, 2021 | ||||||||||||
| Illumio, Inc. | Common stock | August 27, 2021 | ||||||||||||
| Illumio, Inc. | Series F Preferred Stock | June 23, 2021 | ||||||||||||
| Insight CP (Blocker) Holdings, L.P. (dba CivicPlus, LLC) | LP Interest | June 08, 2022 | ||||||||||||
| JumpCloud, Inc. | Series F Preferred Stock | September 03, 2021 | ||||||||||||
| JumpCloud, Inc. | Series B Preferred Stock | December 30, 2021 | ||||||||||||
| Juniper Square, Inc. | Warrants | March 24, 2025 | ||||||||||||
| Kajabi Holdings, LLC | Senior Preferred Class D Units | March 24, 2021 | ||||||||||||
| Knockout Intermediate Holdings I Inc. (dba Kaseya Inc.) | Perpetual Preferred Stock | June 22, 2022 | ||||||||||||
| KPCI Co-Invest 2, L.P. | Class A Units | October 15, 2025 | ||||||||||||
| KWOL Acquisition, Inc. (dba Worldwide Clinical Trials) | Class A Interest | December 12, 2023 | ||||||||||||
| Linked Store Cayman Ltd. (dba Nuvemshop) | Series E Preferred Stock | August 09, 2021 | ||||||||||||
| LSI Financing 1 DAC | Specialty finance equity investment | December 14, 2022 | ||||||||||||
| LSI Financing LLC | Specialty finance equity investment | November 25, 2024 | ||||||||||||
| Bird Holding B.V. (fka MessageBird Holding B.V.) | Extended Series C Warrants | May 05, 2021 | ||||||||||||
| Minerva Holdco, Inc. | Senior A Preferred Stock | February 14, 2022 | ||||||||||||
| ModMed Software Midco Holdings, Inc. (dba ModMed) | Series A Preferred Units | April 30, 2025 | ||||||||||||
| Nscale Global Holdings Limited | Preferred equity | September 29, 2025 | ||||||||||||
| Nscale Global Holdings Limited | Series B Preferred Shares | September 29, 2025 | ||||||||||||
| Nylas, Inc. | Series C Preferred Stock | June 03, 2021 | ||||||||||||
| Orange Blossom Parent, Inc. | Common Units | March 24, 2025 | ||||||||||||
| Paradigmatic Holdco LLC (dba Pluralsight) | Common stock | August 22, 2024 | ||||||||||||
| Project Alpine Co-Invest Fund, LP | LP Interest | June 13, 2022 | ||||||||||||
| Project Hotel California Co-Invest Fund, L.P. | LP Interest | August 09, 2022 | ||||||||||||
| Replicated, Inc. | Series C Preferred Stock | June 30, 2021 | ||||||||||||
| Revolut Ribbit Holdings, LLC | LLC Interest | September 30, 2021 | ||||||||||||
| Rome Topco Holdings, LLC (dba SimpliSafe) | Class A Units | November 06, 2025 | ||||||||||||
| Romulus Intermediate Holdings 1 Inc. (dba PetVet Care Centers) | Series A Preferred Stock | November 15, 2023 | ||||||||||||
| Saturn Ultimate, Inc. | Common stock | December 29, 2021 | ||||||||||||
| Stripe Blue Owl Holdings LLC | Joint Venture | December 09, 2025 | ||||||||||||
| Signifyd Inc. | Preferred equity | April 08, 2021 | ||||||||||||
| Simpler Postage, Inc. (dba Easypost) | Warrants | June 11, 2024 | ||||||||||||
| SLA Eclipse Co-Invest, L.P. | LP Interest | September 30, 2019 | ||||||||||||
| Space Exploration Technologies Corp. | Class A Common Stock | March 23, 2021 | ||||||||||||
| Space Exploration Technologies Corp. | Class C Common Stock | March 23, 2021 | ||||||||||||
| Sunshine Software Holdings, Inc. (dba Cornerstone OnDemand, Inc.) | Series A Preferred Stock | October 14, 2021 | ||||||||||||
| Thunder Topco L.P. (dba Vector Solutions) | Common Units | June 30, 2021 | ||||||||||||
| TravelPerk, Inc. | Warrants | May 02, 2024 | ||||||||||||
| Valor Compute Infrastructure L.P. | LP Interest | October 03, 2025 | ||||||||||||
| VCI Intermediate TopCo 1 LLC | Class B Units | November 17, 2025 | ||||||||||||
| Veeam Software Group | Series C Preferred Shares | December 08, 2025 | ||||||||||||
F-29
Blue Owl Technology Finance Corp.
Consolidated Schedule of Investments
As of December 31, 2025
(Amounts in thousands, except share amounts)
| Portfolio Company | Investment | Acquisition Date | ||||||||||||
| VEPF Torreys Aggregator, LLC (dba MINDBODY, Inc.) | Series A Preferred Stock | October 15, 2021 | ||||||||||||
| Vestwell Holdings Inc. | Series D Preferred Stock | December 20, 2023 | ||||||||||||
| Walker Edison Holdco LLC | Common Units | March 01, 2023 | ||||||||||||
| WMC Bidco, Inc. (dba West Monroe) | Senior Preferred Stock | November 09, 2021 | ||||||||||||
| WP Irving Co-Invest, L.P. | Partnership Units | May 18, 2022 | ||||||||||||
| XOMA Corporation | Warrants | December 15, 2023 | ||||||||||||
| Zoro TopCo, Inc. | Series A Preferred Equity | November 22, 2022 | ||||||||||||
| Zoro TopCo, L.P. | Class A Common Units | November 22, 2022 | ||||||||||||
(a) Refer to “Note 4 — Investments – Blue Owl Credit SLF LLC” for further information.
(b) Refer to “Note 4 — Investments – Blue Owl Leasing LLC” for further information.
(31)This portfolio company is not a qualifying asset under Section 55(a) of the 1940 Act. Under the 1940 Act, the Company may not acquire any non-qualifying asset unless, at the time such acquisition is made, qualifying assets represent at least 70% of total assets. As of December 31, 2025, non-qualifying assets represented 16.1 % of total assets as calculated in accordance with the regulatory requirements.
(32)Harness Inc. has retained 304,990 shares until June 11, 2026 as a security for indemnity obligations detailed in the Merger Agreement with Split Software, Inc.
(33)Reserved.
(34)BOCSO was formed to hold alternative credit assets, including asset-based finance (“ABF”). ABF is a subsector of private credit focused on generating income from pools of financial, physical or other assets. As of December 31, 2025, the portfolio consists of three investments totaling $0.5 24.8 million to $304.4 million and with a fair value ranging from $24.8 million to $303.9 million. The largest investment is 62% of the total cost of BOCSO's portfolio. As of December 31, 2025 the portfolio asset class composition was 62% ABF - Specialty finance, 33% ABF - Leasing, and 5% ABF - Commercial Real Estate.
The accompanying notes are an integral part of these consolidated financial statements.
F-30
Blue Owl Technology Finance Corp.
Consolidated Schedule of Investments
As of December 31, 2024
(Amounts in thousands, except share amounts)
| Company(1)(7)(17)(19) | Investment | Interest | Maturity Date | Par / Units | Amortized Cost(2)(3) | Fair Value | Percentage of Net Assets | |||||||||||||||||||||||||||||||||||||||||||
| Non-controlled/non-affiliated portfolio company investments | ||||||||||||||||||||||||||||||||||||||||||||||||||
| Debt Investments | ||||||||||||||||||||||||||||||||||||||||||||||||||
| Aerospace & defense | ||||||||||||||||||||||||||||||||||||||||||||||||||
| ManTech International Corporation(6)(9)(13) | First lien senior secured loan | S+ | 9/2029 | $ | $ | $ | % | |||||||||||||||||||||||||||||||||||||||||||
| Peraton Corp.(3)(6)(9)(13) | Second lien senior secured loan | S+ | 2/2029 | % | ||||||||||||||||||||||||||||||||||||||||||||||
| % | ||||||||||||||||||||||||||||||||||||||||||||||||||
| Application Software | ||||||||||||||||||||||||||||||||||||||||||||||||||
| AI Titan Parent, Inc. (dba Prometheus Group)(6)(8)(13) | First lien senior secured loan | S+ | 8/2031 | % | ||||||||||||||||||||||||||||||||||||||||||||||
| AlphaSense, Inc.(6)(9)(13) | First lien senior secured loan | S+ | 6/2029 | % | ||||||||||||||||||||||||||||||||||||||||||||||
| Anaplan, Inc.(6)(9)(13) | First lien senior secured loan | S+ | 6/2029 | % | ||||||||||||||||||||||||||||||||||||||||||||||
| Armstrong Bidco Limited(6)(11)(13)(14)(22) | First lien senior secured GBP term loan | SA+ | 6/2029 | £ | % | |||||||||||||||||||||||||||||||||||||||||||||
| Artifact Bidco, Inc. (dba Avetta)(6)(9)(13) | First lien senior secured loan | S+ | 7/2031 | % | ||||||||||||||||||||||||||||||||||||||||||||||
| Avalara, Inc.(6)(9)(13) | First lien senior secured loan | S+ | 10/2028 | % | ||||||||||||||||||||||||||||||||||||||||||||||
| Boxer Parent Company Inc. (f/k/a BMC)(3)(6)(9)(13) | First lien senior secured loan | S+ | 7/2031 | % | ||||||||||||||||||||||||||||||||||||||||||||||
| Catalis Intermediate, Inc. (fka GovBrands Intermediate, Inc.)(6)(9)(13)(14) | First lien senior secured loan | S+ | 8/2027 | % | ||||||||||||||||||||||||||||||||||||||||||||||
| CivicPlus, LLC(6)(9)(13)(14) | First lien senior secured loan | S+ | 8/2027 | % | ||||||||||||||||||||||||||||||||||||||||||||||
| Coupa Holdings, LLC(6)(9)(13) | First lien senior secured loan | S+ | 2/2030 | % | ||||||||||||||||||||||||||||||||||||||||||||||
| CP PIK DEBT ISSUER, LLC (dba CivicPlus, LLC)(6)(10)(13) | Unsecured notes | S+ | 6/2034 | % | ||||||||||||||||||||||||||||||||||||||||||||||
| Diamondback Acquisition, Inc. (dba Sphera)(6)(8)(13) | First lien senior secured loan | S+ | 9/2028 | % | ||||||||||||||||||||||||||||||||||||||||||||||
| Fullsteam Operations, LLC(6)(9)(13)(14) | First lien senior secured loan | S+ | 11/2029 | % | ||||||||||||||||||||||||||||||||||||||||||||||
| Fullsteam Operations, LLC(6)(9)(13)(14) | First lien senior secured delayed draw term loan | S+ | 11/2029 | % | ||||||||||||||||||||||||||||||||||||||||||||||
| Gainsight, Inc.(6)(9)(13)(14) | First lien senior secured loan | S+ | 7/2027 | % | ||||||||||||||||||||||||||||||||||||||||||||||
| Granicus, Inc.(6)(9)(13) | First lien senior secured loan | S+ | 1/2031 | % | ||||||||||||||||||||||||||||||||||||||||||||||
| Granicus, Inc.(6)(9)(13) | First lien senior secured delayed draw term loan | S+ | 1/2031 | % | ||||||||||||||||||||||||||||||||||||||||||||||
| GS Acquisitionco, Inc. (dba insightsoftware)(6)(9)(13)(14) | First lien senior secured loan | S+ | 5/2028 | % | ||||||||||||||||||||||||||||||||||||||||||||||
| JS Parent, Inc. (dba Jama Software)(6)(9)(13) | First lien senior secured loan | S+ | 4/2031 | % | ||||||||||||||||||||||||||||||||||||||||||||||
| Magnet Forensics, LLC (f/k/a Grayshift, LLC)(6)(8)(13)(22) | First lien senior secured loan | S+ | 7/2028 | % | ||||||||||||||||||||||||||||||||||||||||||||||
| Ministry Brands Holdings, LLC(6)(8)(13)(14) | First lien senior secured loan | S+ | 12/2028 | % | ||||||||||||||||||||||||||||||||||||||||||||||
| Simpler Postage, Inc. (dba Easypost)(6)(8)(13)(14) | First lien senior secured loan | S+ | 6/2029 | % | ||||||||||||||||||||||||||||||||||||||||||||||
| Tamarack Intermediate, L.L.C. (dba Verisk 3E)(6)(9)(13)(14) | First lien senior secured loan | S+ | 3/2028 | % | ||||||||||||||||||||||||||||||||||||||||||||||
| Velocity HoldCo III Inc. (dba VelocityEHS)(6)(9)(13) | First lien senior secured loan | S+ | 4/2027 | % | ||||||||||||||||||||||||||||||||||||||||||||||
| XPLOR T1, LLC(6)(9)(13) | First lien senior secured loan | S+ | 6/2031 | % | ||||||||||||||||||||||||||||||||||||||||||||||
| Zendesk, Inc.(6)(9)(13) | First lien senior secured loan | S+ | 11/2028 | % | ||||||||||||||||||||||||||||||||||||||||||||||
F-31
Blue Owl Technology Finance Corp.
Consolidated Schedule of Investments
As of December 31, 2024
(Amounts in thousands, except share amounts)
| Company(1)(7)(17)(19) | Investment | Interest | Maturity Date | Par / Units | Amortized Cost(2)(3) | Fair Value | Percentage of Net Assets | |||||||||||||||||||||||||||||||||||||||||||
| % | ||||||||||||||||||||||||||||||||||||||||||||||||||
| Banks | ||||||||||||||||||||||||||||||||||||||||||||||||||
| Finastra USA, Inc.(6)(9)(13)(14)(22) | First lien senior secured loan | S+ | 9/2029 | % | ||||||||||||||||||||||||||||||||||||||||||||||
| % | ||||||||||||||||||||||||||||||||||||||||||||||||||
| Building products | ||||||||||||||||||||||||||||||||||||||||||||||||||
| EET Buyer, Inc. (dba e-Emphasys)(6)(9)(13)(14) | First lien senior secured loan | S+ | 11/2027 | % | ||||||||||||||||||||||||||||||||||||||||||||||
| % | ||||||||||||||||||||||||||||||||||||||||||||||||||
| Buildings & Real Estate | ||||||||||||||||||||||||||||||||||||||||||||||||||
| Associations Finance, Inc.(13)(25) | Unsecured notes | 5/2030 | % | |||||||||||||||||||||||||||||||||||||||||||||||
| Associations, Inc.(6)(9)(13)(14) | First lien senior secured loan | S+ | 7/2028 | % | ||||||||||||||||||||||||||||||||||||||||||||||
| % | ||||||||||||||||||||||||||||||||||||||||||||||||||
| Commercial Services & Supplies | ||||||||||||||||||||||||||||||||||||||||||||||||||
| SimpliSafe Holding Corporation(6)(8)(13)(14) | First lien senior secured loan | S+ | 5/2028 | % | ||||||||||||||||||||||||||||||||||||||||||||||
| Pye-Barker Fire & Safety, LLC(6)(9)(13)(14) | First lien senior secured loan | S+ | 5/2031 | % | ||||||||||||||||||||||||||||||||||||||||||||||
| Pye-Barker Fire & Safety, LLC(6)(9)(13)(14) | First lien senior secured revolving loan | S+ | 5/2030 | % | ||||||||||||||||||||||||||||||||||||||||||||||
| % | ||||||||||||||||||||||||||||||||||||||||||||||||||
| Consumer Finance | ||||||||||||||||||||||||||||||||||||||||||||||||||
| Klarna Holding AB(6)(9)(13) | Subordinated Floating Rate Notes | 4/2034 | % | |||||||||||||||||||||||||||||||||||||||||||||||
| % | ||||||||||||||||||||||||||||||||||||||||||||||||||
| Diversified Consumer Services | ||||||||||||||||||||||||||||||||||||||||||||||||||
| Icefall Parent, Inc. (dba EngageSmart)(6)(8)(13) | First lien senior secured loan | S+ | 1/2030 | % | ||||||||||||||||||||||||||||||||||||||||||||||
| Litera Bidco LLC(6)(8)(13)(14) | First lien senior secured loan | S+ | 5/2028 | % | ||||||||||||||||||||||||||||||||||||||||||||||
| Relativity ODA LLC(6)(8)(13) | First lien senior secured loan | S+ | 5/2029 | % | ||||||||||||||||||||||||||||||||||||||||||||||
| % | ||||||||||||||||||||||||||||||||||||||||||||||||||
| Diversified Financial Services | ||||||||||||||||||||||||||||||||||||||||||||||||||
| AAM Series 1.1 Rail and Domestic Intermodal Feeder, LLC(13)(14)(25) | First lien senior secured loan | 7/2030 | % | |||||||||||||||||||||||||||||||||||||||||||||||
| AAM Series 2.1 Aviation Feeder, LLC(13)(14)(25) | First lien senior secured loan | 11/2030 | % | |||||||||||||||||||||||||||||||||||||||||||||||
| Blackhawk Network Holdings, Inc.(3)(6)(8)(13) | First lien senior secured loan | S+ | 3/2029 | % | ||||||||||||||||||||||||||||||||||||||||||||||
| BTRS HOLDINGS INC. (dba Billtrust)(6)(9)(13)(14) | First lien senior secured loan | S+ | 12/2028 | % | ||||||||||||||||||||||||||||||||||||||||||||||
| Computer Services, Inc. (dba CSI)(6)(9)(13)(14) | First lien senior secured loan | S+ | 11/2029 | % | ||||||||||||||||||||||||||||||||||||||||||||||
| Computer Services, Inc. (dba CSI)(6)(9)(13) | First lien senior secured loan | S+ | 11/2029 | % | ||||||||||||||||||||||||||||||||||||||||||||||
| Hg Genesis 8 Sumoco Limited(6)(11)(13)(22) | Unsecured facility | SA+ | 9/2027 | £ | % | |||||||||||||||||||||||||||||||||||||||||||||
| Hg Genesis 9 SumoCo Limited(6)(12)(13)(22) | Unsecured facility | E+ | 3/2029 | € | % | |||||||||||||||||||||||||||||||||||||||||||||
| Hg Saturn Luchaco Limited(6)(11)(13)(22) | Unsecured facility | SA+ | 3/2026 | £ | % | |||||||||||||||||||||||||||||||||||||||||||||
F-32
Blue Owl Technology Finance Corp.
Consolidated Schedule of Investments
As of December 31, 2024
(Amounts in thousands, except share amounts)
| Company(1)(7)(17)(19) | Investment | Interest | Maturity Date | Par / Units | Amortized Cost(2)(3) | Fair Value | Percentage of Net Assets | |||||||||||||||||||||||||||||||||||||||||||
| Minotaur Acquisition, Inc. (dba Inspira Financial)(6)(8)(13)(14) | First lien senior secured loan | S+ | 6/2030 | % | ||||||||||||||||||||||||||||||||||||||||||||||
| NMI Acquisitionco, Inc. (dba Network Merchants)(6)(8)(13)(14) | First lien senior secured loan | S+ | 9/2028 | % | ||||||||||||||||||||||||||||||||||||||||||||||
| Smarsh Inc.(6)(9)(13)(14) | First lien senior secured loan | S+ | 2/2029 | % | ||||||||||||||||||||||||||||||||||||||||||||||
| Smarsh Inc.(6)(8)(13)(14) | First lien senior secured revolving loan | S+ | 2/2029 | % | ||||||||||||||||||||||||||||||||||||||||||||||
| % | ||||||||||||||||||||||||||||||||||||||||||||||||||
| Entertainment | ||||||||||||||||||||||||||||||||||||||||||||||||||
| Aerosmith Bidco 1 Limited (dba Audiotonix)(6)(8)(13)(22) | First lien senior secured loan | S+ | 7/2031 | % | ||||||||||||||||||||||||||||||||||||||||||||||
| % | ||||||||||||||||||||||||||||||||||||||||||||||||||
| Equity Real Estate Investment Trusts (REITs) | ||||||||||||||||||||||||||||||||||||||||||||||||||
| Storable, Inc.(3)(6)(8)(13) | First lien senior secured loan | S+ | 4/2028 | % | ||||||||||||||||||||||||||||||||||||||||||||||
| % | ||||||||||||||||||||||||||||||||||||||||||||||||||
| Food & Staples Retailing | ||||||||||||||||||||||||||||||||||||||||||||||||||
| IRI Group Holdings, Inc. (f/k/a Circana Group, L.P. (f/k/a The NPD Group, L.P.))(6)(8)(13) | First lien senior secured loan | S+ | 12/2028 | % | ||||||||||||||||||||||||||||||||||||||||||||||
| IRI Group Holdings, Inc. (f/k/a Circana Group, L.P. (f/k/a The NPD Group, L.P.))(6)(9)(13)(14) | First lien senior secured revolving loan | S+ | 12/2027 | % | ||||||||||||||||||||||||||||||||||||||||||||||
| % | ||||||||||||||||||||||||||||||||||||||||||||||||||
| Health Care Providers & Services | ||||||||||||||||||||||||||||||||||||||||||||||||||
| KWOL Acquisition Inc. (dba Worldwide Clinical Trials)(6)(9)(13) | First lien senior secured loan | S+ | 12/2029 | % | ||||||||||||||||||||||||||||||||||||||||||||||
| PetVet Care Centers, LLC(6)(8)(13) | First lien senior secured loan | S+ | 11/2030 | % | ||||||||||||||||||||||||||||||||||||||||||||||
| % | ||||||||||||||||||||||||||||||||||||||||||||||||||
| Health Care Technology | ||||||||||||||||||||||||||||||||||||||||||||||||||
| BCPE Osprey Buyer, Inc. (dba PartsSource)(6)(9)(13) | First lien senior secured loan | S+ | 8/2028 | % | ||||||||||||||||||||||||||||||||||||||||||||||
| BCPE Osprey Buyer, Inc. (dba PartsSource)(6)(8)(13)(14) | First lien senior secured delayed draw term loan | S+ | 8/2028 | % | ||||||||||||||||||||||||||||||||||||||||||||||
| BCPE Osprey Buyer, Inc. (dba PartsSource)(6)(8)(13)(14) | First lien senior secured revolving loan | S+ | 8/2026 | % | ||||||||||||||||||||||||||||||||||||||||||||||
| CT Technologies Intermediate Holdings, Inc. (& Smart Holdings Corp.) (dba Datavant)(6)(8)(13) | First lien senior secured loan | S+ | 8/2031 | % | ||||||||||||||||||||||||||||||||||||||||||||||
| GI Ranger Intermediate, LLC (dba Rectangle Health)(6)(9)(13)(14) | First lien senior secured loan | S+ | 10/2028 | % | ||||||||||||||||||||||||||||||||||||||||||||||
| GI Ranger Intermediate, LLC (dba Rectangle Health)(6)(9)(13)(14) | First lien senior secured revolving loan | S+ | 10/2027 | % | ||||||||||||||||||||||||||||||||||||||||||||||
| Greenway Health, LLC(6)(9)(13) | First lien senior secured loan | S+ | 4/2029 | % | ||||||||||||||||||||||||||||||||||||||||||||||
| Hyland Software, Inc.(6)(8)(13) | First lien senior secured loan | S+ | 9/2030 | % | ||||||||||||||||||||||||||||||||||||||||||||||
| Indikami Bidco, LLC (dba IntegriChain)(6)(8)(13) | First lien senior secured loan | S+ | 12/2030 | % | ||||||||||||||||||||||||||||||||||||||||||||||
F-33
Blue Owl Technology Finance Corp.
Consolidated Schedule of Investments
As of December 31, 2024
(Amounts in thousands, except share amounts)
| Company(1)(7)(17)(19) | Investment | Interest | Maturity Date | Par / Units | Amortized Cost(2)(3) | Fair Value | Percentage of Net Assets | |||||||||||||||||||||||||||||||||||||||||||
| Indikami Bidco, LLC (dba IntegriChain)(6)(8)(13)(14) | First lien senior secured delayed draw term loan | S+ | 12/2030 | % | ||||||||||||||||||||||||||||||||||||||||||||||
| Indikami Bidco, LLC (dba IntegriChain)(6)(8)(13)(14) | First lien senior secured revolving loan | S+ | 6/2030 | % | ||||||||||||||||||||||||||||||||||||||||||||||
| Inovalon Holdings, Inc.(6)(9)(13)(14) | First lien senior secured loan | S+ | 11/2028 | % | ||||||||||||||||||||||||||||||||||||||||||||||
| Inovalon Holdings, Inc.(6)(9)(13) | Second lien senior secured loan | S+ | 11/2033 | % | ||||||||||||||||||||||||||||||||||||||||||||||
| Intelerad Medical Systems Incorporated (fka 11849573 Canada Inc.)(6)(9)(13)(14)(22) | First lien senior secured loan | S+ | 8/2026 | % | ||||||||||||||||||||||||||||||||||||||||||||||
| Interoperability Bidco, Inc. (dba Lyniate)(6)(9)(13)(14) | First lien senior secured loan | S+ | 3/2028 | % | ||||||||||||||||||||||||||||||||||||||||||||||
| Interoperability Bidco, Inc. (dba Lyniate)(6)(8)(13)(14) | First lien senior secured revolving loan | S+ | 3/2028 | % | ||||||||||||||||||||||||||||||||||||||||||||||
| Neptune Holdings, Inc. (dba NexTech)(6)(9)(13) | First lien senior secured loan | S+ | 8/2030 | % | ||||||||||||||||||||||||||||||||||||||||||||||
| RL Datix Holdings (USA), Inc.(6)(10)(13) | First lien senior secured loan | S+ | 4/2031 | % | ||||||||||||||||||||||||||||||||||||||||||||||
| RL Datix Holdings (USA), Inc.(6)(9)(13)(14) | First lien senior secured revolving loan | S+ | 10/2030 | % | ||||||||||||||||||||||||||||||||||||||||||||||
| RL Datix Holdings (USA), Inc.(6)(11)(13) | First lien senior secured GBP term loan | SA+ | 4/2031 | £ | % | |||||||||||||||||||||||||||||||||||||||||||||
| Salinger Bidco Inc. (dba Surgical Information Systems)(6)(8)(13) | First lien senior secured loan | S+ | 8/2031 | % | ||||||||||||||||||||||||||||||||||||||||||||||
| % | ||||||||||||||||||||||||||||||||||||||||||||||||||
| Hotels, Restaurants & Leisure | ||||||||||||||||||||||||||||||||||||||||||||||||||
| MINDBODY, Inc.(6)(9)(13)(14) | First lien senior secured loan | S+ | 9/2025 | % | ||||||||||||||||||||||||||||||||||||||||||||||
| Par Technology Corporation(6)(8)(13) | First lien senior secured loan | S+ | 7/2029 | % | ||||||||||||||||||||||||||||||||||||||||||||||
| % | ||||||||||||||||||||||||||||||||||||||||||||||||||
| Household Durables | ||||||||||||||||||||||||||||||||||||||||||||||||||
| BCTO BSI Buyer, Inc. (dba Buildertrend)(6)(9)(13) | First lien senior secured loan | S+ | 12/2026 | % | ||||||||||||||||||||||||||||||||||||||||||||||
| % | ||||||||||||||||||||||||||||||||||||||||||||||||||
| Industrial Conglomerates | ||||||||||||||||||||||||||||||||||||||||||||||||||
| Aptean Acquiror, Inc. (dba Aptean)(6)(9)(13)(14) | First lien senior secured loan | S+ | 1/2031 | % | ||||||||||||||||||||||||||||||||||||||||||||||
| QAD, Inc.(6)(8)(13) | First lien senior secured loan | S+ | 11/2027 | % | ||||||||||||||||||||||||||||||||||||||||||||||
| % | ||||||||||||||||||||||||||||||||||||||||||||||||||
| Insurance | ||||||||||||||||||||||||||||||||||||||||||||||||||
| Asurion, LLC(3)(6)(8)(13) | Second lien senior secured loan | S+ | 1/2028 | % | ||||||||||||||||||||||||||||||||||||||||||||||
| Diamond Insure Bidco (dba Acturis)(6)(13) | First lien senior secured EUR term loan | E+ | 7/2031 | € | % | |||||||||||||||||||||||||||||||||||||||||||||
| Diamond Insure Bidco (dba Acturis)(6)(11)(13) | First lien senior secured GBP term loan | SA+ | 7/2031 | £ | % | |||||||||||||||||||||||||||||||||||||||||||||
| Disco Parent, Inc. (dba Duck Creek Technologies, Inc.)(6)(9)(13) | First lien senior secured loan | S+ | 3/2029 | % | ||||||||||||||||||||||||||||||||||||||||||||||
| Integrity Marketing Acquisition, LLC(6)(9)(13) | First lien senior secured loan | S+ | 8/2028 | % | ||||||||||||||||||||||||||||||||||||||||||||||
| Simplicity Financial Marketing Group Holdings, Inc.(6)(9)(13) | First lien senior secured loan | S+ | 12/2031 | % | ||||||||||||||||||||||||||||||||||||||||||||||
| % | ||||||||||||||||||||||||||||||||||||||||||||||||||
F-34
Blue Owl Technology Finance Corp.
Consolidated Schedule of Investments
As of December 31, 2024
(Amounts in thousands, except share amounts)
| Company(1)(7)(17)(19) | Investment | Interest | Maturity Date | Par / Units | Amortized Cost(2)(3) | Fair Value | Percentage of Net Assets | |||||||||||||||||||||||||||||||||||||||||||
| Internet & Direct Marketing Retail | ||||||||||||||||||||||||||||||||||||||||||||||||||
| Aurelia Netherlands B.V.(6)(12)(13)(22) | First lien senior secured EUR term loan | E+ | 5/2031 | € | % | |||||||||||||||||||||||||||||||||||||||||||||
| % | ||||||||||||||||||||||||||||||||||||||||||||||||||
| IT Services | ||||||||||||||||||||||||||||||||||||||||||||||||||
| Kaseya Inc.(6)(8)(13) | First lien senior secured loan | S+ | 6/2029 | % | ||||||||||||||||||||||||||||||||||||||||||||||
| Kaseya Inc.(6)(9)(13)(14) | First lien senior secured delayed draw term loan | S+ | 6/2029 | % | ||||||||||||||||||||||||||||||||||||||||||||||
| Severin Acquisition, LLC (dba PowerSchool)(6)(8)(13) | First lien senior secured loan | S+ | 10/2031 | % | ||||||||||||||||||||||||||||||||||||||||||||||
| Spaceship Purchaser, Inc. (dba Squarespace)(6)(9)(13) | First lien senior secured loan | S+ | 10/2031 | % | ||||||||||||||||||||||||||||||||||||||||||||||
| % | ||||||||||||||||||||||||||||||||||||||||||||||||||
| Life Sciences Tools & Services | ||||||||||||||||||||||||||||||||||||||||||||||||||
| Bamboo US BidCo LLC(6)(12)(13) | First lien senior secured EUR term loan | E+ | 9/2030 | € | % | |||||||||||||||||||||||||||||||||||||||||||||
| Bamboo US BidCo LLC(6)(9)(13)(14) | First lien senior secured loan | S+ | 9/2030 | % | ||||||||||||||||||||||||||||||||||||||||||||||
| Creek Parent, Inc. (dba Catalent)(6)(8)(13) | First lien senior secured loan | S+ | 12/2031 | % | ||||||||||||||||||||||||||||||||||||||||||||||
| % | ||||||||||||||||||||||||||||||||||||||||||||||||||
| Media | ||||||||||||||||||||||||||||||||||||||||||||||||||
| Monotype Imaging Holdings Inc.(6)(9)(13)(14) | First lien senior secured loan | S+ | 2/2031 | % | ||||||||||||||||||||||||||||||||||||||||||||||
| % | ||||||||||||||||||||||||||||||||||||||||||||||||||
| Multiline Retail | ||||||||||||||||||||||||||||||||||||||||||||||||||
| PDI TA Holdings, Inc.(6)(9)(13) | First lien senior secured loan | S+ | 2/2031 | % | ||||||||||||||||||||||||||||||||||||||||||||||
| PDI TA Holdings, Inc.(6)(9)(13)(14) | First lien senior secured delayed draw term loan | S+ | 2/2031 | % | ||||||||||||||||||||||||||||||||||||||||||||||
| % | ||||||||||||||||||||||||||||||||||||||||||||||||||
| Professional Services | ||||||||||||||||||||||||||||||||||||||||||||||||||
| Certinia Inc.(6)(9)(13) | First lien senior secured loan | S+ | 8/2030 | % | ||||||||||||||||||||||||||||||||||||||||||||||
| CloudPay, Inc.(6)(9)(13) | First lien senior secured loan | S+ | 7/2029 | % | ||||||||||||||||||||||||||||||||||||||||||||||
| Cornerstone OnDemand, Inc.(6)(8)(13) | Second lien senior secured loan | S+ | 10/2029 | % | ||||||||||||||||||||||||||||||||||||||||||||||
| Gerson Lehrman Group, Inc.(6)(9)(13) | First lien senior secured loan | S+ | 12/2027 | % | ||||||||||||||||||||||||||||||||||||||||||||||
| Thunder Purchaser, Inc. (dba Vector Solutions)(6)(9)(13) | First lien senior secured loan | S+ | 6/2028 | % | ||||||||||||||||||||||||||||||||||||||||||||||
| TK Operations Ltd (dba Travelperk, Inc.)(13)(25) | First lien senior secured loan | 5/2029 | % | |||||||||||||||||||||||||||||||||||||||||||||||
| When I Work, Inc.(6)(9)(13) | First lien senior secured loan | S+ | 11/2027 | % | ||||||||||||||||||||||||||||||||||||||||||||||
| % | ||||||||||||||||||||||||||||||||||||||||||||||||||
| Real Estate Management & Development | ||||||||||||||||||||||||||||||||||||||||||||||||||
| Entrata, Inc.(6)(8)(13) | First lien senior secured loan | S+ | 7/2030 | % | ||||||||||||||||||||||||||||||||||||||||||||||
| RealPage, Inc.(3)(6)(9)(13) | First lien senior secured loan | S+ | 4/2028 | % | ||||||||||||||||||||||||||||||||||||||||||||||
| % | ||||||||||||||||||||||||||||||||||||||||||||||||||
| Systems Software | ||||||||||||||||||||||||||||||||||||||||||||||||||
| Acquia Inc.(6)(9)(14) | First lien senior secured loan | S+ | 10/2025 | % | ||||||||||||||||||||||||||||||||||||||||||||||
| Activate Holdings (US) Corp. (dba Absolute Software)(6)(9)(13)(14)(22) | First lien senior secured loan | S+ | 7/2030 | % | ||||||||||||||||||||||||||||||||||||||||||||||
F-35
Blue Owl Technology Finance Corp.
Consolidated Schedule of Investments
As of December 31, 2024
(Amounts in thousands, except share amounts)
| Company(1)(7)(17)(19) | Investment | Interest | Maturity Date | Par / Units | Amortized Cost(2)(3) | Fair Value | Percentage of Net Assets | |||||||||||||||||||||||||||||||||||||||||||
| Arctic Wolf Networks, Inc.(13)(25) | Senior convertible notes | 9/2027 | % | |||||||||||||||||||||||||||||||||||||||||||||||
| Azurite Intermediate Holdings, Inc. (dba Alteryx, Inc.)(6)(8)(13)(14) | First lien senior secured loan | S+ | 3/2031 | % | ||||||||||||||||||||||||||||||||||||||||||||||
| Bayshore Intermediate #2, L.P. (dba Boomi)(6)(9)(13) | First lien senior secured loan | S+ | 10/2028 | % | ||||||||||||||||||||||||||||||||||||||||||||||
| Crewline Buyer, Inc. (dba New Relic)(6)(8)(13) | First lien senior secured loan | S+ | 11/2030 | % | ||||||||||||||||||||||||||||||||||||||||||||||
| Databricks, Inc.(6)(8)(13) | First lien senior secured loan | S+ | 1/2031 | % | ||||||||||||||||||||||||||||||||||||||||||||||
| Delinea Buyer, Inc. (f/k/a Centrify)(6)(9)(13)(14) | First lien senior secured loan | S+ | 3/2028 | % | ||||||||||||||||||||||||||||||||||||||||||||||
| Delta TopCo, Inc. (dba Infoblox, Inc.)(3)(6)(10) | Second lien senior secured loan | S+ | 11/2030 | % | ||||||||||||||||||||||||||||||||||||||||||||||
| Forescout Technologies, Inc.(6)(9)(13) | First lien senior secured loan | S+ | 5/2031 | % | ||||||||||||||||||||||||||||||||||||||||||||||
| H&F Opportunities LUX III S.À R.L (dba Checkmarx)(6)(8)(13)(22) | First lien senior secured loan | S+ | 4/2026 | % | ||||||||||||||||||||||||||||||||||||||||||||||
| Ivanti Software, Inc.(6)(9)(13) | Second lien senior secured loan | S+ | 12/2028 | % | ||||||||||||||||||||||||||||||||||||||||||||||
| LogRhythm, Inc.(6)(8)(13) | First lien senior secured loan | S+ | 7/2029 | % | ||||||||||||||||||||||||||||||||||||||||||||||
| Oranje Holdco, Inc. (dba KnowBe4)(6)(9)(13) | First lien senior secured loan | S+ | 2/2029 | % | ||||||||||||||||||||||||||||||||||||||||||||||
| Oranje Holdco, Inc. (dba KnowBe4)(6)(9)(13) | First lien senior secured loan | S+ | 2/2029 | % | ||||||||||||||||||||||||||||||||||||||||||||||
| Ping Identity Holding Corp.(6)(9)(13) | First lien senior secured loan | S+ | 10/2029 | % | ||||||||||||||||||||||||||||||||||||||||||||||
| Rubrik, Inc.(6)(9)(13)(14) | First lien senior secured loan | S+ | 8/2028 | % | ||||||||||||||||||||||||||||||||||||||||||||||
| SailPoint Technologies Holdings, Inc.(6)(9)(13) | First lien senior secured loan | S+ | 8/2029 | % | ||||||||||||||||||||||||||||||||||||||||||||||
| Securonix, Inc.(6)(9)(13) | First lien senior secured loan | S+ | 4/2028 | % | ||||||||||||||||||||||||||||||||||||||||||||||
| Securonix, Inc.(6)(9)(13)(14) | First lien senior secured revolving loan | S+ | 4/2028 | ( | % | |||||||||||||||||||||||||||||||||||||||||||||
| Sitecore Holding III A/S(6)(12)(13) | First lien senior secured EUR term loan | E+ | 3/2029 | € | % | |||||||||||||||||||||||||||||||||||||||||||||
| Sitecore USA, Inc.(6)(9)(13) | First lien senior secured loan | S+ | 3/2029 | % | ||||||||||||||||||||||||||||||||||||||||||||||
| Sitecore Holding III A/S(6)(9)(13) | First lien senior secured loan | S+ | 3/2029 | % | ||||||||||||||||||||||||||||||||||||||||||||||
| Talon MidCo 2 Limited(6)(8)(13)(14)(22) | First lien senior secured loan | S+ | 8/2028 | % | ||||||||||||||||||||||||||||||||||||||||||||||
| % | ||||||||||||||||||||||||||||||||||||||||||||||||||
| Total non-controlled/non-affiliated portfolio company debt investments | $ | $ | % | |||||||||||||||||||||||||||||||||||||||||||||||
| Equity Investments | ||||||||||||||||||||||||||||||||||||||||||||||||||
| Aerospace & Defense | ||||||||||||||||||||||||||||||||||||||||||||||||||
| Space Exploration Technologies Corp.(13)(16)(23) | Class A Common Stock | N/A | N/A | % | ||||||||||||||||||||||||||||||||||||||||||||||
| Space Exploration Technologies Corp.(13)(16)(23) | Class C Common Stock | N/A | N/A | % | ||||||||||||||||||||||||||||||||||||||||||||||
F-36
Blue Owl Technology Finance Corp.
Consolidated Schedule of Investments
As of December 31, 2024
(Amounts in thousands, except share amounts)
| Company(1)(7)(17)(19) | Investment | Interest | Maturity Date | Par / Units | Amortized Cost(2)(3) | Fair Value | Percentage of Net Assets | |||||||||||||||||||||||||||||||||||||||||||
| % | ||||||||||||||||||||||||||||||||||||||||||||||||||
| Application Software | ||||||||||||||||||||||||||||||||||||||||||||||||||
| 6Sense Insights, Inc.(13)(16)(23) | Series E-1 Preferred Stock | N/A | N/A | % | ||||||||||||||||||||||||||||||||||||||||||||||
| Alpha Partners Technology Merger Corp(2)(22)(23) | Common stock | N/A | N/A | % | ||||||||||||||||||||||||||||||||||||||||||||||
| Alpha Partners Technology Merger Corp(2)(16)(22)(23) | Warrants | N/A | N/A | % | ||||||||||||||||||||||||||||||||||||||||||||||
| AlphaSense, LLC(13)(16)(23) | Series E Preferred Shares | N/A | N/A | % | ||||||||||||||||||||||||||||||||||||||||||||||
| Diligent Preferred Issuer, Inc. (dba Diligent Corporation)(13)(16)(25) | Preferred Stock | N/A | % | |||||||||||||||||||||||||||||||||||||||||||||||
| EShares, Inc. (dba Carta)(16)(23) | Series E Preferred Stock | N/A | N/A | % | ||||||||||||||||||||||||||||||||||||||||||||||
| Insight CP (Blocker) Holdings, L.P. (dba CivicPlus, LLC)(13)(16)(22)(23) | LP Interest | N/A | N/A | $ | % | |||||||||||||||||||||||||||||||||||||||||||||
| Bird Holding B.V. (fka MessageBird Holding B.V.)(13)(16)(22)(23) | Extended Series C Warrants | N/A | N/A | % | ||||||||||||||||||||||||||||||||||||||||||||||
| Nylas, Inc.(16)(23) | Series C Preferred Stock | N/A | N/A | % | ||||||||||||||||||||||||||||||||||||||||||||||
| Project Alpine Co-Invest Fund, LP(13)(16)(22)(23) | LP Interest | N/A | N/A | $ | % | |||||||||||||||||||||||||||||||||||||||||||||
| Saturn Ultimate, Inc.(13)(16)(23) | Common stock | N/A | N/A | % | ||||||||||||||||||||||||||||||||||||||||||||||
| Simpler Postage, Inc. (dba Easypost)(13)(16)(23) | Warrants | N/A | N/A | % | ||||||||||||||||||||||||||||||||||||||||||||||
| Zoro TopCo, Inc.(9)(13)(16) | Series A Preferred Equity | S+ | N/A | % | ||||||||||||||||||||||||||||||||||||||||||||||
| Zoro TopCo, L.P.(13)(16)(23) | Class A Common Units | N/A | N/A | % | ||||||||||||||||||||||||||||||||||||||||||||||
| % | ||||||||||||||||||||||||||||||||||||||||||||||||||
| Construction & Engineering | ||||||||||||||||||||||||||||||||||||||||||||||||||
| Dodge Construction Network Holdings, L.P.(6)(9)(13)(16) | Series A Preferred Units | S+ | N/A | % | ||||||||||||||||||||||||||||||||||||||||||||||
| Dodge Construction Network Holdings, L.P.(13)(16)(23) | Class A-2 Common Units | N/A | N/A | % | ||||||||||||||||||||||||||||||||||||||||||||||
| % | ||||||||||||||||||||||||||||||||||||||||||||||||||
| Diversified Consumer Services | ||||||||||||||||||||||||||||||||||||||||||||||||||
| SLA Eclipse Co-Invest, L.P.(3)(16)(22)(23) | LP Interest | N/A | N/A | $ | % | |||||||||||||||||||||||||||||||||||||||||||||
| % | ||||||||||||||||||||||||||||||||||||||||||||||||||
| Diversified Financial Services | ||||||||||||||||||||||||||||||||||||||||||||||||||
| AAM Series 1.1 Rail and Domestic Intermodal Feeder, LLC(13)(14)(16)(22)(23) | LLC Interest | N/A | N/A | $ | % | |||||||||||||||||||||||||||||||||||||||||||||
| AAM Series 2.1 Aviation Feeder, LLC(13)(14)(16)(22)(23) | LLC Interest | N/A | N/A | $ | % | |||||||||||||||||||||||||||||||||||||||||||||
| Amergin Asset Management, LLC(13)(16)(22)(23) | Class A Units | N/A | N/A | % | ||||||||||||||||||||||||||||||||||||||||||||||
| Brex, Inc.(16)(23) | Preferred Stock | N/A | N/A | % | ||||||||||||||||||||||||||||||||||||||||||||||
| % | ||||||||||||||||||||||||||||||||||||||||||||||||||
| Health Care Providers & Services | ||||||||||||||||||||||||||||||||||||||||||||||||||
| KWOL Acquisition Inc. (dba Worldwide Clinical Trials)(13)(16)(23) | Class A Interest | N/A | N/A | % | ||||||||||||||||||||||||||||||||||||||||||||||
F-37
Blue Owl Technology Finance Corp.
Consolidated Schedule of Investments
As of December 31, 2024
(Amounts in thousands, except share amounts)
| Company(1)(7)(17)(19) | Investment | Interest | Maturity Date | Par / Units | Amortized Cost(2)(3) | Fair Value | Percentage of Net Assets | |||||||||||||||||||||||||||||||||||||||||||
| Romulus Intermediate Holdings 1 Inc. (dba PetVet Care Centers)(13)(16)(25) | Series A Preferred Stock | N/A | % | |||||||||||||||||||||||||||||||||||||||||||||||
| % | ||||||||||||||||||||||||||||||||||||||||||||||||||
| Health Care Technology | ||||||||||||||||||||||||||||||||||||||||||||||||||
| BEHP Co-Investor II, L.P.(13)(16)(22)(23) | LP Interest | N/A | N/A | $ | % | |||||||||||||||||||||||||||||||||||||||||||||
| Minerva Holdco, Inc.(13)(16)(25) | Senior A Preferred Stock | N/A | % | |||||||||||||||||||||||||||||||||||||||||||||||
| WP Irving Co-Invest, L.P.(13)(16)(22)(23) | Partnership Units | N/A | N/A | % | ||||||||||||||||||||||||||||||||||||||||||||||
| % | ||||||||||||||||||||||||||||||||||||||||||||||||||
| Hotels, Restaurants & Leisure | ||||||||||||||||||||||||||||||||||||||||||||||||||
| VEPF Torreys Aggregator, LLC (dba MINDBODY, Inc.)(13)(16)(25) | Series A Preferred Stock | N/A | % | |||||||||||||||||||||||||||||||||||||||||||||||
| % | ||||||||||||||||||||||||||||||||||||||||||||||||||
| Internet & Direct Marketing Retail | ||||||||||||||||||||||||||||||||||||||||||||||||||
| Kajabi Holdings, LLC(16)(23) | Senior Preferred Class D Units | N/A | N/A | % | ||||||||||||||||||||||||||||||||||||||||||||||
| Klaviyo, Inc.(2)(16)(23) | Series B Common Stock | N/A | N/A | % | ||||||||||||||||||||||||||||||||||||||||||||||
| Linked Store Cayman Ltd. (dba Nuvemshop)(13)(16)(22)(23) | Series E Preferred Stock | N/A | N/A | % | ||||||||||||||||||||||||||||||||||||||||||||||
| % | ||||||||||||||||||||||||||||||||||||||||||||||||||
| IT Services | ||||||||||||||||||||||||||||||||||||||||||||||||||
| E2Open Parent Holdings, Inc.(2)(22)(23) | Class A Common Stock | N/A | N/A | % | ||||||||||||||||||||||||||||||||||||||||||||||
| JumpCloud, Inc.(16)(23) | Series B Preferred Stock | N/A | N/A | % | ||||||||||||||||||||||||||||||||||||||||||||||
| JumpCloud, Inc.(16)(23) | Series F Preferred Stock | N/A | N/A | % | ||||||||||||||||||||||||||||||||||||||||||||||
| Knockout Intermediate Holdings I Inc. (dba Kaseya Inc.)(6)(10)(13)(16) | Perpetual Preferred Stock | S+ | N/A | % | ||||||||||||||||||||||||||||||||||||||||||||||
| Replicated, Inc.(16)(23) | Series C Preferred Stock | N/A | N/A | % | ||||||||||||||||||||||||||||||||||||||||||||||
| WMC Bidco, Inc. (dba West Monroe)(13)(16)(25) | Senior Preferred Stock | N/A | % | |||||||||||||||||||||||||||||||||||||||||||||||
| % | ||||||||||||||||||||||||||||||||||||||||||||||||||
| Pharmaceuticals | ||||||||||||||||||||||||||||||||||||||||||||||||||
| XOMA Corporation(13)(16)(23) | Warrants | N/A | N/A | % | ||||||||||||||||||||||||||||||||||||||||||||||
| % | ||||||||||||||||||||||||||||||||||||||||||||||||||
| Professional Services | ||||||||||||||||||||||||||||||||||||||||||||||||||
| BCTO WIW Holdings, Inc. (dba When I Work)(13)(16)(23) | Class A Common Stock | N/A | % | |||||||||||||||||||||||||||||||||||||||||||||||
| CloudPay, Inc.(13)(16)(22)(25) | Series E Preferred Stock | N/A | % | |||||||||||||||||||||||||||||||||||||||||||||||
| Sunshine Software Holdings, Inc. (dba Cornerstone OnDemand, Inc.)(13)(16)(25) | Series A Preferred Stock | N/A | % | |||||||||||||||||||||||||||||||||||||||||||||||
| Thunder Topco L.P. (dba Vector Solutions)(13)(16)(23) | Common Units | N/A | N/A | % | ||||||||||||||||||||||||||||||||||||||||||||||
| TravelPerk, Inc.(13)(16)(23) | Warrants | N/A | N/A | % | ||||||||||||||||||||||||||||||||||||||||||||||
| Vestwell Holdings, Inc.(13)(16)(23) | Series D Preferred Stock | N/A | N/A | % | ||||||||||||||||||||||||||||||||||||||||||||||
| % | ||||||||||||||||||||||||||||||||||||||||||||||||||
F-38
Blue Owl Technology Finance Corp.
Consolidated Schedule of Investments
As of December 31, 2024
(Amounts in thousands, except share amounts)
| Company(1)(7)(17)(19) | Investment | Interest | Maturity Date | Par / Units | Amortized Cost(2)(3) | Fair Value | Percentage of Net Assets | |||||||||||||||||||||||||||||||||||||||||||
| Road & Rail | ||||||||||||||||||||||||||||||||||||||||||||||||||
| Bolt Technology OÜ(16)(22)(23) | Preferred Stock | N/A | N/A | % | ||||||||||||||||||||||||||||||||||||||||||||||
| % | ||||||||||||||||||||||||||||||||||||||||||||||||||
| Systems Software | ||||||||||||||||||||||||||||||||||||||||||||||||||
| Algolia, Inc.(16)(23) | Series D Preferred Stock | N/A | N/A | % | ||||||||||||||||||||||||||||||||||||||||||||||
| Algolia, Inc.(16)(23) | Series C Preferred Stock | N/A | N/A | % | ||||||||||||||||||||||||||||||||||||||||||||||
| Arctic Wolf Networks, Inc.(16)(23) | Preferred Stock | N/A | N/A | % | ||||||||||||||||||||||||||||||||||||||||||||||
| Brooklyn Lender Co-Invest 2, L.P. (dba Boomi)(13)(16)(23) | Common Units | N/A | N/A | % | ||||||||||||||||||||||||||||||||||||||||||||||
| Circle Internet Services, Inc.(16)(23) | Warrants | N/A | N/A | % | ||||||||||||||||||||||||||||||||||||||||||||||
| Circle Internet Services, Inc.(16)(23) | Series D Preferred Stock | N/A | N/A | % | ||||||||||||||||||||||||||||||||||||||||||||||
| Circle Internet Services, Inc.(16)(23) | Series E Preferred Stock | N/A | N/A | % | ||||||||||||||||||||||||||||||||||||||||||||||
| Circle Internet Services, Inc.(16)(23) | Series F Preferred Stock | N/A | N/A | % | ||||||||||||||||||||||||||||||||||||||||||||||
| Circle Internet Services, Inc.(16)(23) | Subordinated Convertible Security | N/A | N/A | % | ||||||||||||||||||||||||||||||||||||||||||||||
| Elliott Alto Co-Investor Aggregator L.P.(13)(16)(22)(23) | LP Interest | N/A | N/A | % | ||||||||||||||||||||||||||||||||||||||||||||||
| Excalibur CombineCo, L.P.(13)(16)(23) | Class A Units | N/A | N/A | % | ||||||||||||||||||||||||||||||||||||||||||||||
| Halo Parent Newco, LLC(13)(16)(25) | Class H PIK Preferred Equity | N/A | % | |||||||||||||||||||||||||||||||||||||||||||||||
| HARNESS INC.(16)(23)(26) | Series D Preferred Stock | N/A | N/A | % | ||||||||||||||||||||||||||||||||||||||||||||||
| Illumio, Inc.(16)(23) | Common stock | N/A | N/A | % | ||||||||||||||||||||||||||||||||||||||||||||||
| Illumio, Inc.(16)(23) | Series F Preferred Stock | N/A | N/A | % | ||||||||||||||||||||||||||||||||||||||||||||||
| Project Hotel California Co-Invest Fund, L.P.(13)(16)(22)(23) | LP Interest | N/A | N/A | $ | % | |||||||||||||||||||||||||||||||||||||||||||||
| Securiti, Inc.(13)(16)(23) | Series C Preferred Shares | N/A | N/A | % | ||||||||||||||||||||||||||||||||||||||||||||||
| % | ||||||||||||||||||||||||||||||||||||||||||||||||||
| Thrifts & Mortgage Finance | ||||||||||||||||||||||||||||||||||||||||||||||||||
| Blend Labs, Inc.(13)(16)(23) | Warrants | N/A | N/A | % | ||||||||||||||||||||||||||||||||||||||||||||||
| % | ||||||||||||||||||||||||||||||||||||||||||||||||||
| Total non-controlled/non-affiliated portfolio company equity investments | $ | $ | % | |||||||||||||||||||||||||||||||||||||||||||||||
| Total non-controlled/non-affiliated portfolio company investments | $ | $ | % | |||||||||||||||||||||||||||||||||||||||||||||||
| Non-controlled/affiliated portfolio company investments(21) | ||||||||||||||||||||||||||||||||||||||||||||||||||
| Debt Investments | ||||||||||||||||||||||||||||||||||||||||||||||||||
| Internet & Direct Marketing Retail | ||||||||||||||||||||||||||||||||||||||||||||||||||
| Walker Edison Furniture Company LLC(6)(9)(13)(20)(24) | First lien senior secured revolving loan | S+ | 3/2027 | $ | % | |||||||||||||||||||||||||||||||||||||||||||||
| Walker Edison Furniture Company LLC(6)(9)(13)(14)(20)(24) | First lien senior secured delayed draw term loan | S+ | 3/2027 | % | ||||||||||||||||||||||||||||||||||||||||||||||
| Walker Edison Furniture Company LLC(6)(9)(13)(20)(24) | First lien senior secured loan | S+ | 3/2027 | % | ||||||||||||||||||||||||||||||||||||||||||||||
| % | ||||||||||||||||||||||||||||||||||||||||||||||||||
| IT Services | ||||||||||||||||||||||||||||||||||||||||||||||||||
F-39
Blue Owl Technology Finance Corp.
Consolidated Schedule of Investments
As of December 31, 2024
(Amounts in thousands, except share amounts)
| Company(1)(7)(17)(19) | Investment | Interest | Maturity Date | Par / Units | Amortized Cost(2)(3) | Fair Value | Percentage of Net Assets | |||||||||||||||||||||||||||||||||||||||||||
| Pluralsight, LLC(6)(9)(13)(20) | First lien senior secured loan | S+ | 8/2029 | % | ||||||||||||||||||||||||||||||||||||||||||||||
| Pluralsight, LLC(6)(9)(13)(20) | First lien senior secured loan | S+ | 8/2029 | % | ||||||||||||||||||||||||||||||||||||||||||||||
| % | ||||||||||||||||||||||||||||||||||||||||||||||||||
| Total non-controlled/affiliated portfolio company debt investments | $ | $ | % | |||||||||||||||||||||||||||||||||||||||||||||||
| Equity Investments | ||||||||||||||||||||||||||||||||||||||||||||||||||
| Insurance | ||||||||||||||||||||||||||||||||||||||||||||||||||
| Fifth Season Investments LLC(13)(16)(18)(20) | Class A Units | N/A | N/A | % | ||||||||||||||||||||||||||||||||||||||||||||||
| % | ||||||||||||||||||||||||||||||||||||||||||||||||||
| Internet & Direct Marketing Retail | ||||||||||||||||||||||||||||||||||||||||||||||||||
| Signifyd Inc.(16)(20)(25) | Preferred equity | N/A | % | |||||||||||||||||||||||||||||||||||||||||||||||
| Walker Edison Holdco LLC(13)(16)(20)(23) | Common Units | N/A | N/A | % | ||||||||||||||||||||||||||||||||||||||||||||||
| % | ||||||||||||||||||||||||||||||||||||||||||||||||||
| IT Services | ||||||||||||||||||||||||||||||||||||||||||||||||||
| Paradigmatic Holdco LLC (dba Pluralsight)(13)(16)(20)(23) | Common stock | N/A | N/A | % | ||||||||||||||||||||||||||||||||||||||||||||||
| % | ||||||||||||||||||||||||||||||||||||||||||||||||||
| Pharmaceuticals | ||||||||||||||||||||||||||||||||||||||||||||||||||
| LSI Financing 1 DAC(13)(14)(16)(20)(22) | Preferred equity | N/A | N/A | $ | % | |||||||||||||||||||||||||||||||||||||||||||||
| LSI Financing LLC(13)(14)(16)(20)(22)(23) | Common Equity | N/A | N/A | $ | % | |||||||||||||||||||||||||||||||||||||||||||||
| % | ||||||||||||||||||||||||||||||||||||||||||||||||||
| Systems Software | ||||||||||||||||||||||||||||||||||||||||||||||||||
| Help HP SCF Investor, LP(13)(16)(20)(23) | LP Interest | N/A | N/A | $ | % | |||||||||||||||||||||||||||||||||||||||||||||
| % | ||||||||||||||||||||||||||||||||||||||||||||||||||
| Total non-controlled/affiliated portfolio company equity investments | $ | $ | % | |||||||||||||||||||||||||||||||||||||||||||||||
| Total non-controlled/affiliated portfolio company investments | $ | $ | % | |||||||||||||||||||||||||||||||||||||||||||||||
| Controlled/affiliated portfolio company investments(22) | ||||||||||||||||||||||||||||||||||||||||||||||||||
| Equity Investments | ||||||||||||||||||||||||||||||||||||||||||||||||||
| Diversified Financial Services | ||||||||||||||||||||||||||||||||||||||||||||||||||
| Revolut Ribbit Holdings, LLC(14)(16)(21)(22)(23) | LLC Interest | N/A | N/A | % | ||||||||||||||||||||||||||||||||||||||||||||||
| % | ||||||||||||||||||||||||||||||||||||||||||||||||||
| Joint Ventures | ||||||||||||||||||||||||||||||||||||||||||||||||||
| Blue Owl Credit SLF LLC(13)(16)(18)(21)(22)(23) | LLC Interest | N/A | N/A | $ | % | |||||||||||||||||||||||||||||||||||||||||||||
| % | ||||||||||||||||||||||||||||||||||||||||||||||||||
| Total controlled/affiliated portfolio company equity investments | $ | $ | % | |||||||||||||||||||||||||||||||||||||||||||||||
| Total controlled/affiliated portfolio company investments | $ | $ | % | |||||||||||||||||||||||||||||||||||||||||||||||
| Total non-controlled/non-affiliated misc. debt commitments(16)(27)(Note 8) | $ | ( | $ | ( | ( | % | ||||||||||||||||||||||||||||||||||||||||||||
| Total Investments | $ | $ | % | |||||||||||||||||||||||||||||||||||||||||||||||
(1)Unless otherwise indicated, all investments are considered Level 3 investments.
(2)Level 1 investment.
F-40
Blue Owl Technology Finance Corp.
Consolidated Schedule of Investments
As of December 31, 2024
(Amounts in thousands, except share amounts)
(3)Level 2 investment.
(4)The amortized cost represents the original cost adjusted for the amortization or accretion of premium or discount, as applicable, on debt investments using the effective interest method.
(5)As of December 31, 2024, the net estimated unrealized loss on investments for U.S. federal income tax purposes was $15.8 million based on a tax cost basis of $6.42 billion. As of December 31, 2024, the estimated aggregate gross unrealized loss for U.S. federal income tax purposes was $203.8 million and the estimated aggregate gross unrealized gain for U.S. federal income tax purposes was $188.0 million.
(6)Unless otherwise indicated, loan contains a variable rate structure and may be subject to an interest rate floor. Variable rate loans bear interest at a rate that may be determined by reference to either the Secured Overnight Financing Rate (“SOFR” or “S”, which can include one-, three- or six-month SOFR), Euro Interbank Offered Rate (“EURIBOR” or “E”, which can include three- or six-month EURIBOR), or Sterling Overnight Interbank Average Rate (“SONIA” or “SA”), at the borrower’s option, and which reset periodically based on the terms of the loan agreement.
(7)Certain portfolio company investments are subject to contractual restrictions on sales. Refer to footnote 16 for additional information on our restricted securities.
(8)The interest rate on these loans is subject to 1 month SOFR, which as of December 31, 2024 was 4.33%.
(9)The interest rate on these loans is subject to 3 month SOFR, which as of December 31, 2024 was 4.31%.
(10)The interest rate on these loans is subject to 6 month SOFR, which as of December 31, 2024 was 4.25%.
(11)The interest rate on these loans is subject to SONIA, which as of December 31, 2024 was 4.70%.
(12)The interest rate on these loans is subject to 3 month EURIBOR, which as of December 31, 2024 was 2.71%.
(13)Represents co-investment made with the Company’s affiliates in accordance with the terms of an order for exemptive relief that an affiliate of the Company’s investment adviser received from the U.S. Securities and Exchange Commission. See “Note 3 —Agreements and Related Party Transactions”.
(14)Position or portion thereof is a partially unfunded debt or equity commitment. See below for more information on the Company’s commitments. See “Note 8 — Commitments and Contingencies”.
Unfunded | ||||||||||||||||||||||||||||||||
| Portfolio Company | Commitment Type | Commitment Expiration Date | Funded Commitment | Commitment | Fair Value(27) | |||||||||||||||||||||||||||
| Non-controlled/non-affiliated - delayed draw debt commitments | ||||||||||||||||||||||||||||||||
| Aerosmith Bidco 1 Limited (dba Audiotonix) | First lien senior secured delayed draw term loan | 7/2027 | $ | $ | $ | ( | ||||||||||||||||||||||||||
| AI Titan Parent, Inc. (dba Prometheus Group) | First lien senior secured delayed draw term loan | 9/2026 | ( | |||||||||||||||||||||||||||||
| AlphaSense, Inc. | First lien senior secured delayed draw term loan | 6/2029 | ( | |||||||||||||||||||||||||||||
| AlphaSense, Inc. | First lien senior secured delayed draw term loan | 12/2025 | ( | |||||||||||||||||||||||||||||
| Aptean Acquiror, Inc. (dba Aptean) | First lien senior secured delayed draw term loan | 1/2026 | ||||||||||||||||||||||||||||||
| Artifact Bidco, Inc. (dba Avetta) | First lien senior secured delayed draw term loan | 7/2027 | ||||||||||||||||||||||||||||||
| Associations, Inc. | First lien senior secured delayed draw term loan | 7/2028 | ||||||||||||||||||||||||||||||
| Bamboo US BidCo LLC | First lien senior secured delayed draw term loan | 11/2026 | ||||||||||||||||||||||||||||||
| Bamboo US BidCo LLC | First lien senior secured delayed draw term loan | 3/2025 | ||||||||||||||||||||||||||||||
| BCPE Osprey Buyer, Inc. (dba PartsSource) | First lien senior secured delayed draw term loan | 10/2025 | ||||||||||||||||||||||||||||||
| Computer Services, Inc. (dba CSI) | First lien senior secured delayed draw term loan | 2/2026 | ||||||||||||||||||||||||||||||
| Coupa Holdings, LLC | First lien senior secured delayed draw term loan | 8/2025 | ||||||||||||||||||||||||||||||
| CT Technologies Intermediate Holdings, Inc. (& Smart Holdings Corp.) (dba Datavant) | First lien senior secured delayed draw term loan | 8/2026 | ( | |||||||||||||||||||||||||||||
| Databricks, Inc. | First lien senior secured delayed draw term loan | 7/2026 | ||||||||||||||||||||||||||||||
| EET Buyer, Inc. (dba e-Emphasys) | First lien senior secured delayed draw term loan | 4/2026 | ||||||||||||||||||||||||||||||
| Fullsteam Operations, LLC | First lien senior secured delayed draw term loan | 8/2025 | ||||||||||||||||||||||||||||||
| Fullsteam Operations, LLC | First lien senior secured delayed draw term loan | 2/2026 | ||||||||||||||||||||||||||||||
| GS Acquisitionco, Inc. (dba insightsoftware) | First lien senior secured delayed draw term loan | 3/2026 | ||||||||||||||||||||||||||||||
| Indikami Bidco, LLC (dba IntegriChain) | First lien senior secured delayed draw term loan | 12/2025 | ||||||||||||||||||||||||||||||
| Integrity Marketing Acquisition, LLC | First lien senior secured delayed draw term loan | 8/2026 | ||||||||||||||||||||||||||||||
F-41
Blue Owl Technology Finance Corp.
Consolidated Schedule of Investments
As of December 31, 2024
(Amounts in thousands, except share amounts)
Unfunded | ||||||||||||||||||||||||||||||||
| Portfolio Company | Commitment Type | Commitment Expiration Date | Funded Commitment | Commitment | Fair Value(27) | |||||||||||||||||||||||||||
| Interoperability Bidco, Inc. (dba Lyniate) | First lien senior secured delayed draw term loan | 6/2026 | ( | |||||||||||||||||||||||||||||
| Kaseya Inc. | First lien senior secured delayed draw term loan | 6/2025 | ||||||||||||||||||||||||||||||
| Litera Bidco LLC | First lien senior secured delayed draw term loan | 11/2026 | ||||||||||||||||||||||||||||||
| Litera Bidco LLC | First lien senior secured delayed draw term loan | 5/2027 | ( | |||||||||||||||||||||||||||||
| ManTech International Corporation | First lien senior secured delayed draw term loan | 6/2025 | ||||||||||||||||||||||||||||||
| Minotaur Acquisition, Inc. (dba Inspira Financial) | First lien senior secured delayed draw term loan | 5/2026 | ||||||||||||||||||||||||||||||
| Monotype Imaging Holdings Inc. | First lien senior secured delayed draw term loan | 2/2026 | ||||||||||||||||||||||||||||||
| PDI TA Holdings, Inc. | First lien senior secured delayed draw term loan | 2/2026 | ||||||||||||||||||||||||||||||
| PetVet Care Centers, LLC | First lien senior secured delayed draw term loan | 11/2025 | ( | |||||||||||||||||||||||||||||
| Pluralsight, LLC | First lien senior secured delayed draw term loan | 8/2029 | ||||||||||||||||||||||||||||||
| Pye-Barker Fire & Safety, LLC | First lien senior secured delayed draw term loan | 5/2026 | ||||||||||||||||||||||||||||||
| RL Datix Holdings (USA), Inc. | First lien senior secured delayed draw term loan | 4/2027 | ||||||||||||||||||||||||||||||
| Rubrik, Inc. | First lien senior secured delayed draw term loan | 6/2028 | ||||||||||||||||||||||||||||||
| Salinger Bidco Inc. (dba Surgical Information Systems) | First lien senior secured delayed draw term loan | 8/2026 | ||||||||||||||||||||||||||||||
| Severin Acquisition, LLC (dba PowerSchool) | First lien senior secured delayed draw term loan | 10/2027 | ( | |||||||||||||||||||||||||||||
| Simpler Postage, Inc. (dba Easypost) | First lien senior secured delayed draw term loan | 6/2026 | ( | |||||||||||||||||||||||||||||
| Simplicity Financial Marketing Group Holdings, Inc. | First lien senior secured delayed draw term loan | 12/2026 | ( | |||||||||||||||||||||||||||||
| Smarsh Inc. | First lien senior secured delayed draw term loan | 2/2025 | ||||||||||||||||||||||||||||||
| Spaceship Purchaser, Inc. (dba Squarespace) | First lien senior secured delayed draw term loan | 10/2026 | ||||||||||||||||||||||||||||||
| Spaceship Purchaser, Inc. (dba Squarespace) | First lien senior secured delayed draw term loan | 10/2027 | ( | |||||||||||||||||||||||||||||
| Zendesk, Inc. | First lien senior secured delayed draw term loan | 11/2025 | ||||||||||||||||||||||||||||||
| Non-controlled/non-affiliated - revolving debt commitments | ||||||||||||||||||||||||||||||||
| Acquia Inc. | First lien senior secured revolving loan | 10/2025 | ||||||||||||||||||||||||||||||
| Activate Holdings (US) Corp. (dba Absolute Software) | First lien senior secured revolving loan | 7/2029 | ||||||||||||||||||||||||||||||
| Aerosmith Bidco 1 Limited (dba Audiotonix) | First lien senior secured revolving loan | 7/2030 | ( | |||||||||||||||||||||||||||||
| AI Titan Parent, Inc. (dba Prometheus Group) | First lien senior secured revolving loan | 8/2031 | ( | |||||||||||||||||||||||||||||
| Anaplan, Inc. | First lien senior secured revolving loan | 6/2028 | ||||||||||||||||||||||||||||||
| Aptean Acquiror, Inc. (dba Aptean) | First lien senior secured revolving loan | 1/2031 | ( | |||||||||||||||||||||||||||||
| Artifact Bidco, Inc. (dba Avetta) | First lien senior secured revolving loan | 7/2030 | ( | |||||||||||||||||||||||||||||
| Associations, Inc. | First lien senior secured revolving loan | 7/2028 | ||||||||||||||||||||||||||||||
| Avalara, Inc. | First lien senior secured revolving loan | 10/2028 | ||||||||||||||||||||||||||||||
| Azurite Intermediate Holdings, Inc. (dba Alteryx, Inc.) | First lien senior secured revolving loan | 3/2031 | ( | |||||||||||||||||||||||||||||
| Bamboo US BidCo LLC | First lien senior secured revolving loan | 10/2029 | ||||||||||||||||||||||||||||||
| Bayshore Intermediate #2, L.P. (dba Boomi) | First lien senior secured revolving loan | 10/2027 | ||||||||||||||||||||||||||||||
| BCPE Osprey Buyer, Inc. (dba PartsSource) | First lien senior secured revolving loan | 8/2026 | ||||||||||||||||||||||||||||||
F-42
Blue Owl Technology Finance Corp.
Consolidated Schedule of Investments
As of December 31, 2024
(Amounts in thousands, except share amounts)
Unfunded | ||||||||||||||||||||||||||||||||
| Portfolio Company | Commitment Type | Commitment Expiration Date | Funded Commitment | Commitment | Fair Value(27) | |||||||||||||||||||||||||||
| BCTO BSI Buyer, Inc. (dba Buildertrend) | First lien senior secured revolving loan | 12/2026 | ||||||||||||||||||||||||||||||
| BTRS HOLDINGS INC. (dba Billtrust) | First lien senior secured revolving loan | 12/2028 | ||||||||||||||||||||||||||||||
| Catalis Intermediate, Inc. (fka GovBrands Intermediate, Inc.) | First lien senior secured revolving loan | 8/2027 | ||||||||||||||||||||||||||||||
| Certinia Inc. | First lien senior secured revolving loan | 8/2029 | ||||||||||||||||||||||||||||||
| CivicPlus, LLC | First lien senior secured revolving loan | 8/2027 | ||||||||||||||||||||||||||||||
| Coupa Holdings, LLC | First lien senior secured revolving loan | 2/2029 | ||||||||||||||||||||||||||||||
| Creek Parent, Inc. (dba Catalent) | First lien senior secured revolving loan | 12/2031 | ( | |||||||||||||||||||||||||||||
| Crewline Buyer, Inc. (dba New Relic) | First lien senior secured revolving loan | 11/2030 | ( | |||||||||||||||||||||||||||||
| CT Technologies Intermediate Holdings, Inc. (& Smart Holdings Corp.) (dba Datavant) | First lien senior secured revolving loan | 8/2031 | ( | |||||||||||||||||||||||||||||
| Delinea Buyer, Inc. (f/k/a Centrify) | First lien senior secured revolving loan | 3/2027 | ||||||||||||||||||||||||||||||
| Disco Parent, Inc. (dba Duck Creek Technologies, Inc.) | First lien senior secured revolving loan | 3/2029 | ( | |||||||||||||||||||||||||||||
| EET Buyer, Inc. (dba e-Emphasys) | First lien senior secured revolving loan | 11/2027 | ||||||||||||||||||||||||||||||
| Entrata, Inc. | First lien senior secured revolving loan | 7/2028 | ||||||||||||||||||||||||||||||
| Finastra USA, Inc. | First lien senior secured revolving loan | 9/2029 | ||||||||||||||||||||||||||||||
| Forescout Technologies, Inc. | First lien senior secured revolving loan | 5/2030 | ( | |||||||||||||||||||||||||||||
| Fullsteam Operations, LLC | First lien senior secured revolving loan | 11/2029 | ||||||||||||||||||||||||||||||
| Gainsight, Inc. | First lien senior secured revolving loan | 7/2027 | ||||||||||||||||||||||||||||||
| Gerson Lehrman Group, Inc. | First lien senior secured revolving loan | 12/2027 | ( | |||||||||||||||||||||||||||||
| GI Ranger Intermediate, LLC (dba Rectangle Health) | First lien senior secured revolving loan | 10/2027 | ||||||||||||||||||||||||||||||
| Granicus, Inc. | First lien senior secured revolving loan | 1/2031 | ||||||||||||||||||||||||||||||
| GS Acquisitionco, Inc. (dba insightsoftware) | First lien senior secured revolving loan | 5/2028 | ( | |||||||||||||||||||||||||||||
| H&F Opportunities LUX III S.À R.L (dba Checkmarx) | First lien senior secured revolving loan | 4/2026 | ( | |||||||||||||||||||||||||||||
| Hyland Software, Inc. | First lien senior secured revolving loan | 9/2029 | ||||||||||||||||||||||||||||||
| Icefall Parent, Inc. (dba EngageSmart) | First lien senior secured revolving loan | 1/2030 | ||||||||||||||||||||||||||||||
| Indikami Bidco, LLC (dba IntegriChain) | First lien senior secured revolving loan | 6/2030 | ||||||||||||||||||||||||||||||
| Integrity Marketing Acquisition, LLC | First lien senior secured revolving loan | 8/2028 | ||||||||||||||||||||||||||||||
| Intelerad Medical Systems Incorporated (fka 11849573 Canada Inc.)* | First lien senior secured revolving loan | 8/2026 | ||||||||||||||||||||||||||||||
| Interoperability Bidco, Inc. (dba Lyniate) | First lien senior secured revolving loan | 3/2028 | ||||||||||||||||||||||||||||||
| IRI Group Holdings, Inc. (f/k/a Circana Group, L.P. (f/k/a The NPD Group, L.P.)) | First lien senior secured revolving loan | 12/2027 | ||||||||||||||||||||||||||||||
| JS Parent, Inc. (dba Jama Software) | First lien senior secured revolving loan | 4/2031 | ||||||||||||||||||||||||||||||
| Kaseya Inc. | First lien senior secured revolving loan | 6/2029 | ||||||||||||||||||||||||||||||
| KWOL Acquisition Inc. (dba Worldwide Clinical Trials) | First lien senior secured revolving loan | 12/2029 | ||||||||||||||||||||||||||||||
| Litera Bidco LLC | First lien senior secured revolving loan | 5/2028 | ( | |||||||||||||||||||||||||||||
F-43
Blue Owl Technology Finance Corp.
Consolidated Schedule of Investments
As of December 31, 2024
(Amounts in thousands, except share amounts)
Unfunded | ||||||||||||||||||||||||||||||||
| Portfolio Company | Commitment Type | Commitment Expiration Date | Funded Commitment | Commitment | Fair Value(27) | |||||||||||||||||||||||||||
| LogRhythm, Inc. | First lien senior secured revolving loan | 7/2029 | ( | |||||||||||||||||||||||||||||
| Magnet Forensics, LLC (f/k/a Grayshift, LLC) | First lien senior secured revolving loan | 7/2028 | ||||||||||||||||||||||||||||||
| ManTech International Corporation | First lien senior secured revolving loan | 9/2028 | ||||||||||||||||||||||||||||||
| MINDBODY, Inc. | First lien senior secured revolving loan | 9/2025 | ||||||||||||||||||||||||||||||
| Ministry Brands Holdings, LLC | First lien senior secured revolving loan | 12/2027 | ( | |||||||||||||||||||||||||||||
| Minotaur Acquisition, Inc. (dba Inspira Financial) | First lien senior secured revolving loan | 6/2030 | ( | |||||||||||||||||||||||||||||
| Monotype Imaging Holdings Inc. | First lien senior secured revolving loan | 2/2030 | ( | |||||||||||||||||||||||||||||
| Neptune Holdings, Inc. (dba NexTech) | First lien senior secured revolving loan | 8/2029 | ||||||||||||||||||||||||||||||
| NMI Acquisitionco, Inc. (dba Network Merchants) | First lien senior secured revolving loan | 9/2028 | ||||||||||||||||||||||||||||||
| Oranje Holdco, Inc. (dba KnowBe4) | First lien senior secured revolving loan | 2/2029 | ||||||||||||||||||||||||||||||
| PDI TA Holdings, Inc. | First lien senior secured revolving loan | 2/2031 | ( | |||||||||||||||||||||||||||||
| PetVet Care Centers, LLC | First lien senior secured revolving loan | 11/2029 | ( | |||||||||||||||||||||||||||||
| Ping Identity Holding Corp. | First lien senior secured revolving loan | 10/2028 | ||||||||||||||||||||||||||||||
| Pluralsight, LLC | First lien senior secured revolving loan | 8/2029 | ||||||||||||||||||||||||||||||
| Pye-Barker Fire & Safety, LLC | First lien senior secured revolving loan | 5/2030 | ||||||||||||||||||||||||||||||
| QAD, Inc. | First lien senior secured revolving loan | 11/2027 | ( | |||||||||||||||||||||||||||||
| Relativity ODA LLC | First lien senior secured revolving loan | 5/2029 | ( | |||||||||||||||||||||||||||||
| RL Datix Holdings (USA), Inc. | First lien senior secured revolving loan | 10/2030 | ||||||||||||||||||||||||||||||
| SailPoint Technologies Holdings, Inc. | First lien senior secured revolving loan | 8/2028 | ||||||||||||||||||||||||||||||
| Salinger Bidco Inc. (dba Surgical Information Systems) | First lien senior secured revolving loan | 5/2031 | ( | |||||||||||||||||||||||||||||
| Securonix, Inc. | First lien senior secured revolving loan | 4/2028 | ||||||||||||||||||||||||||||||
| Severin Acquisition, LLC (dba PowerSchool) | First lien senior secured revolving loan | 10/2031 | ( | |||||||||||||||||||||||||||||
| Simplicity Financial Marketing Group Holdings, Inc. | First lien senior secured revolving loan | 12/2031 | ( | |||||||||||||||||||||||||||||
| Smarsh Inc. | First lien senior secured revolving loan | 2/2029 | ||||||||||||||||||||||||||||||
| Spaceship Purchaser, Inc. (dba Squarespace) | First lien senior secured revolving loan | 10/2031 | ( | |||||||||||||||||||||||||||||
| Talon MidCo 2 Limited | First lien senior secured revolving loan | 8/2028 | ||||||||||||||||||||||||||||||
| Tamarack Intermediate, L.L.C. (dba Verisk 3E) | First lien senior secured revolving loan | 3/2028 | ( | |||||||||||||||||||||||||||||
| Thunder Purchaser, Inc. (dba Vector Solutions) | First lien senior secured revolving loan | 6/2027 | ( | |||||||||||||||||||||||||||||
| Velocity HoldCo III Inc. (dba VelocityEHS) | First lien senior secured revolving loan | 4/2026 | ||||||||||||||||||||||||||||||
| When I Work, Inc. | First lien senior secured revolving loan | 11/2027 | ( | |||||||||||||||||||||||||||||
| Zendesk, Inc. | First lien senior secured revolving loan | 11/2028 | ||||||||||||||||||||||||||||||
| Non-controlled/affiliated - delayed draw debt commitments | ||||||||||||||||||||||||||||||||
| Walker Edison Furniture Company LLC | First lien senior secured delayed draw term loan | 3/2027 | ||||||||||||||||||||||||||||||
| Non-controlled/affiliated revolving debt commitments | ||||||||||||||||||||||||||||||||
| Walker Edison Furniture Company LLC* | First lien senior secured revolving loan | 3/2027 | ||||||||||||||||||||||||||||||
F-44
Blue Owl Technology Finance Corp.
Consolidated Schedule of Investments
As of December 31, 2024
(Amounts in thousands, except share amounts)
Unfunded | ||||||||||||||||||||||||||||||||
| Portfolio Company | Commitment Type | Commitment Expiration Date | Funded Commitment | Commitment | Fair Value(27) | |||||||||||||||||||||||||||
| Non-controlled/non-affiliated equity | ||||||||||||||||||||||||||||||||
| AAM Series 1.1 Rail and Domestic Intermodal Feeder, LLC | LLC Interest | N/A | ||||||||||||||||||||||||||||||
| AAM Series 2.1 Aviation Feeder, LLC | LLC Interest | N/A | ||||||||||||||||||||||||||||||
| Non-controlled/affiliated - equity commitments | ||||||||||||||||||||||||||||||||
| LSI Financing LLC | Common Equity | N/A | ||||||||||||||||||||||||||||||
| Total Portfolio Company Commitments | $ | $ | $ | ( | ||||||||||||||||||||||||||||
*Fully funded
(15)The date disclosed represents the commitment period of the unfunded term loan. Upon expiration of the commitment period, the funded portion of the term loan may be subject to a longer maturity date.
(16)Security acquired in transaction exempt from registration under the Securities Act of 1933, as amended (the “Securities Act”), and may be deemed to be “restricted securities” under the Securities Act. As of December 31, 2024, the aggregate fair value of these securities is $1.35 billion or 37.3 % of the Company’s net assets. The acquisition dates of the restricted securities are as follows:
| Portfolio Company | Investment | Acquisition Date | ||||||||||||
| 6Sense Insights, Inc. | Series E-1 Preferred Stock | January 20, 2022 | ||||||||||||
| AAM Series 1.1 Rail and Domestic Intermodal Feeder, LLC | LLC Interest | July 1, 2022 | ||||||||||||
| AAM Series 2.1 Aviation Feeder, LLC | LLC interest | July 1, 2022 | ||||||||||||
| Algolia, Inc. | Series C Preferred Stock | August 30, 2019 | ||||||||||||
| Algolia, Inc. | Series D Preferred Stock | July 19, 2021 | ||||||||||||
| Project Alpine Co-Invest Fund, LP | LP Interest | June 13, 2022 | ||||||||||||
| AlphaSense, LLC | Series E Preferred Shares | June 27, 2024 | ||||||||||||
| Alpha Partners Technology Merger Corp | Warrants | July 28, 2021 | ||||||||||||
| Amergin Asset Management, LLC | Class A Units | July 1, 2022 | ||||||||||||
| Arctic Wolf Networks, Inc. | Preferred Stock | July 7, 2021 | ||||||||||||
| BCTO WIW Holdings, Inc. (dba When I Work) | Class A Common Stock | November 2, 2021 | ||||||||||||
| BEHP Co-Investor II, L.P. | LP Interest | May 11, 2022 | ||||||||||||
| Blend Labs, Inc. | Warrants | July 2, 2021 | ||||||||||||
| Blue Owl Credit SLF LLC | LLC Interest | August 1, 2024 | ||||||||||||
| Bolt Technology OÜ | Preferred Stock | December 10, 2021 | ||||||||||||
| Brooklyn Lender Co-Invest 2, L.P. (dba Boomi) | Common Units | October 1, 2021 | ||||||||||||
| Brex, Inc. | Preferred Stock | November 30, 2021 | ||||||||||||
| Circle Internet Services, Inc. | Series D Preferred Stock | May 20, 2019 | ||||||||||||
| Circle Internet Services, Inc. | Series E Preferred Stock | February 28, 2020 | ||||||||||||
| Circle Internet Services, Inc. | Series F Preferred Stock | May 4, 2021 | ||||||||||||
| Circle Internet Services, Inc. | Subordinated Convertible Security | April 12, 2024 | ||||||||||||
| Circle Internet Services, Inc. | Warrants | May 20, 2019 | ||||||||||||
| CloudPay, Inc. | Series E Preferred Stock | July 31, 2024 | ||||||||||||
| Diligent Preferred Issuer, Inc. (dba Diligent Corporation) | Preferred Stock | April 6, 2021 | ||||||||||||
| Dodge Construction Network Holdings, L.P. | Class A-2 Common Units | February 23, 2022 | ||||||||||||
| Dodge Construction Network Holdings, L.P. | Series A Preferred Units | February 23, 2022 | ||||||||||||
| Elliott Alto Co-Investor Aggregator L.P. | LP Interest | September 27, 2022 | ||||||||||||
| EShares, Inc. (dba Carta) | Series E Preferred Stock | August 1, 2019 | ||||||||||||
| Excalibur CombineCo, L.P. | Class A Units | July 2, 2024 | ||||||||||||
| Fifth Season Investments LLC | Class A Units | July 18, 2022 | ||||||||||||
| Halo Parent Newco, LLC | Class H PIK Preferred Equity | October 15, 2021 | ||||||||||||
| Harness, Inc. | Junior Preferred Stock | May 24, 2024 | ||||||||||||
| Help HP SCF Investor, LP | LP Interest | April 28, 2021 | ||||||||||||
| Project Hotel California Co-Invest Fund, L.P. | LP Interest | August 9, 2022 | ||||||||||||
F-45
Blue Owl Technology Finance Corp.
Consolidated Schedule of Investments
As of December 31, 2024
(Amounts in thousands, except share amounts)
| Portfolio Company | Investment | Acquisition Date | ||||||||||||
| Illumio, Inc. | Common stock | June 23, 2021 | ||||||||||||
| Illumio, Inc. | Series F Preferred Stock | August 27, 2021 | ||||||||||||
| Insight CP (Blocker) Holdings, L.P. (dba CivicPlus, LLC) | LP Interest | June 8, 2022 | ||||||||||||
| JumpCloud, Inc. | Series B Preferred Stock | December 30, 2021 | ||||||||||||
| JumpCloud, Inc. | Series F Preferred Stock | September 3, 2021 | ||||||||||||
| Kajabi Holdings, LLC | Senior Preferred Class D Units | March 24, 2021 | ||||||||||||
| Klaviyo, Inc. | Series B Common Stock | May 4, 2021 | ||||||||||||
| KWOL Acquisition Inc. (dba Worldwide Clinical Trials) | Class A Interest | December 12, 2023 | ||||||||||||
| Knockout Intermediate Holdings I Inc. (dba Kaseya Inc.) | Perpetual Preferred Stock | June 22, 2022 | ||||||||||||
| Linked Store Cayman Ltd. (dba Nuvemshop) | Series E Preferred Stock | August 9, 2021 | ||||||||||||
| LSI Financing 1 DAC | Series 1 Notes | December 14, 2022 | ||||||||||||
| LSI Financing LLC | Common Equity | November 25, 2024 | ||||||||||||
| MessageBird Holding B.V. | Extended Series C Warrants | May 5, 2021 | ||||||||||||
| Minerva Holdco, Inc. | Senior A Preferred Stock | February 15, 2022 | ||||||||||||
| Nylas, Inc. | Series C Preferred Stock | June 3, 2021 | ||||||||||||
| Paradigmatic Holdco LLC (dba Pluralsight) | Common stock | August 22, 2024 | ||||||||||||
| Replicated, Inc. | Series C Preferred Stock | June 30, 2021 | ||||||||||||
| Revolut Ribbit Holdings, LLC | Ordinary Shares | September 30, 2021 | ||||||||||||
| Romulus Intermediate Holdings 1 Inc. (dba PetVet Care Centers) | Series A Preferred Stock | November 15, 2023 | ||||||||||||
| Saturn Ultimate, Inc. | Common stock | December 29, 2021 | ||||||||||||
| Securiti, Inc. | Series C Preferred Shares | July 28, 2022 | ||||||||||||
| Signifyd Inc. | Preferred equity | April 8, 2021 | ||||||||||||
| Simpler Postage, Inc. (dba Easypost) | Warrants | June 11, 2024 | ||||||||||||
| SLA Eclipse Co-Invest, L.P. | LP Interest | September 30, 2019 | ||||||||||||
| Space Exploration Technologies Corp. | Class A Common Stock | March 25, 2021 | ||||||||||||
| Space Exploration Technologies Corp. | Class C Common Stock | March 25, 2021 | ||||||||||||
| Sunshine Software Holdings, Inc. (dba Cornerstone OnDemand, Inc.) | Series A Preferred Stock | October 15, 2021 | ||||||||||||
| Thunder Topco L.P. (dba Vector Solutions) | Common Units | June 30, 2021 | ||||||||||||
| TravelPerk, Inc. | Warrants | May 1, 2024 | ||||||||||||
| VEPF Torreys Aggregator, LLC (dba MINDBODY, Inc.) | Series A Preferred Stock | October 15, 2021 | ||||||||||||
| Vestwell Holdings, Inc. | Series D Preferred Stock | December 20, 2023 | ||||||||||||
| Walker Edison Holdco LLC | Common Units | March 1, 2023 | ||||||||||||
| WMC Bidco, Inc. (dba West Monroe) | Senior Preferred Stock | November 9, 2021 | ||||||||||||
| WP Irving Co-Invest, L.P. | Partnership Units | May 18, 2022 | ||||||||||||
| XOMA Corporation | Warrants | December 15, 2023 | ||||||||||||
| Zoro TopCo, Inc. | Series A Preferred Equity | November 22, 2022 | ||||||||||||
| Zoro TopCo, L.P. | Class A Common Units | November 22, 2022 | ||||||||||||
(17)Unless otherwise indicated, the Company’s portfolio companies are pledged as collateral supporting the amounts outstanding under the Revolving Credit Facility, SPV Asset Facility I, SPV Asset Facility II and CLO 2020-1. See “Note 5 — Debt”.
(18)This portfolio company is not pledged as collateral supporting the amounts outstanding under the Revolving Credit Facility, SPV Asset Facility I, SPV Asset Facility II and CLO 2020-1. See “Note 5 — Debt”.
(19)Unless otherwise indicated, all investments are non-controlled, non-affiliated investments. Non-controlled, non-affiliated investments are defined as investments in which the Company owns less than 5% of the portfolio company’s outstanding voting securities and does not have the power to exercise control over the management or policies of such portfolio company.
(20)Under the Investment Company Act of 1940, as amended (the “1940 Act”), the Company is deemed to be an “Affiliated Person” of, as defined in the 1940 Act, this portfolio company, as the Company owns more than 5% but less than 25% of the portfolio company’s
F-46
Blue Owl Technology Finance Corp.
Consolidated Schedule of Investments
As of December 31, 2024
(Amounts in thousands, except share amounts)
outstanding voting securities. Transactions during the period ended December 31, 2024 in which the Company was an Affiliated Person of the portfolio company are as follows:
| Company | Fair Value at December 31, 2023 | Gross Additions (a) | Gross Reductions(b) | Net Change in Unrealized Gain/(Loss) | Realized Gain/(Loss) | Transfers | Fair Value at December 31, 2024 | Interest and PIK Interest Income | Dividend and PIK Dividend Income | Other Income | ||||||||||||||||||||||||||||||||||||||||||||||||||||
| Fifth Season Investments LLC | $ | $ | $ | ( | $ | $ | $ | $ | $ | $ | $ | |||||||||||||||||||||||||||||||||||||||||||||||||||
| Help HP SCF Investor, LP | ( | |||||||||||||||||||||||||||||||||||||||||||||||||||||||||||||
| LSI Financing LLC | ( | ( | ||||||||||||||||||||||||||||||||||||||||||||||||||||||||||||
| LSI Financing 1 DAC | ( | ( | ||||||||||||||||||||||||||||||||||||||||||||||||||||||||||||
| Pluralsight, LLC | ||||||||||||||||||||||||||||||||||||||||||||||||||||||||||||||
| Signifyd Inc. | ( | |||||||||||||||||||||||||||||||||||||||||||||||||||||||||||||
| Split Software, Inc. | ( | ( | ||||||||||||||||||||||||||||||||||||||||||||||||||||||||||||
| Walker Edison Furniture Company LLC | ( | |||||||||||||||||||||||||||||||||||||||||||||||||||||||||||||
| Total | $ | $ | $ | ( | $ | ( | $ | ( | $ | $ | $ | $ | $ | |||||||||||||||||||||||||||||||||||||||||||||||||
_______________
(a)Gross additions include increases in the cost basis of investments resulting from new investments, payment-in-kind interest or dividends, and the amortization of any unearned income or discounts on equity investments, as applicable.
(b)Gross reductions include decreases in the cost basis of investments resulting from principal collections related to investment repayments or sales, and the amortization of any premiums on equity investments, as applicable.
(21)As defined in the 1940 act, the Company is deemed to be both an “Affiliated Person” and has “Control” of this portfolio company as the Company owns more than 25% of the portfolio company’s outstanding voting securities or has the power to exercise control over management or policies of such portfolio company, including through a management agreement (“controlled affiliate”). The Company’s investments in controlled affiliates for the period ended December 31, 2024 were as follows:
| Company | Fair Value at December 31, 2023 | Gross Additions (a) | Gross Reductions(b) | Net Change in Unrealized Gain/(Loss) | Realized Gain/(Loss) | Transfers | Fair Value at December 31, 2024 | Interest and PIK Interest Income | Dividend and PIK Dividend Income | Other Income | ||||||||||||||||||||||||||||||||||||||||||||||||||||
| Blue Owl Credit SLF LLC | $ | $ | $ | ( | $ | ( | $ | $ | $ | $ | $ | $ | ||||||||||||||||||||||||||||||||||||||||||||||||||
| Revolut Ribbit Holdings, LLC | ||||||||||||||||||||||||||||||||||||||||||||||||||||||||||||||
| Total | $ | $ | $ | ( | $ | $ | $ | $ | $ | $ | $ | |||||||||||||||||||||||||||||||||||||||||||||||||||
(a)Gross additions include increases in the cost basis of investments resulting from new investments, payment-in-kind interest or dividends, and the amortization of any unearned income or discounts on equity investments, as applicable.
(b)Gross reductions include decreases in the cost basis of investments resulting from principal collections related to investment repayments or sales, and the amortization of any premiums on equity investments, as applicable.
(22)This portfolio company is not a qualifying asset under Section 55(a) of the 1940 Act. Under the 1940 Act, the Company may not acquire any non-qualifying asset unless, at the time such acquisition is made, qualifying assets represent at least 70% of total assets. As of December 31, 2024, non-qualifying assets represented 14.2 % of total assets as calculated in accordance with the regulatory requirements.
(23)Non-income producing investment.
(24)Loan was on non-accrual status as of December 31, 2024.
(25)Contains a fixed-rate structure.
(26)Harness Inc. has retained 304,990 shares until June 11, 2026 as a security for indemnity obligations detailed in the Merger Agreement with Split Software, Inc.
(27)The negative cost and fair value results from unamortized fees, which are capitalized to the investment cost of unfunded commitments.
The accompanying notes are an integral part of these consolidated financial statements.
F-47
Blue Owl Technology Finance Corp.
Consolidated Statements of Changes in Net Assets
(Amounts in thousands)
| For the Years Ended December 31, | |||||||||||||||||
| 2025 | 2024 | 2023 | |||||||||||||||
| Increase (Decrease) in Net Assets Resulting from Operations | |||||||||||||||||
| Net investment income (loss) | $ | $ | $ | ||||||||||||||
| Net change in unrealized gain (loss) | ( | ||||||||||||||||
| Net realized gain (loss) | ( | ||||||||||||||||
| Net Increase (Decrease) in Net Assets Resulting from Operations | |||||||||||||||||
| Distributions | |||||||||||||||||
| Distributions declared from earnings | ( | ( | ( | ||||||||||||||
| Net Decrease in Net Assets Resulting from Shareholders' Distributions | ( | ( | ( | ||||||||||||||
| Capital Share Transactions | |||||||||||||||||
Issuance of common shares in connection with the Mergers(1) | |||||||||||||||||
| Repurchase of common shares | ( | ||||||||||||||||
| Reinvestment of distributions | |||||||||||||||||
| Net Increase (Decrease) in Net Assets Resulting from Capital Share Transactions | |||||||||||||||||
| Total Increase (Decrease) in Net Assets | |||||||||||||||||
| Net Assets, at beginning of period | |||||||||||||||||
| Net Assets, at end of period | $ | $ | $ | ||||||||||||||
(1)Refer to “Note 13 — Merger with Blue Owl Technology Finance Corp. II (“OTF II”)” for additional information on the merger between the Company and OTF II (the “Mergers”).
The accompanying notes are an integral part of these consolidated financial statements.
F-48
Blue Owl Technology Finance Corp.
Consolidated Statements of Cash Flows
(Amounts in thousands)
| For the Years Ended December 31, | |||||||||||||||||
| 2025 | 2024 | 2023 | |||||||||||||||
| Cash Flows from Operating Activities | |||||||||||||||||
| Net Increase (Decrease) in Net Assets Resulting from Operations | $ | $ | $ | ||||||||||||||
Adjustments to reconcile net increase (decrease) in net assets resulting from operations to net cash provided by (used in) operating activities: | |||||||||||||||||
| Purchases of investments, net | ( | ( | ( | ||||||||||||||
| Proceeds from investments and investment repayments, net | |||||||||||||||||
| Net amortization/accretion of premium/discount on investments | ( | ( | ( | ||||||||||||||
| Net change in unrealized (gain) loss on investments | ( | ( | |||||||||||||||
| Net change in unrealized (gain) loss on interest rate swaps attributed to unsecured notes | |||||||||||||||||
| Net change in unrealized (gain) loss on forward contracts | |||||||||||||||||
| Net change in unrealized (gain) loss on translation of assets and liabilities in foreign currencies | ( | ( | |||||||||||||||
| Net realized (gain) loss on investments | ( | ( | |||||||||||||||
| Net realized (gain) loss on foreign currency transactions relating to investments | ( | ||||||||||||||||
| Net realized (gain) loss on foreign currency transactions relating to debt | |||||||||||||||||
| Paid-in-kind interest | ( | ( | ( | ||||||||||||||
| Paid-in-kind dividends | ( | ( | ( | ||||||||||||||
| Amortization of debt issuance costs | |||||||||||||||||
| Cash acquired in the Mergers | |||||||||||||||||
| Changes in operating assets and liabilities: | |||||||||||||||||
| (Increase) decrease in interest receivable | ( | ||||||||||||||||
| (Increase) decrease in dividend income receivable | ( | ||||||||||||||||
| (Increase) decrease in paid-in-kind interest receivable | ( | ||||||||||||||||
| (Increase) decrease in prepaid expenses and other assets | ( | ( | |||||||||||||||
| Increase (decrease) in management fee payable | |||||||||||||||||
| Increase (decrease) in incentive fee payable | ( | ||||||||||||||||
| Increase (decrease) in payables to affiliates | ( | ( | |||||||||||||||
| Increase (decrease) in payable for investments purchased | ( | ||||||||||||||||
| Increase (decrease) in accrued expenses and other liabilities | ( | ( | |||||||||||||||
Net cash provided by (used in) operating activities | ( | ||||||||||||||||
| Cash Flows from Financing Activities | |||||||||||||||||
| Borrowings on debt | |||||||||||||||||
| Payments on debt | ( | ( | ( | ||||||||||||||
| Debt issuance costs | ( | ( | ( | ||||||||||||||
| Repurchases of common stock | ( | ||||||||||||||||
| Distributions paid | ( | ( | ( | ||||||||||||||
Net cash provided by (used in) financing activities | ( | ( | |||||||||||||||
Net increase (decrease) in cash and restricted cash, including foreign cash (restricted cash of $ | ( | ||||||||||||||||
Cash and restricted cash, including foreign cash, beginning of period (restricted cash of $ | |||||||||||||||||
Cash and restricted cash, including foreign cash, end of period (restricted cash of $ | $ | $ | $ | ||||||||||||||
F-49
Blue Owl Technology Finance Corp.
Consolidated Statements of Cash Flows
(Amounts in thousands)
| For the Years Ended December 31, | |||||||||||||||||
| 2025 | 2024 | 2023 | |||||||||||||||
| Supplemental and Non-Cash Information | |||||||||||||||||
| Interest paid during the period | $ | $ | $ | ||||||||||||||
| Distributions declared during the period | $ | $ | $ | ||||||||||||||
| Reinvestment of distributions during the period | $ | $ | $ | ||||||||||||||
| Distributions Payable | $ | $ | $ | ||||||||||||||
Issuance of shares in connection with the Mergers(1) | $ | $ | $ | ||||||||||||||
| Taxes, including excise tax, paid during the period | $ | $ | $ | ||||||||||||||
(1)Refer to “Note 13 — Merger with Blue Owl Technology Finance Corp. II (“OTF II”)” for additional information on the Mergers.
The accompanying notes are an integral part of these consolidated financial statements.
F-50
Blue Owl Technology Finance Corp.
Notes to Consolidated Financial Statements
Note 1. Organization
Blue Owl Technology Finance Corp. (the “Company”) is a Maryland corporation formed on July 12, 2018. The Company was formed primarily to originate and make loans to, and make debt and equity investments in, technology-related companies, specifically software companies, based primarily in the United States. The Company originates and invests in senior secured or unsecured loans, subordinated loans or mezzanine loans, and equity-related securities including common equity, warrants, preferred stock and similar forms of senior equity, which may or may not be convertible into a portfolio company’s common equity. The Company’s investment objective is to maximize total return by generating current income from its debt investments and other income producing securities, and capital appreciation from its equity and equity-linked investments.
The Company intends to invest at least 80 % of the value of its total assets in “technology-related” companies. The Company defines technology-related companies as those that (i) operate directly in the technology industry, which includes, but is not limited to, application software, systems software, healthcare technology, information technology, technology services and infrastructure, financial technology and internet and digital media, (ii) operate indirectly through their reliance on technology (i.e., utilizing scientific knowledge or technology-enabled techniques, skills, methods, devices or processes to deliver goods and/or services) or (iii) seek to grow through technological advancements and innovations. The Company invests in a broad range of companies with a focus on established enterprise software companies that are capitalizing on the large and growing demand for software products and services.
The Company has elected to be regulated as a business development company (“BDC”) under the Investment Company Act of 1940, as amended (the “1940 Act”). In addition, the Company is treated as a regulated investment company (“RIC”) under subchapter M of the Internal Revenue Code of 1986, as amended (the “Code”). Because the Company has elected to be regulated as a BDC and qualifies as a RIC under the Code, the Company’s portfolio is subject to diversification and other requirements.
On September 24, 2018, the Company formed a wholly-owned subsidiary, OR Tech Lending LLC, a Delaware limited liability company, which holds a California finance lenders license. OR Tech Lending LLC originates loans to borrowers headquartered in California. From time to time the Company may form wholly-owned subsidiaries to facilitate the normal course of business.
Blue Owl Technology Credit Advisors LLC (the “Adviser”) serves as the Company’s investment adviser, an indirect affiliate of Blue Owl Capital, Inc. (“Blue Owl”) (NYSE: OWL) and part of Blue Owl’s Credit platform. The Adviser is registered with the Securities and Exchange Commission (“SEC”) as an investment adviser under the Investment Advisers Act of 1940, as amended (the “Advisers Act”). Blue Owl consists of three investment platforms: (1) Credit, which includes several strategies, including direct lending, alternative credit, investment grade credit, liquid credit and other adjacent investment strategies, (2) GP Strategic Capital, which primarily focuses on acquiring equity stakes in or providing debt financing to large multi-product private equity and private credit firms and (3) Real Assets, which primarily focuses on the strategies of net lease real estate, real estate credit and digital infrastructure, which focuses on acquiring, financing, developing and operating data centers and related digital infrastructure assets. Subject to the overall supervision of the Company’s board of directors (the “Board”), the Adviser manages the day-to-day operations of, and provides investment advisory and management services to, the Company.
On August 10, 2018, the Company commenced its loan origination and investment activities contemporaneously with the initial drawdown from investors in the Company’s private offering. In September 2018, the Company made its first portfolio company investment.
On March 24, 2025, the Company consummated the transactions contemplated by the Agreement and Plan of Merger (the “Merger Agreement”) with Blue Owl Technology Finance Corp. II, a Maryland corporation (“OTF II”), Oriole Merger Sub Inc., a Maryland corporation and wholly-owned subsidiary of the Company (“Merger Sub”), and, solely for the limited purposes set forth therein, the Adviser, and Blue Owl Technology Credit Advisors II LLC (“OTCA II”), a Delaware limited liability company and investment adviser to OTF II. In connection therewith, Merger Sub merged with and into OTF II, with OTF II continuing as the surviving company and as a wholly-owned subsidiary of the Company (the “Initial Merger”) and, immediately thereafter, OTF II merged with and into the Company, with the Company continuing as the surviving company (together with the Initial Merger, the “Mergers”). Refer to “Note 13 — Merger with Blue Owl Technology Finance Corp. II” for further discussion of the Mergers.
On June 12, 2025, the Company’s common stock was listed and began trading on the New York Stock Exchange (“NYSE”) under the symbol “OTF” (the “Exchange Listing”).
Note 2. Significant Accounting Policies
F-51
Blue Owl Technology Finance Corp.
Notes to Consolidated Financial Statements - Continued
Basis of Presentation
The accompanying consolidated financial statements are prepared in accordance with accounting principles generally accepted in the United States of America (“U.S. GAAP”). The Company is an investment company and, therefore, applies the specialized accounting and reporting guidance in Accounting Standards Codification (“ASC”) Topic 946, Financial Services – Investment Companies. In the opinion of management, all adjustments considered necessary for the fair presentation of the consolidated financial statements have been included. The Company was initially capitalized on August 7, 2018 and commenced operations on August 10, 2018. The Company’s fiscal year ends on December 31.
Reclassifications
As a result of changes in presentations, certain prior year amounts have been reclassified to conform to the current presentation. These reclassifications had no effect on the reported results of operations.
Use of Estimates
The preparation of the consolidated financial statements in conformity with U.S. GAAP requires management to make estimates and assumptions that affect the reported amounts of assets and liabilities and disclosure of contingent assets and liabilities at the date of the consolidated financial statements. Actual amounts could differ from those estimates and such differences could be material.
Cash and Restricted Cash
Cash consists of deposits held at a custodian bank and restricted cash pledged as collateral. Cash is carried at cost, which approximates fair value. The Company deposits its cash with highly-rated banking corporations and, at times, may exceed the insured limits under applicable law.
Consolidation
As provided under Regulation S-X and ASC Topic 946 - Financial Services - Investment Companies, the Company will generally not consolidate its investment in a company other than a wholly-owned investment company or controlled operating company whose business consists of providing services to the Company. Accordingly, the Company consolidated the accounts of the Company's wholly-owned subsidiaries in its consolidated financial statements. All significant intercompany balances and transactions have been eliminated in consolidation.
The Company does not consolidate its equity interest in Blue Owl Credit SLF LLC (“Credit SLF”) or Blue Owl Leasing LLC (“Blue Owl Leasing”). For further description of the Company’s investment in Credit SLF and Blue Owl Leasing, see “Note 4 — Investments”.
Investments at Fair Value
Investment transactions are recorded on the trade date. Realized gains or losses are measured by the difference between the net proceeds received and the amortized cost basis of the investment using the specific identification method without regard to unrealized gains or losses previously recognized, and include investments charged off during the period, net of recoveries. The net change in unrealized gains or losses primarily reflects the change in investment values, including the reversal of previously recorded unrealized gains or losses with respect to investments realized during the period. Rule 2a-5 under the 1940 Act establishes requirements for determining fair value in good faith for purposes of the 1940 Act. Pursuant to Rule 2a-5, the Board designated the Adviser as the Company’s valuation designee to perform fair value determinations relating to the value of assets held by the Company for which market quotations are not readily available.
Investments for which market quotations are readily available are typically valued at the average bid price of those market quotations. To validate market quotations, the Company utilizes a number of factors to determine if the quotations are representative of fair value, including the source and number of the quotations. Debt and equity securities that are not publicly traded or whose market prices are not readily available, as is the case for substantially all of the Company’s investments, are valued at fair value as determined in good faith by the Adviser, as the valuation designee, based on, among other things, the input of the independent third-party valuation firm(s) engaged at the direction of the Adviser.
As part of the valuation process, the Adviser, as the valuation designee, takes into account relevant factors in determining the fair value of the Company’s investments, including: the estimated enterprise value of a portfolio company (i.e., the total fair value of the portfolio company’s debt and equity), the nature and realizable value of any collateral, the portfolio company’s ability to make payments based on its earnings and cash flow, the markets in which the portfolio company does business, a comparison of the portfolio company’s securities to any similar publicly traded securities, and overall changes in the interest rate environment and the credit markets that may affect the price at which similar investments may be made in the future. When an external event such as a purchase or sale transaction, public offering or subsequent equity sale occurs, the Adviser, as the valuation designee, considers whether the pricing indicated by the external event corroborates its valuation.
F-52
Blue Owl Technology Finance Corp.
Notes to Consolidated Financial Statements - Continued
The Adviser, as the valuation designee, undertakes a multi-step valuation process, which includes, among other procedures, the following:
•With respect to investments for which market quotations are readily available, those investments will typically be valued at the average bid price of those market quotations;
•With respect to investments for which market quotations are not readily available, the valuation process begins with the independent valuation firm(s) providing a preliminary valuation of each investment to the Adviser’s valuation committee;
•Preliminary valuation conclusions are documented and discussed with the Adviser’s valuation committee;
•The Adviser, as the valuation designee, reviews the recommended valuations and determines the fair value of each investment;
•Each quarter, the Adviser, as the valuation designee, will provide the Audit Committee a summary or description of material fair value matters that occurred in the prior quarter and on an annual basis, the Adviser, as the valuation designee, will provide the Audit Committee with a written assessment of the adequacy and effectiveness of its fair value process; and
•The Audit Committee oversees the valuation designee and will report to the Board on any valuation matters requiring the Board’s attention.
The Company conducts this valuation process on a quarterly basis.
The Company applies Financial Accounting Standards Board Accounting Standards Codification 820, Fair Value Measurements (“ASC 820”), as amended, which establishes a framework for measuring fair value in accordance with U.S. GAAP and required disclosures of fair value measurements. ASC 820 determines fair value to be the price that would be received for an investment in a current sale, which assumes an orderly transaction between market participants on the measurement date. Market participants are defined as buyers and sellers in the principal or most advantageous market (which may be a hypothetical market) that are independent, knowledgeable, and willing and able to transact. In accordance with ASC 820, the Company considers its principal market to be the market that has the greatest volume and level of activity. ASC 820 specifies a fair value hierarchy that prioritizes and ranks the level of observability of inputs used in determination of fair value. In accordance with ASC 820, these levels are summarized below:
•Level 1 – Valuations based on quoted prices in active markets for identical assets or liabilities that the Company has the ability to access.
•Level 2 – Valuations based on quoted prices in markets that are not active or for which all significant inputs are observable, either directly or indirectly.
•Level 3 – Valuations based on inputs that are unobservable and significant to the overall fair value measurement.
Transfers between levels, if any, are recognized at the beginning of the period in which the transfer occurs. In addition to using the above inputs in investment valuations, the Company applies the valuation policy approved by its Board that is consistent with ASC 820. Consistent with the valuation policy, the Adviser, as the valuation designee, evaluates the source of the inputs, including any markets in which its investments are trading (or any markets in which securities with similar attributes are trading), in determining fair value. When an investment is valued based on prices provided by reputable dealers or pricing services (such as broker quotes), the Adviser, as the valuation designee, subjects those prices to various criteria in making the determination as to whether a particular investment would qualify for treatment as a Level 2 or Level 3 investment. For example, the Adviser, as the valuation designee, or the independent valuation firm(s), reviews pricing support provided by dealers or pricing services in order to determine if observable market information is being used, versus unobservable inputs.
The Company applies the practical expedient provided by the ASC Topic 820 relating to investments in certain entities that calculate net asset value per share (or its equivalent). ASC Topic 820 permits an entity holding investments in certain entities that either are investment companies, or have attributes similar to an investment company, and calculate NAV per share or its equivalent for which the fair value is not readily determinable, to measure the fair value of such investments on the basis of that NAV per share, or its equivalent, without adjustment. Investments which are valued using NAV per share as a practical expedient are not categorized within the fair value hierarchy as per ASC Topic 820.
Due to the inherent uncertainty of determining the fair value of investments that do not have a readily available market value, the fair value of the Company’s investments may fluctuate from period to period. Additionally, the fair value of such investments may differ significantly from the values that would have been used had a ready market existed for such investments and may differ materially from the values that may ultimately be realized. Further, such investments are generally less liquid than publicly traded securities and may be subject to contractual and other restrictions on resale. If the Company were required to liquidate a portfolio
F-53
Blue Owl Technology Finance Corp.
Notes to Consolidated Financial Statements - Continued
investment in a forced or liquidation sale, it could realize amounts that are different from the amounts presented and such differences could be material.
In addition, changes in the market environment and other events that may occur over the life of the investments may cause the gains or losses ultimately realized on these investments to be different than the unrealized gains or losses reflected herein.
Financial and Derivative Instruments
The Company follows the guidance in ASC 815 Derivatives and Hedging, when accounting for all derivative instruments. The Company designated certain interest rate swaps as hedging instruments, and as a result, the entire change in the fair value of the hedging instrument shall be recorded in the same line item of the Consolidated Statements of Operations as the hedged item. The Company’s interest rate swaps are used to hedge the Company’s fixed rate debt, and therefore both the periodic payment and the change in fair value for the effective hedge, if applicable, will be recognized as components of interest expense in the Consolidated Statements of Operations. Fair value is estimated by discounting remaining payments using applicable current market rates, or market quotes, if available. For all other derivatives, the Company does not utilize hedge accounting and values such derivatives at fair value with the unrealized gains or losses recorded in “net change in unrealized gains (losses) from foreign currency and other transactions” in the Company’s consolidated statement of operations.
Foreign Currency Forward Contracts
The Company uses foreign currency forward contracts to reduce the Company's exposure to fluctuations in the value of foreign currencies. In a foreign currency forward contract, the Company agrees to receive or deliver a fixed quantity of one currency for another at a pre-determined price at a future date. Foreign currency forward contracts are marked-to-market at the applicable forward rate. Unrealized gains (losses) on foreign currency forward contracts are recorded within other assets or other liabilities on the Consolidated Statements of Assets and Liabilities by counterparty on a net basis. The Company does not utilize hedge accounting and values forward contracts at fair value with the unrealized gains or losses recorded in net change in unrealized gains (losses) from foreign currency and other transactions in the Company’s Consolidated Statements of Operations.
Interest Rate Swaps
The Company uses interest rate swaps to hedge some or all of the Company's fixed rate debt. The Company has designated each interest rate swap held as the hedging instrument in an effective hedge accounting relationship, and therefore the periodic payments and receipts are recognized as components of interest expense in the Consolidated Statements of Operations. Depending on the nature of the balance at period end, the fair value of the interest rate swap is either included as an other asset or other liability on the Company's Consolidated Statements of Assets and Liabilities. The change in fair value of the interest rate swap is offset by a change in the net carrying value of the fixed rate debt. Any amounts paid to the counterparty to cover collateral obligations under the terms of the interest rate swap agreement are included in other assets or other liabilities and expenses on the Company's Consolidated Statements of Assets and Liabilities. Please see “Note 5 — Debt” to the Company's Consolidated Financial Statements for additional details.
Foreign Currency
Foreign currency amounts are translated into U.S. dollars on the following basis:
•cash, fair value of investments, outstanding debt, other assets and liabilities: at the spot exchange rate on the last business day of the period; and
•purchases and sales of investments, borrowings and repayments of such borrowings, income and expenses: at the rates of exchange prevailing on the respective dates of such transactions.
The Company includes net changes in fair values on investments held resulting from foreign exchange rate fluctuations with the change in unrealized gains (losses) on translation of assets and liabilities in foreign currencies on the Consolidated Statements of Operations. Fluctuations arising from the translation of foreign currency borrowings are included with the net change in unrealized gains (losses) on translation of assets and liabilities in foreign currencies on the Consolidated Statements of Operations.
Interest and Dividend Income Recognition
PIK interest and PIK dividend income consisted of the following for the periods:
F-54
Blue Owl Technology Finance Corp.
Notes to Consolidated Financial Statements - Continued
| For the Year Ended December 31, | |||||||||||||||||
| ($ in thousands) | 2025 | 2024 | 2023 | ||||||||||||||
| PIK Interest Income | $ | $ | $ | ||||||||||||||
| PIK Interest Income as a % of Investment Income | % | % | % | ||||||||||||||
| PIK Dividend Income | $ | $ | $ | ||||||||||||||
| PIK Dividend Income as a % of Investment Income | % | % | % | ||||||||||||||
| Total PIK Income | $ | $ | $ | ||||||||||||||
| Total PIK Income as a % of Investment Income | % | % | % | ||||||||||||||
Discounts and premiums to par value on securities purchased are amortized into interest income over the contractual life of the respective security using the effective yield method. The amortized cost of investments represents the original cost adjusted for the amortization and accretion of discounts or premiums, if any. Upon prepayment of a loan or debt security, any prepayment premiums, unamortized upfront loan origination fees and unamortized discounts are recorded as interest income in the current period.
Loans are generally placed on non-accrual status when there is reasonable doubt that principal or interest will be collected in full. Accrued interest is generally reversed when a loan is placed on non-accrual status. Interest payments received on non-accrual loans may be recognized as income or applied to principal depending upon management’s judgment regarding collectability. If at any point the Company believes PIK interest is not expected to be realized, the investment generating PIK interest will be placed on non-accrual status. When a PIK investment is placed on non-accrual status, the accrued, uncapitalized interest or dividends are generally reversed through interest income. Non-accrual loans are restored to accrual status when past due principal and interest is paid current and, in management’s judgment, are likely to remain current. Management may make exceptions to this treatment and determine to not place a loan on non-accrual status if the loan has sufficient collateral value and is in the process of collection.
Dividend income on preferred equity securities is recorded on the accrual basis to the extent that such amounts are payable by the portfolio company and are expected to be collected. Dividend income on common equity securities is recorded on the record date for private portfolio companies or on the ex-dividend date for publicly-traded portfolio companies.
Other Income
Offering Expenses
Costs associated with the offering of common shares of the Company are capitalized as deferred offering expenses and are included in prepaid expenses and other assets in the Consolidated Statements of Assets and Liabilities and are amortized over a twelve-month period from incurrence. Expenses for any additional offerings are deferred and amortized as incurred. These expenses consist primarily of legal fees and other costs incurred in connection with the Company’s share offerings, the preparation of the Company’s registration statement, and registration fees.
Debt Issuance Costs
The Company records origination and other expenses related to its debt obligations as debt issuance costs. These expenses are deferred and amortized utilizing the effective yield method, over the estimated life of the related debt instrument. Debt issuance costs are presented on the Consolidated Statements of Assets and Liabilities as a direct deduction from the debt liability. In circumstances in which there is not an associated debt liability amount recorded in the consolidated financial statements when the debt issuance costs are incurred, such debt issuance costs will be reported on the Consolidated Statements of Assets and Liabilities as an asset until the debt liability is recorded.
Reimbursement of Transaction-Related Expenses
The Company may receive reimbursement for certain transaction-related expenses in pursuing investments. Transaction-related expenses, which are generally expected to be reimbursed by the Company’s portfolio companies, are typically deferred until the transaction is consummated and are recorded in prepaid expenses and other assets on the date incurred. The costs of successfully completed investments not otherwise reimbursed are borne by the Company and are included as a component of the investment’s cost basis.
Cash advances received in respect of transaction-related expenses are recorded as cash with an offset to accrued expenses and other liabilities. Accrued expenses and other liabilities are relieved as reimbursable expenses are incurred.
F-55
Blue Owl Technology Finance Corp.
Notes to Consolidated Financial Statements - Continued
Income Taxes
The Company has elected to be treated as a BDC under the 1940 Act. The Company has elected to be treated as a RIC under the Code beginning with its taxable year ending December 31, 2018 and intends to continue to qualify annually thereafter as a RIC. So long as the Company maintains its tax treatment as a RIC, it generally will not pay U.S. federal income taxes on any ordinary income or capital gains that it distributes at least annually to its shareholders as dividends. Rather, any tax liability related to income earned and distributed by the Company represents obligations of the Company’s investors and will not be reflected in the consolidated financial statements of the Company. However, the Company will be subject to U.S. federal income tax imposed at corporate rates on any income, including capital gains not distributed (or deemed distributed) to its stockholders.
To qualify as a RIC, the Company must, among other things, meet certain source-of-income and asset diversification requirements. In addition, to qualify for RIC tax treatment, the Company generally must distribute to its shareholders on a timely basis, at least the sum of (i) 90% of its “investment company taxable income” for that year, which is generally its ordinary income plus the excess, if any, of its realized net short-term capital gains over its realized net long-term capital losses and (ii) its net tax-exempt income. In order for the Company not to be subject to U.S. federal excise taxes, it must distribute annually an amount at least equal to the sum of (i) 98% of its net ordinary income (taking into account certain deferrals and elections) for the calendar year, (ii) 98.2% of its capital gains in excess of capital losses for the one-year period ending on October 31 of the calendar year and (iii) certain undistributed amounts from previous years on which the Company paid no U.S. federal income tax. The Company, at its discretion, may carry forward taxable income in excess of calendar year dividends and pay a 4% nondeductible U.S. federal excise tax on this income.
Certain of the Company’s consolidated subsidiaries are subject to U.S. federal and state income taxes imposed at corporate rates.
The Company evaluates tax positions taken or expected to be taken in the course of preparing its financial statements to determine whether the tax positions are “more-likely-than-not” to be sustained by the applicable tax authority. Tax positions not deemed to meet the “more-likely-than-not” threshold are reserved and recorded as a tax benefit or expense in the current year. All penalties and interest associated with income taxes are included in income tax expense. Conclusions regarding tax positions are subject to review and may be adjusted at a later date based on factors including, but not limited to, on-going analyses of tax laws, regulations and interpretations thereof. There were no material uncertain tax positions through December 31, 2025. As applicable, the Company’s prior three tax years remain subject to examination by U.S. federal, state and local tax authorities.
Distributions to Common Shareholders
Distributions to common shareholders are recorded on the record date. The amount to be distributed is determined by the Board and is generally based upon the earnings estimated by the Adviser. In addition, the Board may consider the level of undistributed taxable income carried forward from the prior year for distribution in the current year. Undistributed long-term capital gains, if any, would be generally distributed at least annually, although the Company may decide to retain such capital gains for investment.
The Company has adopted an “opt out” dividend reinvestment plan that provides for reinvestment of any cash distributions on behalf of shareholders, unless a shareholder elects to receive cash. As a result, if the Board authorizes and declares a cash distribution, then the shareholders who have not “opted out” of the dividend reinvestment plan will have their cash distribution automatically reinvested in additional shares of the Company’s common stock, rather than receiving the cash distribution. The Company expects to use newly issued shares or shares purchased in the open market to implement the dividend reinvestment plan.
Segment Reporting
In accordance with ASC Topic 280 – “Segment Reporting (ASC 280),” the Company has determined that it has a single operating and reporting segment. As a result, the Company’s segment accounting policies are the same as described herein and the Company does not have any intra-segment sales and transfers of assets.
The Company operates through a single operating and reporting segment with an investment objective to generate both current income, and to a lesser extent, capital appreciation through debt and equity investments. The chief operating decision maker (“CODM”) is comprised of the Company’s chief executive officer, president, and chief financial officer and chief operating officer and assesses the performance and makes operating decisions of the Company on a consolidated basis primarily based on the Company’s net increase in shareholder’s equity resulting from operations (“net income”). In addition to numerous other factors and metrics, the CODM utilizes net income as a key metric in determining the amount of dividends to be distributed to the Company’s stockholders. As the Company’s operations comprise of a single reporting segment, the segment assets are reflected on the accompanying consolidated balance sheet as “total assets” and the significant segment expenses are listed on the accompanying consolidated statement of operations.
F-56
Blue Owl Technology Finance Corp.
Notes to Consolidated Financial Statements - Continued
New Accounting Pronouncements
In December 2023, the FASB issued ASU No. 2023-09, “Income Taxes (Topic 740),” which updates annual income tax disclosure requirements related to rate reconciliation, income taxes paid and other disclosures. The Company adopted ASU 2023-09 effective December 31, 2025, and concluded the adoption of the standard had no material impact on the consolidated annual financial statements of the Company.
Other than the aforementioned guidance, the Company’s management does not believe that any recently issued, but not yet effective, accounting standards, if currently adopted, would have a material effect on the accompanying consolidated financial statements.
Note 3. Agreements and Related Party Transactions
Administration Agreement
The Company has entered into an amended and restated Administration Agreement (the “Administration Agreement”) with the Adviser. Under the terms of the Administration Agreement, the Adviser performs, or oversees the performance of, required administrative services, which include providing office space, equipment and office services, maintaining financial records, preparing reports to shareholders and reports filed with the SEC, and managing the payment of expenses and the performance of administrative and professional services rendered by others. On May 5, 2025, the Board approved the continuation of the Administration Agreement.
The Administration Agreement also provides that the Company reimburses the Adviser for certain organization costs incurred prior to the commencement of the Company’s operations, and for certain offering costs.
The Company reimburses the Adviser for services performed for it pursuant to the terms of the Administration Agreement. In addition, pursuant to the terms of the Administration Agreement, the Adviser may delegate its obligations under the Administration Agreement to an affiliate or to a third party and the Company will reimburse the Adviser for any services performed for it by such affiliate or third party.
Unless earlier terminated as described below, the Administration Agreement will remain in effect for two years from the date it first became effective, and will remain in effect from year to year if approved annually by a majority of the Board or by the holders of a majority of the Company’s outstanding voting securities and, in each case, a majority of the independent directors. The Administration Agreement may be terminated at any time, without the payment of any penalty, on 60 days’ written notice, by the vote of a majority of the outstanding voting securities of the Company (as defined in the 1940 Act), or by the vote of a majority of the Board or by the Adviser.
No person who is an officer, director, or employee of the Adviser or its affiliates and who serves as a director of the Company receives any compensation from the Company for his or her services as a director. However, the Company reimburses the Adviser (or its affiliates) for an allocable portion of the compensation paid by the Adviser or its affiliates to the Company’s officers who provide operational and administrative services, as well as their respective staffs and other professionals who provide services to the Company, who assist with the preparation, coordination and administration of the foregoing or provide other “back office” or “middle office”, financial or operational services to the Company (based on the percentage of time those individuals devote, on an estimated basis, to the business and affairs of the Company). Directors who are not affiliated with the Adviser receive compensation for their services and reimbursement of expenses incurred to attend meetings.
For the years ended December 31, 2025, 2024 and 2023, the Company incurred expenses of approximately $7.7 million, $3.6 million and $3.0 million, respectively, for costs and expenses reimbursable to the Adviser under the terms of the Administration Agreement.
As of December 31, 2025, 2024 and 2023, amounts reimbursable to the Adviser pursuant to the Administration Agreement were $0.1 million, $1.9 million and $1.1 million, respectively.
Investment Advisory Agreement
The Investment Advisory Agreement became effective on May 18, 2021. Under the terms of the Investment Advisory Agreement, the Adviser is responsible for managing the Company’s business and activities, including sourcing investment opportunities, conducting research, performing diligence on potential investments, structuring its investments, and monitoring its portfolio companies on an ongoing basis through a team of investment professionals. On May 5, 2025, the Board approved the continuation of the Investment Advisory Agreement.
The Adviser’s services under the Investment Advisory Agreement are not exclusive, and it is free to furnish similar services to other entities so long as its services to the Company are not impaired.
Unless earlier terminated as described below, the Investment Advisory Agreement will remain in effect for two years from the date it first became effective, and will remain in effect from year-to-year if approved annually by a majority of the Board or by the holders of a majority of our outstanding voting securities and, in each case, by a majority of independent directors.
F-57
Blue Owl Technology Finance Corp.
Notes to Consolidated Financial Statements - Continued
The Investment Advisory Agreement will automatically terminate within the meaning of the 1940 Act and related SEC guidance and interpretations in the event of its assignment. In accordance with the 1940 Act, without payment of any penalty, the Company may terminate the Investment Advisory Agreement with the Adviser upon 60 days’ written notice. The decision to terminate the agreement may be made by a majority of the Board or the shareholders holding a majority of the outstanding shares (as defined in the 1940 Act) of the Company’s common stock. In addition, without payment of any penalty, the Adviser may generally terminate the Investment Advisory Agreement upon 60 days’ written notice.
From time to time, the Adviser may pay amounts owed by the Company to third-party providers of goods or services, including the Board, and the Company will subsequently reimburse the Adviser for such amounts paid on its behalf. Amounts payable to the Adviser are settled in the normal course of business without formal payment terms.
Under the terms of the Investment Advisory Agreement, the Company will pay the Adviser a base management fee and may also pay to it certain incentive fees. The cost of both the management fee and the incentive fee will ultimately be borne by the Company’s shareholders.
The management fee (“Management Fee”) is payable quarterly in arrears. Prior to the Exchange Listing, the Management Fee was payable at an annual rate of 0.90 % of the Company’s (i) average gross assets (excluding cash and cash equivalents but including assets purchased with borrowed amounts) at the end of the two most recently completed calendar quarters; provided, however, that no Management Fee was charged on the value of gross assets (excluding cash and cash-equivalents but including assets purchased with borrowed amounts) that was below an asset coverage ratio of 200 % calculated in accordance with Sections 18 and 61 of the 1940 Act; plus (ii) the average of any remaining unfunded capital commitments at the end of the two most recently completed calendar quarters. Following the Exchange Listing, the Management Fee is payable at an annual rate of (x) 1.50 % of the Company’s average gross assets (excluding cash and cash equivalents but including assets purchased with borrowed amounts) that is above an asset coverage ratio of 200 % calculated in accordance with Sections 18 and 61 of the 1940 Act and (y) 1.00 % of the Company’s average gross assets (excluding cash and cash equivalents but including assets purchased with borrowed amounts) that is below an asset coverage ratio of 200 % calculated in accordance with Sections 18 and 61 of the 1940 Act, in each case, at the end of the two most recently completed calendar quarters payable quarterly in arrears. The Management Fee will be appropriately prorated and adjusted (based on the actual number of days elapsed relative to the total number of days in such calendar quarter) for any share issuances or repurchases during the relevant calendar quarters. The Management Fee for any partial month or quarter, as the case may be, will be appropriately prorated and adjusted (based on the actual number of days elapsed relative to the total number of days in such calendar quarter). For purposes of the Investment Advisory Agreement, gross assets means the Company’s total assets determined on a consolidated basis in accordance with generally accepted accounting principles in the United States, excluding cash and cash equivalents, but including assets purchased with borrowed amounts.
For the years ended December 31, 2025, 2024 and 2023, management fees were $144.9 227.7 thousand in management fee waivers, $56.7 million and $58.4 million, respectively.
Pursuant to the Investment Advisory Agreement, the Adviser is entitled to an incentive fee (“Incentive Fee”), which consists of two components that are independent of each other, with the result that one component may be payable even if the other is not.
The portion of the Incentive Fee based on income is determined and paid quarterly in arrears commencing with the first calendar quarter following the initial closing date, and equals (i) prior to the Exchange Listing, 100 % of the pre-Incentive Fee net investment income in excess of a 1.5 % quarterly “hurdle rate”, until the Adviser has received 10 % of the total pre-Incentive Fee net investment income for that calendar quarter and, for pre-Incentive Fee net investment income in excess of 1.67 % quarterly, 10 % of all remaining pre-Incentive Fee net investment income for that calendar quarter, and (ii) subsequent to the Exchange Listing, 100 % of the pre-Incentive Fee net investment income in excess of a 1.5 % quarterly “hurdle rate,” until the Adviser has received 17.5 % of the total pre-Incentive Fee net investment income for that calendar quarter and, for pre-Incentive Fee net investment income in excess of 1.82 % quarterly, 17.5 % of all remaining pre-Incentive Fee net investment income for that calendar quarter. The 100 % “catch-up” provision for pre-Incentive Fee net investment income in excess of the 1.5 % “hurdle rate” is intended to provide the Adviser with an Incentive Fee of (i) prior to the Exchange Listing, 10 % on all pre- Incentive Fee net investment income when that amount equals 1.67 % in a calendar quarter (6.67 % annualized), and (ii) subsequent to the Exchange Listing, 17.5 % on all pre-Incentive Fee net investment income when that amount equals 1.82 % in a calendar quarter (7.27 % annualized), which, in each case, is the rate at which catch-up is achieved. Once the “hurdle rate” is reached and catch-up is achieved, (i) prior to the Exchange Listing, 10 % of any pre-Incentive Fee net investment income in excess of 1.67 % in any calendar quarter is payable to the Adviser, and (ii) subsequent to the Exchange Listing, 17.5 % of any pre-Incentive Fee net investment income in excess of 1.82 % in any calendar quarter is payable to the Adviser.
The second component of the Incentive Fee, the “Capital Gains Incentive Fee,” payable at the end of each calendar year in arrears, equals, (i) prior to the Exchange Listing, 10 % of cumulative realized capital gains from the initial closing date to the end of each calendar year, less cumulative realized capital losses and unrealized capital depreciation from the initial closing date to the end of each calendar year, and (ii) subsequent to the Exchange Listing, 17.5 % of cumulative realized capital gains from the Listing Date to
F-58
Blue Owl Technology Finance Corp.
Notes to Consolidated Financial Statements - Continued
the end of each calendar year, less cumulative realized capital losses and unrealized capital depreciation from the Listing Date to the end of each calendar year. Each year, the fee paid for the Capital Gains Incentive Fee is net of the aggregate amount of any previously paid Capital Gains Incentive Fee for prior periods. While the Investment Advisory Agreement neither includes nor contemplates the inclusion of unrealized gains in the calculation of the capital gains incentive fee, as required by U.S. GAAP, the Company accrues capital gains incentive fees on unrealized gains. This accrual reflects the incentive fees that would be payable to the Adviser if the Company’s entire investment portfolio was liquidated at its fair value as of the balance sheet date even though the Adviser is not entitled to an incentive fee with respect to unrealized gains unless and until such gains are actually realized. The fees that are payable under the Investment Advisory Agreement for any partial period will be appropriately prorated. In no event will the Capital Gains Fee payable pursuant to the Investment Advisory Agreement be in excess of the amount permitted by the Advisers Act, including Section 205 thereof.
For the year ended December 31, 2025, the Company accrued performance based incentive fees based on capital gains of $37.5 million, of which $37.5 million was related to unrealized gains. For the year ended December 31, 2024, the Company recorded a reversal of previously recorded performance based incentive fees of $5.5 million. For the year ended December 31, 2023 the Company accrued performance based incentive fees based on capital gains of $0.3 million, of which $0.3 million was related to unrealized gains.
Affiliated Transactions
The Company may be prohibited under the 1940 Act from participating in certain transactions with its affiliates without prior approval of the directors who are not interested persons, and in some cases, the prior approval of the SEC. The Company, the Adviser and certain of their affiliates were granted an order for exemptive relief that permitted co-investing with affiliates of the Company subject to various approvals of the Board and other conditions. On May 6, 2025, the Company, the Adviser and certain of their affiliates were granted a new order for exemptive relief that superseded the prior order for exemptive relief (the “Order”) by the SEC for the Company to co-invest with other funds managed by the Adviser or certain affiliates, in a manner consistent with the Company’s investment objective, positions, policies, strategies and restrictions as well as regulatory requirements and other pertinent factors. Pursuant to such Order, the Company generally is permitted to co-invest with certain of its affiliates if such co-investments are done on the same terms and at the same time, as further detailed in the Order. The Order requires that a “required majority” (as defined in Section 57(o) of the 1940 Act) of the Board make certain findings (1) in most instances when the Company co-invests with its affiliates in an issuer where an affiliate of the Company has an existing investment in the issuer, and (2) if the Company disposes of an asset acquired in a transaction under the Order unless the disposition is done on a pro rata basis. Pursuant to the Order, the Board will oversee the Company’s participation in the co-investment program. As required by the Order, the Company has adopted, and the Board has approved, policies and procedures reasonably designed to ensure compliance with the terms of the Order, and the Adviser and the Company’s Chief Compliance Officer will provide reporting to the Board.
The Adviser is affiliated with Blue Owl Credit Advisors LLC (“OCA”), OTCA II, Blue Owl Credit Private Fund Advisors LLC (“OPFA”), and Blue Owl Diversified Credit Advisors LLC (“ODCA” together with OTCA II, OPFA, OCA, and the Adviser, the “Blue Owl Credit Advisers”), which are also investment advisers. The Blue Owl Credit Advisers are indirect affiliates of Blue Owl and comprise part of Blue Owl’s Credit platform, which includes several strategies, including direct lending, alternative credit, investment grade credit, liquid credit and other adjacent investment strategies. The Blue Owl Credit Advisers’ allocation policy seeks to ensure equitable allocation of investment opportunities over time between the Company, and other funds managed by the Adviser or its affiliates. As a result of the Order, there could be significant overlap in the Company’s investment portfolio and the investment portfolio of the business development companies, private funds, interval fund and separately managed accounts managed by the Blue Owl Credit Advisers (collectively, the “Blue Owl Credit Clients”) and/or other funds managed by the Adviser or its affiliates that avail themselves of the Order.
License Agreement
On July 6, 2023, the Company entered into a license agreement (the “License Agreement”) with an affiliate of Blue Owl, pursuant to which the Company was granted a non-exclusive license to use the name “Blue Owl.” Under the License Agreement, the Company has a right to use the Blue Owl name for so long as the Adviser or one of its affiliates remains the Company’s investment adviser. Other than with respect to this limited license, the Company will have no legal right to the “Blue Owl” name or logo.
Controlled, Affiliated/Non-Controlled, Affiliated Portfolio Companies
Under the 1940 Act, the Company is required to separately identify non-controlled investments where it owns 5% or more of a portfolio company’s outstanding voting securities as investments in “affiliated” companies. In addition, under the 1940 Act, the Company is required to separately identify investments where it owns more than 25% of a portfolio company’s outstanding voting securities and/or has the power to exercise control over the management or policies of such portfolio company as investments in “controlled” companies. Under the 1940 Act, “non-affiliated investments” are defined as investments that are neither controlled investments nor affiliated investments. Detailed information with respect to the Company’s non-controlled, non-affiliated; non-controlled, affiliated; and controlled affiliated investments is contained in these consolidated financial statements, including the consolidated schedule of investments.
F-59
Blue Owl Technology Finance Corp.
Notes to Consolidated Financial Statements - Continued
The Company has made investments in controlled, affiliated companies including Blue Owl Credit SLF LLC (“Credit SLF”) and Blue Owl Leasing LLC (“Blue Owl Leasing”). For further descriptions of Credit SLF and Blue Owl Leasing, see “Note 4 — Investments.”
Amergin AssetCo was created to invest in a leasing platform focused on railcar, aviation and other long-lived transportation assets. Amergin acquires existing on-lease portfolios of new and end-of-life railcars and related equipment and selectively purchases off-lease assets and is building a commercial aircraft portfolio through aircraft financing and engine acquisition on a sale and lease back basis. Amergin consists of Amergin AssetCo and Amergin Asset Management LLC, which has entered into a Servicing Agreement with Amergin AssetCo. The Company made an initial equity commitment to Amergin AssetCo on July 1, 2022. As of December 31, 2025, its commitment to Amergin AssetCo is $62.2 million, of which $24.7 million is equity and $37.5 million is debt. The Company’s investment in Amergin is a co-investment made with its affiliates in accordance with the terms of the exemptive relief that the Company received from the SEC. The Company does not consolidate its equity interest in Amergin AssetCo.
BOCSO is a portfolio company formed to hold alternative credit assets, including asset-based finance (“ABF”). ABF is a subsector of private credit focused on generating income from pools of financial, physical or other assets. On September 18, 2025, we made an initial equity contribution to BOCSO. As of December 31, 2025, the Company’s investment at fair value in BOCSO was $57.7 million and the Company’s total commitment was $57.7 million. The Company does not consolidate its equity interest in BOCSO.
Fifth Season is a portfolio company created to invest in life insurance based assets, including secondary and tertiary life settlement and other life insurance exposures using detailed analytics, internal life expectancy review and sophisticated portfolio management techniques. On July 18, 2022, the Company made an initial equity investment in Fifth Season. As of December 31, 2025, its investment in Fifth Season was $184.5 million at fair value. The Company’s investment in Fifth Season is a co-investment with its affiliates in accordance with the terms of the exemptive relief that the Company received from the SEC. The Company does not consolidate its interest in Fifth Season.
LSI Financing DAC is a portfolio company formed to acquire contractual rights to revenue pursuant to earnout agreements generally in the life sciences space. On December 14, 2022, the Company made an initial investment in LSI Financing DAC. As of December 31, 2025, the Company’s investment in LSI Financing DAC was $6.7 million at fair value and its total commitment was $6.7 million. The Company does not consolidate its equity interest in LSI Financing DAC.
LSI Financing LLC is a separately managed portfolio company formed to indirectly own royalty purchase agreements and loans in the life sciences space. An affiliate of the Adviser provides consulting services to a subsidiary of LSI Financing LLC in exchange for a fee. The Adviser has agreed to waive a portion of the management fee payable by the Company pursuant to the Investment Advisory Agreement equal to the pro rata amount of such consulting fee. On November 25, 2024, the Company redeemed a portion of its interest in LSI Financing DAC in exchange for common shares of LSI Financing LLC. As of December 31, 2025, the fair value of the Company’s investment in LSI Financing LLC was $102.2 million and its total commitment was $124.4 million. The Company does not consolidate its equity interest in LSI Financing LLC.
Note 4. Investments
The information in the tables below is presented on an aggregate portfolio basis, without regard to whether they are non-controlled non-affiliated, non-controlled affiliated or controlled affiliated investments.
The table below presents the composition of investments at fair value and amortized cost as of the following periods:
| December 31, 2025 | December 31, 2024 | ||||||||||||||||||||||
| ($ in thousands) | Amortized Cost | Fair Value | Amortized Cost | Fair Value | |||||||||||||||||||
First-lien senior secured debt investments | $ | $ | $ | $ | |||||||||||||||||||
| Second-lien senior secured debt investments | |||||||||||||||||||||||
| Unsecured debt investments | |||||||||||||||||||||||
| Specialty finance debt investments | |||||||||||||||||||||||
Preferred equity investments | |||||||||||||||||||||||
Common equity investments | |||||||||||||||||||||||
| Specialty finance equity investments | |||||||||||||||||||||||
Joint ventures | |||||||||||||||||||||||
| Total Investments | $ | $ | $ | $ | |||||||||||||||||||
F-60
Blue Owl Technology Finance Corp.
Notes to Consolidated Financial Statements - Continued
The Company uses the Global Industry Classification Standard (“GICS”) for classifying the industry groupings of its portfolio companies. The table below presents the industry composition of investments based on fair value as of the following periods:
| December 31, 2025 | December 31, 2024 | ||||||||||
| Aerospace & Defense | % | % | |||||||||
| Airlines | |||||||||||
| Application Software | |||||||||||
Asset based lending and fund finance(6) | |||||||||||
| Banks | |||||||||||
Beverages(1) | |||||||||||
| Building Products | |||||||||||
| Buildings & Real Estate | |||||||||||
| Capital Markets | |||||||||||
| Commercial Services & Supplies | |||||||||||
Construction & Engineering(1) | |||||||||||
| Consumer Finance | |||||||||||
| Diversified Consumer Services | |||||||||||
Diversified Financial Services(2) | |||||||||||
| Diversified Support Services | |||||||||||
| Entertainment | |||||||||||
| Equity Real Estate Investment Trusts (REITs) | |||||||||||
| Food & Staples Retailing | |||||||||||
| Health Care Equipment & Supplies | |||||||||||
| Health Care Providers & Services | |||||||||||
| Health Care Technology | |||||||||||
| Hotels, Restaurants & Leisure | |||||||||||
| Household Durables | |||||||||||
| Industrial Conglomerates | |||||||||||
Insurance(3) | |||||||||||
| Internet & Direct Marketing Retail | |||||||||||
| IT Services | |||||||||||
Joint Ventures(1)(4) | |||||||||||
| Life Sciences Tools & Services | |||||||||||
| Media | |||||||||||
| Multiline Retail | |||||||||||
Pharmaceuticals(5) | |||||||||||
| Professional Services | |||||||||||
| Real Estate Management & Development | |||||||||||
| Road & Rail | |||||||||||
| Specialty Retail | |||||||||||
| Systems Software | |||||||||||
Thrifts & Mortgage Finance(1) | |||||||||||
| Wireless Telecommunication Services | |||||||||||
| Total | % | % | |||||||||
(1)As of December 31, 2025 or December 31, 2024 the Company’s investment rounds to less than 0.1
(2)Includes debt and equity investment in Amergin AssetCo.
(3)Includes equity investment in Fifth Season.
(4)Includes equity investment in Credit SLF, Blue Owl Leasing and Stripe Blue Owl. See below, within Note 4, for more information.
(5)Includes equity investment in LSI Financing DAC and LSI Financing LLC.
(6)Includes equity investment in BOCSO.
F-61
Blue Owl Technology Finance Corp.
Notes to Consolidated Financial Statements - Continued
The table below presents the geographic composition of investments based on fair value as of the following periods:
| December 31, 2025 | December 31, 2024 | ||||||||||
| United States: | |||||||||||
| Midwest | % | % | |||||||||
| Northeast | |||||||||||
| South | |||||||||||
| West | |||||||||||
| Australia | |||||||||||
| Brazil | |||||||||||
| Canada | |||||||||||
| Estonia | |||||||||||
| Guernsey | |||||||||||
Ireland(1) | |||||||||||
| Israel | |||||||||||
Netherlands(1) | |||||||||||
| Norway | |||||||||||
| Spain | |||||||||||
| Sweden | |||||||||||
| Switzerland | |||||||||||
| United Kingdom | |||||||||||
| Total | % | % | |||||||||
(1)As of December 31, 2025 or December 31, 2024, the Company’s investment rounds to less than 0.1
Blue Owl Credit SLF LLC
Credit SLF, a Delaware limited liability company, is a joint venture among the Credit SLF Members. Credit SLF’s principal purpose is to make investments primarily in senior secured loans to middle market companies, broadly syndicated loans and in senior and subordinated notes issued by collateralized loan obligations. Credit SLF is managed by a board of directors comprised of an equal number of directors appointed by each Credit Member and which acts unanimously. Investment decisions must be approved by Credit SLF’s board. The Credit SLF Members coinvest through Credit SLF, or its wholly owned subsidiaries. Credit SLF’s date of inception was May 6, 2024 and Credit SLF made its first portfolio company investment on July 23, 2024.
Credit SLF’s investments at fair value are determined in accordance with FASB ASC 820, as amended; however, such fair value is not included in the Company’s valuation process.
Other than for purposes of the 1940 Act, the Company does not believe it has control over this portfolio company. Accordingly, the Company does not consolidate its non-controlling interest in Credit SLF.
The Company’s initial capital commitment to and economic ownership in Credit SLF was $2.5 million and 4.4 %, respectively. On November 1, 2024 the Company's capital commitment in Credit SLF capital remained at $2.5 million and economic ownership decreased to 0.3 %. On March 24, 2025, in connection with the Mergers, the Company assumed OTF II’s capital commitment to and economic ownership in Credit SLF of approximately $2.5 million and 0.3 % respectively. On May 15, 2025, the Credit SLF Members modified their capital commitments to Credit SLF and the Company’s capital commitment was increased to $18.7 million of which $16.2 million was unfunded and which since then has been funded. On September 4, 2025, certain Credit SLF Members increased their capital commitments to Credit SLF and the Company’s capital commitment was increased to $34.9 million of which $16.2 million was unfunded.
F-62
Blue Owl Technology Finance Corp.
Notes to Consolidated Financial Statements - Continued
As of December 31, 2025, the capital commitment and economic ownership of each Credit SLF Member is as follows:
| Members | Capital Commitment | Net Contributed Capital | Economic Ownership Interest(1) | |||||||||||||||||
| ($ in thousands) | ||||||||||||||||||||
| Blue Owl Capital Corporation | $ | $ | % | |||||||||||||||||
| Blue Owl Capital Corporation II | % | |||||||||||||||||||
| Blue Owl Credit Income Corp. | % | |||||||||||||||||||
| Blue Owl Technology Finance Corp. | % | |||||||||||||||||||
| Blue Owl Technology Income Corp. | % | |||||||||||||||||||
| State Teachers Retirement System of Ohio | % | |||||||||||||||||||
| Total | $ | $ | % | |||||||||||||||||
(1) This represents each equity holder’s ownership percentage at December 31, 2025 based on net contributed capital.
The table below sets forth Credit SLF’s consolidated financial data as of and for the following periods:
| As of | ||||||||||||||
| ($ in thousands) | December 31, 2025 | December 31, 2024 | ||||||||||||
| Consolidated Balance Sheet Data | ||||||||||||||
| Cash | $ | $ | ||||||||||||
| Investments at fair value | $ | $ | ||||||||||||
| Total Assets | $ | $ | ||||||||||||
| Total Debt (net of unamortized debt issuance costs) | $ | $ | ||||||||||||
| Total Liabilities | $ | $ | ||||||||||||
| Total Credit SLF Members’ Equity | $ | $ | ||||||||||||
| For the Year Ended December 31, | For the Period Ended December 31, | |||||||||||||
| ($ in thousands) | 2025 | 2024(1) | ||||||||||||
| Consolidated Statement of Operations Data | ||||||||||||||
| Income | ||||||||||||||
| Investment income | $ | $ | ||||||||||||
| Expenses | ||||||||||||||
| Net operating expenses | ||||||||||||||
| Net investment income (loss) | $ | $ | ||||||||||||
| Total net realized and unrealized gain (loss) | ( | |||||||||||||
| Net increase (decrease) in Credit SLF Members’ Equity resulting from operations | $ | $ | ||||||||||||
(1) Credit SLF’s date of inception was May 6, 2024.
The Company’s proportional share of Credit SLF’s net income generated distributions for the following periods:
| For the Year Ended December 31, | For the Period Ended December 31, | |||||||||||||
| ($ in thousands) | 2025 | 2024 | ||||||||||||
Dividend Income | $ | $ | ||||||||||||
Blue Owl Leasing LLC
Blue Owl Leasing, a Delaware limited liability company, is a joint venture among the Company, Blue Owl Capital Corporation, Blue Owl Capital Corporation II, Blue Owl Credit Income Corp., Blue Owl Technology Income Corp., Alternative Credit Fund and California State Teachers Retirement System (each, a “Blue Owl Leasing Member” and collectively, the “Blue Owl Leasing Members”). Blue Owl Leasing’s principal purpose is to make investments, either directly or indirectly through financing subsidiaries or other persons, primarily in leases and loans. Investment decisions must be approved by Blue Owl Leasing. The Blue Owl Leasing
F-63
Blue Owl Technology Finance Corp.
Notes to Consolidated Financial Statements - Continued
Members coinvest through Blue Owl Leasing, or its wholly owned subsidiaries. Blue Owl Leasing’s date of inception was June 30, 2025 and Blue Owl Leasing made its first portfolio company investment on October 23, 2025.
Blue Owl Leasing’s investments at fair value are determined in accordance with FASB ASC 820, as amended; however, such fair value is not included in the Company’s valuation process.
Other than for purposes of the 1940 Act, the Company does not believe it has control over this portfolio company. Accordingly, the Company does not consolidate its non-controlling interest in Blue Owl Leasing.
As of December 31, 2025, the capital commitment, called capital and economic ownership of each Blue Owl Leasing Member is as follows:
| Members | Capital Commitment | Net Contributed Capital | Economic Ownership Interest(1) | |||||||||||||||||
| ($ in thousands) | ||||||||||||||||||||
| Blue Owl Capital Corporation | $ | $ | % | |||||||||||||||||
| Blue Owl Capital Corporation II | % | |||||||||||||||||||
| Blue Owl Credit Income Corp. | % | |||||||||||||||||||
| Blue Owl Technology Finance Corp. | % | |||||||||||||||||||
| Blue Owl Technology Income Corp. | % | |||||||||||||||||||
| Blue Owl Alternative Credit Fund | % | |||||||||||||||||||
| California State Teachers Retirement System | % | |||||||||||||||||||
| Total | $ | $ | % | |||||||||||||||||
(1) This represents each equity holder’s ownership percentage at December 31, 2025, based on net contributed capital.
The table below sets forth Blue Owl Leasing’s consolidated financial data as of and for the following period:
| As of | ||||||||
| ($ in thousands) | December 31, 2025(1) | |||||||
| Consolidated Balance Sheet Data | ||||||||
| Cash | $ | |||||||
| Investments at fair value | $ | |||||||
| Total Assets | $ | |||||||
| Total Debt (net of unamortized debt issuance costs) | $ | |||||||
| Total Liabilities | $ | |||||||
| Total Blue Owl Leasing Members’ Equity | $ | |||||||
1) The Company’s date of inception was June 30, 2025.
For the Period Ended December 31, | ||||||||
| ($ in thousands) | 2025(1) | |||||||
| Consolidated Statement of Operations Data | ||||||||
| Income | ||||||||
| Investment income | $ | |||||||
| Expenses | ||||||||
| Net operating expenses | ||||||||
| Net investment income (loss) | $ | ( | ||||||
| Total net realized and unrealized gain (loss) | $ | |||||||
| Net Increase (Decrease) in Blue Owl Leasing Members’ Equity Resulting From Operations | $ | ( | ||||||
(1) The Company’s date of inception was June 30, 2025
Blue Owl Leasing did not distribute any dividends to the Company for the period ended December 31, 2025.
F-64
Blue Owl Technology Finance Corp.
Notes to Consolidated Financial Statements - Continued
Note 5. Debt
In accordance with the 1940 Act, with certain limitations, the Company is allowed to borrow amounts such that its asset coverage, as defined in the 1940 Act, is at least 150% after such borrowing. As of December 31, 2025 and December 31, 2024, the Company’s asset coverage was 226 % and 220 %, respectively.
The tables below present debt obligations as of the following periods:
| December 31, 2025 | |||||||||||||||||||||||||||||
| ($ in thousands) | Aggregate Principal Committed | Outstanding Principal | Amount Available(1) | Unamortized Debt Issuance Costs (Premium) | Net Carrying Value | ||||||||||||||||||||||||
Revolving Credit Facility(2) | $ | $ | $ | $ | $ | ||||||||||||||||||||||||
| SPV Asset Facility I | |||||||||||||||||||||||||||||
| SPV Asset Facility II | |||||||||||||||||||||||||||||
| SPV Asset Facility III | |||||||||||||||||||||||||||||
| SPV Asset Facility IV | |||||||||||||||||||||||||||||
| Athena CLO II | — | ||||||||||||||||||||||||||||
| Athena CLO IV | — | ||||||||||||||||||||||||||||
| Athena CLO V | — | ||||||||||||||||||||||||||||
| June 2026 Notes | — | ||||||||||||||||||||||||||||
| January 2027 Notes | — | ||||||||||||||||||||||||||||
March 2028 Notes(3) | — | ||||||||||||||||||||||||||||
| September 2028 Notes | — | ||||||||||||||||||||||||||||
April 2029 Notes(3) | — | ||||||||||||||||||||||||||||
| Total Debt | $ | $ | $ | $ | $ | ||||||||||||||||||||||||
(1)The amount available reflects any limitations related to each credit facility’s borrowing base.
(2)The amount available is reduced by $3.0 million of outstanding letters of credit.
(3)Net carrying value is inclusive of change in fair market value of effective hedge.
| December 31, 2024 | |||||||||||||||||||||||||||||
| ($ in thousands) | Aggregate Principal Committed | Outstanding Principal | Amount Available(1) | Unamortized Debt Issuance Costs (Premium) | Net Carrying Value | ||||||||||||||||||||||||
Revolving Credit Facility(2) | $ | $ | $ | $ | $ | ||||||||||||||||||||||||
| SPV Asset Facility I | |||||||||||||||||||||||||||||
| SPV Asset Facility II | |||||||||||||||||||||||||||||
| June 2025 Notes | — | ||||||||||||||||||||||||||||
| December 2025 Notes | — | ( | |||||||||||||||||||||||||||
| June 2026 Notes | — | ||||||||||||||||||||||||||||
| January 2027 Notes | — | ||||||||||||||||||||||||||||
| CLO 2020-1 | — | ||||||||||||||||||||||||||||
| Total Debt | $ | $ | $ | $ | $ | ||||||||||||||||||||||||
(1)The amount available reflects any limitations related to each credit facility’s borrowing base.
(2)Includes the unrealized translation gain (loss) on borrowings denominated in foreign currencies.
F-65
Blue Owl Technology Finance Corp.
Notes to Consolidated Financial Statements - Continued
The table below presents the components of interest expense for the following periods:
| For the Year Ended December 31, | |||||||||||||||||
| ($ in thousands) | 2025 | 2024 | 2023 | ||||||||||||||
| Interest expense | $ | $ | $ | ||||||||||||||
| Amortization of debt issuance costs, net | |||||||||||||||||
Net change in unrealized (gain) loss on effective interest rate swaps and hedged items(1) | |||||||||||||||||
| Total Interest Expense | $ | $ | $ | ||||||||||||||
| Average interest rate | % | % | % | ||||||||||||||
| Average daily borrowings | $ | $ | $ | ||||||||||||||
(1)Refer to the March 2028 Notes and April 2029 Notes for details on the facilities’ interest rate swaps.
Credit Facilities
Revolving Credit Facility
On November 15, 2022, the Company entered into an Amended and Restated Senior Secured Revolving Credit Agreement (as amended from time to time, the “Revolving Credit Facility”), which amended and restated in its entirety that certain Senior Secured Revolving Credit Agreement, dated as of March 15, 2019 (as amended, restated, supplemented or otherwise modified prior to November 15, 2022). The parties to the Revolving Credit Facility include the Company, as Borrower, the lenders from time to time parties thereto (each a “Lender” and collectively, the “Lenders”), Truist Bank as Administrative Agent, Truist Securities, Inc., ING Capital LLC, MUFG Bank, Ltd., Sumitomo Mitsui Banking Corporation and JPMorgan Chase Bank, N.A., as Joint Lead Arrangers and Truist Securities, Inc. and ING Capital LLC, as Joint Bookrunners. On December 20, 2024 (the "Revolving Credit Facility Third Amendment Date), the parties to the Revolving Credit Facility entered into an amendment to, among other things, extend the availability period and maturity date and make various other changes. The following describes the terms of the Revolving Credit Facility as modified through August 29, 2025.
The Revolving Credit Facility is guaranteed by certain of the Company's subsidiaries in existence on the Revolving Credit Facility Third Amendment Date, and will be guaranteed by certain subsidiaries of the Company that are formed or acquired by the Company in the future (each a “Guarantor” and collectively, the “Guarantors”). Proceeds of the Revolving Credit Facility may be used for general corporate purposes, including the funding of portfolio investments.
The Revolving Credit Facility provides for, on an aggregated basis, a total of outstanding term loans and revolving credit facility commitments in the principal amount of $2.68 billion, which is comprised of (a) a term loan in a principal amount of $100.0 million and (b) subject to availability under the borrowing base, which is based on the Company’s portfolio investments and other outstanding indebtedness, a revolving credit facility in a principal amount of up to $2.58 billion (increased from $2.48 billion to $2.58 billion on August 29, 2025). The amount available for borrowing under the revolving credit facility commitments of the Revolving Credit Facility is reduced by any standby letters of credit issued through the Revolving Credit Facility. Maximum capacity under the Revolving Credit Facility may be increased to $3.83 billion through the Company's exercise of an uncommitted accordion feature through which existing and new lenders may, at their option, agree to provide additional financing. The Revolving Credit Facility includes a swingline loan limit of $400.0 million, and is secured by a perfected first-priority interest in substantially all of the portfolio investments held by the Company and each Guarantor, subject to certain exceptions.
The availability period under the Revolving Credit Facility will terminate on December 20, 2028 (the “Revolving Credit Facility Commitment Termination Date”) and the Revolving Credit Facility will mature on December 20, 2029 (the “Revolving Credit Facility Maturity Date”). During the period from the Revolving Credit Facility Commitment Termination Date to the Revolving Credit Facility Maturity Date, the Company will be obligated to make mandatory prepayments under the Revolving Credit Facility out of the proceeds of certain asset sales and other recovery events and equity and debt issuances.
The Company may borrow amounts in U.S. dollars or certain other permitted currencies. Amounts drawn under the Revolving Credit Facility with respect to the commitments in U.S. dollars bear interest at either (i) term SOFR plus any applicable credit adjustment spread plus margin of either 1.875 % per annum or, if the gross borrowing base is greater than or equal to the product of 1.60 and the combined debt amount, 1.75 % per annum, or (ii) the alternative base rate plus a margin of either 0.875 % per annum or, if the gross borrowing base is greater than or equal to the product of 1.60 and the combined debt amount, 0.75 % per annum. With respect to loans denominated in U.S. dollars, the Company may elect either term SOFR or the alternative base rate at the time of drawdown, and such loans may be converted from one rate to another at any time at the Company’s option, subject to certain conditions. Amounts drawn under the Revolving Credit Facility with respect to the commitments in other permitted currencies will bear interest at the relevant rate specified therein (including any applicable credit adjustment spread plus margin of either 1.875 % per annum or, if the gross borrowing base is greater than or equal to the product of 1.60 and the combined debt amount, 1.75 % per annum.
F-66
Blue Owl Technology Finance Corp.
Notes to Consolidated Financial Statements - Continued
Beginning on and after the Revolving Credit Facility Third Amendment Date, the Company also pays a fee of 0.350 % on daily undrawn amounts under the Revolving Credit Facility.
The Revolving Credit Facility includes customary covenants, including certain limitations on the incurrence by the Company of additional indebtedness and on the Company’s ability to make distributions to its shareholders, or redeem, repurchase or retire shares of stock, upon the occurrence of certain events and certain financial covenants related to asset coverage and liquidity and other maintenance covenants, as well as customary events of default. The Revolving Credit Facility requires a minimum asset coverage ratio with respect to the consolidated assets of the Company and its subsidiaries to senior securities that constitute indebtedness of no less than 1.50 to 1.00 at any time.
SPV Asset Facilities
Certain of the Company's wholly owned subsidiaries are parties to credit facilities (the “SPV Asset Facilities”). Pursuant to the SPV Asset Facilities, the Company sells and contributes certain investments to these wholly owned subsidiaries pursuant to sale and contribution agreements by and between the Company and the wholly owned subsidiaries. No gain or loss is recognized as a result of these contributions. Proceeds from the SPV Asset Facilities are used to finance the origination and acquisition of eligible assets by the wholly owned subsidiary, including the purchase of such assets from the Company. The Company retains a residual interest in assets contributed to or acquired to the wholly owned subsidiary through the Company’s ownership of the wholly owned subsidiary. The SPV Asset Facilities are secured by a perfected first priority security interest in the assets of these wholly owned subsidiaries and on any payments received by such wholly owned subsidiaries in respect of those assets. Assets pledged to lenders under the SPV Asset Facilities will not be available to pay the Company's debts. The SPV Asset Facilities contain customary covenants, including certain limitations on the incurrence by the Company of additional indebtedness and on the Company’s ability to make distributions to their shareholders, or redeem, repurchase or retire shares of stock, upon the occurrence of certain events, and customary events of default (with customary cure and notice provisions). Borrowings of the wholly owned subsidiaries under the SPV Asset Facilities are considered the Company’s borrowings for purposes of complying with the asset coverage requirements under the 1940 Act.
SPV Asset Facility I
On December 22, 2022 (the “SPV Asset Facility I Closing Date”), OR Tech Financing I LLC (“OR Tech Financing I”), a Delaware limited liability company and wholly-owned subsidiary of the Company entered into an Amended and Restated Credit Agreement (the “SPV Asset Facility I”), which amended and restated in its entirety that certain Credit Agreement, dated as of August 11, 2020, by and among OR Tech Financing I, as Borrower, Alter Domus (US) LLC, as Administrative Agent and Document Custodian, State Street Bank and Trust Company, as Collateral Agent, Collateral Administrator and Custodian and the lenders from time to time party thereto (the “SPV Asset Facility I Lenders”). On October 30, 2024, the parties to the SPV Asset Facility I entered into the Second Amendment to Amended and Restated Credit Agreement, in order to, among other changes, replace Alter Domus (US) LLC as document custodian with State Street Bank and Trust Company. The following describes the terms of SPV Asset Facility I as amended through October 30, 2024 (the “SPV Asset Facility I Second Amendment Date”).
The total term loan commitment of the SPV Asset Facility I is $700.0 million (increased from $600.0 million on the SPV Asset Facility I Second Amendment Date). The availability of the commitments are subject to a ramp up period and subject to an overcollateralization ratio test, which is based on the value of OR Tech Financing I assets from time to time, and satisfaction of certain other tests and conditions, including an advance rate test, interest coverage ratio test, certain concentration limits and collateral quality tests.
The SPV Asset Facility I provides for the ability to draw term loans for a period of up to three years after the SPV Asset Facility I Second Amendment Date unless the commitments are terminated as provided in the SPV Asset Facility I. Unless otherwise terminated, the SPV Asset Facility I will mature on October 30, 2035 (the “SPV Asset Facility I Stated Maturity”). Prior to the SPV Asset Facility I Stated Maturity, proceeds received by OR Tech Financing I from principal and interest, dividends, or fees on assets must be used to pay fees, expenses and interest on outstanding borrowings, and the excess may be returned to the Company, subject to certain conditions. On the SPV Asset Facility I Stated Maturity, OR Tech Financing I must pay in full all outstanding fees and expenses and all principal and interest on outstanding borrowings, and the excess may be returned to the Company.
Amounts drawn bear interest at term SOFR plus a spread of 2.25 %.
SPV Asset Facility II
On November 16, 2021 (the “SPV Asset Facility II Closing Date”), ORTF Funding I LLC (“ORTF Funding I”), a Delaware limited liability company and the Company’s wholly-owned subsidiary entered into a Credit Agreement (the “SPV Asset Facility II”), with ORTF Funding I LLC, as Borrower, the lenders from time to time parties thereto, Goldman Sachs Bank USA as Sole Lead Arranger, Syndication Agent and Administrative Agent, State Street Bank and Trust company as Collateral Administrator and Collateral Agent and Alter Domus (US) LLC as Collateral Custodian. On the SPV Asset Facility II Closing Date, ORTF Funding I and Goldman Sachs Bank USA, as Administrative Agent, also entered into a Margining Agreement relating to the Secured Credit Facility (the “Margining Agreement”). On October 30, 2024, the parties to the SPV Asset Facility II entered into Amendment No. 2 to
F-67
Blue Owl Technology Finance Corp.
Notes to Consolidated Financial Statements - Continued
Credit Agreement, in order to, among other changes, replace Alter Domus (US) LLC as collateral custodian with State Street Bank and Trust Company. The following describes the terms of the SPV Asset Facility II as amended on December 17, 2025.
The maximum principal amount which may be borrowed under the SPV Asset Facility II is $400 million (increased from $300.0 million on October 30, 2024); the availability of this amount is subject to a borrowing base test, which is based on the value of ORTF Funding I’s assets from time to time, and satisfaction of certain conditions, including certain concentration limits.
The SPV Asset Facility II provides for the ability to draw and redraw revolving loans for a period after the SPV Asset Facility II Closing Date until November 16, 2028. Unless otherwise terminated, the SPV Asset Facility II will mature on November 16, 2030 (the “SPV Asset Facility II Stated Maturity”). Prior to the SPV Asset Facility II Stated Maturity, proceeds received by ORTF Funding I from principal and interest, dividends, or fees on assets must be used to pay fees, expenses and interest on outstanding borrowings, and the excess may be returned to the Company, subject to certain conditions. On the SPV Asset Facility II Stated Maturity, ORTF Funding I must pay in full all outstanding fees and expenses and all principal and interest on outstanding borrowings, and the excess may be returned to the Company. The SPV Asset Facility II may be permanently reduced, in whole or in part, at the option of ORTF Funding I subject to payment of a premium for a period of time.
Amounts drawn bear interest at Term SOFR plus a spread of 2.00 % and the spread is payable on the amount by which the undrawn amount exceeds a minimum threshold, with such threshold being a range of 65 % to 75 % of the commitment amount. The undrawn amount of the commitment not subject to such spread payment is subject to an undrawn fee of 0.50 % per annum. Certain additional fees are payable on each payment date to Goldman Sachs Bank USA as Administrative Agent. In addition, under the Margining Agreement and Credit Agreement, ORTF Funding I is required to post cash margin (or in certain cases, additional eligible assets) to the Administrative Agent if a borrowing base deficiency occurs or if the weighted average price gap (as defined in the Margining Agreement), which is a measure of the excess of the aggregate value assigned to ORTF Funding I’s assets for purposes of the borrowing base test over the total amount drawn under the SPV Asset Facility II, falls below 20 %.
SPV Asset Facilities Assumed in the Mergers
On March 24, 2025, the Company became party to and assumed all of OTF II’s obligations under OTF II’s SPV asset facilities (the “OTF II SPV Asset Facility Assumption Date”).
SPV Asset Facility III
On July 15, 2022 (the “SPV Asset Facility III Closing Date”), Athena Funding I LLC (“Athena Funding I”), a Delaware limited liability company and a wholly-owned subsidiary of the Company entered into a Credit Agreement (the “SPV Asset Facility III”), with Athena Funding I, as borrower, Société Générale, as administrative agent, State Street Bank and Trust Company, as collateral agent, collateral administrator and custodian, Alter Domus (US) LLC, as document custodian, and the lenders party thereto (the “SPV Asset Facility III Lenders”). The parties to the SPV Asset Facility III have entered into various amendments, including those relating to the calculation of principal collateralization amounts and to permit a conversion of a revolving loan into a term loan. The following describes the terms of SPV Asset Facility III as amended through December 11, 2025.
The maximum principal amount which may be borrowed under the SPV Asset Facility III is $1.10 billion (increased from $925.0 million to $1.10 billion on December 11, 2025) which, subject to the satisfaction of certain conditions, may be increased to up to $1.50 billion. The availability of this amount is subject to a borrowing base test, which is based on the value of Athena Funding I’s assets from time to time, and satisfaction of certain conditions, including coverage tests, collateral quality tests, a lender advance rate test and certain concentration limits.
The SPV Asset Facility III provides for the ability to draw term loans and to draw and redraw revolving loans under the SPV Asset Facility III until December 10, 2027. Unless otherwise terminated, the SPV Asset Facility III will mature on December 11, 2035 (the “SPV Asset Facility III Stated Maturity”). Prior to the SPV Asset Facility III Stated Maturity, proceeds received by Athena Funding I from principal and interest, dividends, or fees on assets must be used to pay fees, expenses and interest on outstanding borrowings, and the excess may be returned to the Company, subject to certain conditions. On the SPV Asset Facility III Stated Maturity, Athena Funding I must pay in full all outstanding fees and expenses and all principal and interest on outstanding borrowings, and the excess may be returned to the Company. The credit facility may be permanently reduced, in whole or in part, at the option of Athena Funding I subject to payment of a premium for a period of time.
Amounts drawn bear interest at a reference rate (initially SOFR) plus a spread of 2.05 %, and term loans and revolving loans are subject to a minimum utilization amount, after one year, subject to certain terms and conditions. The undrawn amount of the commitment not subject to such spread payment is subject to an undrawn fee of 0.25 % to 1.00 % per annum on the undrawn amount, if any, of the commitments. Certain additional fees are payable to Société Générale as administrative agent.
SPV Asset Facility IV
On November 8, 2022 (the “SPV Asset Facility IV Closing Date”), Athena Funding II LLC (“Athena Funding II”), a Delaware limited liability company entered into a Loan and Management Agreement (the “SPV Asset Facility IV”), with Athena Funding II LLC, as borrower, the Company, as collateral manager and transferor, MUFG Bank, Ltd. (“MUFG”), as administrative agent, State
F-68
Blue Owl Technology Finance Corp.
Notes to Consolidated Financial Statements - Continued
Street Bank and Trust Company, as collateral agent collateral administrator and as custodian, the lenders from time to time parties thereto (the “SPV Asset Facility IV Lender”) and the group agents from time to time parties thereto. The parties to the SPV Asset Facility IV have entered into various amendments, including to replace the Loan and Management Agreement with an Amended and Restated Credit Agreement, extend the availability period and maturity date, increase the maximum commitment, change the interest rate, and make various other changes. The following describes the terms of SPV Asset Facility IV as amended through October 30, 2025.
The maximum principal amount of the SPV Asset Facility IV is $500.0 million (increased from $300.0 million to $500.0 million on October 30, 2025); the availability of this amount is subject to a borrowing base test, which is based on the value of Athena Funding II’s assets from time to time, an advance rate and concentration limitations, and satisfaction of certain conditions, including collateral quality tests.
The SPV Asset Facility IV provides for the ability to draw and redraw revolving loans under the SPV Asset Facility IV until October 30, 2028 (the “SPV Asset Facility IV Reinvestment Period”) unless the SPV Asset Facility IV Reinvestment Period is terminated sooner as provided in the SPV Asset Facility IV. Unless otherwise terminated, the SPV Asset Facility IV will mature three years after the last day of the SPV Asset Facility IV Reinvestment Period, on October 30, 2030 (the “SPV Asset Facility IV Stated Maturity”). Prior to the SPV Asset Facility IV Stated Maturity, proceeds received by Athena Funding II from principal and interest, dividends, or fees on assets must be used to pay fees, expenses and interest on outstanding borrowings, and the excess may be returned to the Company, subject to certain conditions. On the SPV Asset Facility IV Stated Maturity, Athena Funding II must pay in full all outstanding fees and expenses and all principal and interest on outstanding borrowings, and the excess may be returned to the Company. The credit facility may be permanently reduced, in whole or in part, at the option of Athena Funding II.
Amounts drawn bear interest at a rate based on Term SOFR plus an applicable margin of 2.00 % during the SPV Asset Facility IV Reinvestment Period and 2.35 % after the end of the SPV Asset Facility IV Reinvestment Period. During the SPV Asset Facility IV Reinvestment Period, there is an unused fee in a range of 0.25 % to 0.50 % on the undrawn amount, if any, of the revolving commitments in the SPV Asset Facility IV.
Debt Securitization Transactions
The Company incurs secured financing through debt securitization transactions which are also known as collateralized loan obligation transactions (the “CLO Transactions”) issued by the Company’s consolidated subsidiaries (the “CLO Issuers”), which are backed by a portfolio of collateral obligations consisting of middle-market loans and participation interests in middle-market loans as well as by other assets of the CLO Issuers. The CLO Issuers issue preferred shares which are not secured by the collateral securing the CLO Transactions which the Company purchases. The Company acts as retention holder in connection with the CLO Transactions for the purposes of satisfying certain U.S. and European Union regulations requiring sponsors of securitization transactions to retain exposure to the performance of the securitized assets and as such is required to retain a portion of a CLO Issuer’s preferred shares. Notes issued by CLO Issuers have not been registered under the Securities Act of 1933, as amended (the “Securities Act”), or any state securities (e.g., “blue sky”) laws, and may not be offered or sold in the United States absent registration with the Securities and Exchange Commission or pursuant to an applicable exemption from such registration. The Adviser serves as collateral manager for the CLO Issuers under a collateral management agreement. The Adviser is entitled to receive fees for providing these services. The Adviser routinely waives its right to receive such fees but may rescind such waiver at any time; provided, however, that if the Adviser rescinds such waiver, the management fee payable to Adviser pursuant to the Investment Advisory Agreement will be offset by the amount of the collateral management fee attributable to a CLO Issuer’s equity or notes owned by the Company. Assets pledged to debt holders of the CLO Transactions and the other secured parties under each CLO Transaction’s documentation will not be available to pay the debts of the Company. The Company consolidates the financial statements of the CLO Issuers in its consolidated financial statements.
CLO 2020-1
On December 16, 2020 (the “CLO 2020-1 Closing Date”), the Company completed a $333.5 million term debt securitization transaction (the “CLO 2020-1 Transaction”). The secured notes and preferred shares issued in the CLO 2020-1 Transaction were issued by the Company’s consolidated subsidiaries Owl Rock Technology Financing 2020-1, an exempted company incorporated in the Cayman Islands with limited liability (the “CLO 2020-1 Issuer”), and Owl Rock Technology Financing 2020-1 LLC, a Delaware limited liability company (the “CLO 2020-1 Co-Issuer” and together with the CLO 2020-1 Issuer, the “CLO 2020-1 Issuers”).
The CLO 2020-1 Transaction was executed by the issuance of the following classes of notes and preferred shares pursuant to an indenture and security agreement dated as of the Closing Date (the “CLO 2020-1 Indenture”), by and among the CLO 2020-1 Issuers and State Street Bank and Trust Company: $200 million of A (sf) Class A Notes, which bore interest at term SOFR (plus a spread adjustment) plus 2.95 % (the “CLO 2020-1 Secured Notes”). The CLO 2020-1 Secured Notes are secured by the middle-market loans, recurring revenue loans, participation interests in middle-market loans and recurring revenue loans and other assets of the Issuer. The CLO 2020-1 Secured Notes are scheduled to mature on the Payment Date (as defined in the CLO 2020-1 Indenture) in January 2031. The CLO 2020-1 Secured Notes were offered by MUFG Securities Americas Inc., as initial purchaser, from time to time in individually negotiated transactions.
F-69
Blue Owl Technology Finance Corp.
Notes to Consolidated Financial Statements - Continued
The CLO 2020-1 Secured Notes were redeemed in the CLO 2020-1 Refinancing, described below.
Concurrently with the issuance of the CLO 2020-1 Secured Notes, the CLO 2020-1 Issuer issued approximately $133.5 million of subordinated securities in the form of 133,500 preferred shares at an issue price of $1,000 per share (the “CLO 2020-1 Preferred Shares”).
As part of the CLO 2020-1 Transaction, the Company entered into a loan sale agreement with the CLO 2020-1 Issuer dated as of the Closing Date, which provided for the sale and contribution of approximately $243.4 million par amount of middle-market loans and recurring revenue loans from the Company to the CLO 2020-1 Issuer on the Closing Date and for future sales from the Company to the CLO 2020-1 Issuer on an ongoing basis. No gain or loss was recognized as a result of these sales and contributions. Such loans constituted part of the initial portfolio of assets securing the CLO 2020-1 Secured Notes. The Company made customary representations, warranties, and covenants to the CLO 2020-1 Issuer under the loan sale agreement.
Through January 15, 2022, the net proceeds of the issuing of the CLO 2020-1 Secured Notes not used to purchase the initial portfolio of loans securing the CLO 2020-1 Secured Notes and a portion of the proceeds received by the CLO 2020-1 Issuer from the loans securing the CLO 2020-1 Secured Notes were able to be used by the CLO 2020-1 Issuer to purchase additional middle-market loans and recurring revenue loans under the direction of the Adviser, in its capacity as collateral manager for the CLO 2020-1 Issuer and in accordance with the Company’s investing strategy and ability to originate eligible middle-market loans and recurring revenue loans.
The CLO 2020-1 Secured Notes were the secured obligation of the CLO 2020-1 Issuers, and the CLO 2020-1 Indenture included customary covenants and events of default.
CLO 2020-1 Refinancing
On August 23, 2023 (the “CLO 2020-1 Refinancing Date”), the Company completed a $337.5 million term debt securitization refinancing (the “CLO 2020-1 Refinancing”). The secured notes issued in the CLO 2020-1 Refinancing were issued by the Company’s consolidated subsidiary Owl Rock Technology Financing 2020-1 LLC, a Delaware limited liability company (the “CLO 2020-1 Refinancing Issuer”).
The CLO 2020-1 Refinancing was executed by the issuance of the following classes of notes pursuant to an indenture and security agreement dated as of December 16, 2020 (the “CLO 2020-1 Closing Date”) by and among the Owl Rock Technology Financing 2020-1 (the “CLO 2020-1 Issuer”), CLO 2020-1 Refinancing Issuer, as co-issuer and State Street Bank and Trust Company as trustee, as supplemented by the First Supplemental Indenture dated as of July 18, 2023 by and among the CLO 2020-1 Issuer, as issuer, the CLO 2020-1 Refinancing Issuer, as co-issuer and the Trustee and the Second Supplemental Indenture dated as of the CLO 2020-1 Refinancing Date (the “CLO 2020-1 Refinancing Indenture”), by and among the CLO 2020-1 Refinancing Issuer and the Trustee: (i) $112.5 million of AAA(sf) Class A-1R Notes, which bore interest at the Benchmark plus 3.05 %, (ii) $23.5 million of AAA(sf) Class A-2R Notes, which bore interest at 6.937 %, (iii) $53 million of A(sf) Class B-1R Notes, which bore interest at the Benchmark plus 4.64 % and (iv) $15 million of A(sf) Class B-2R Notes, which bore interest at 8.497 %, (together, the “CLO 2020-1 Refinancing Secured Notes”). The CLO 2020-1 Refinancing Secured Notes were secured by the middle-market loans and other assets of the CLO 2020-1 Refinancing Issuer. The CLO 2020-1 Refinancing Secured Notes were scheduled to mature on the Payment Date (as defined in the CLO 2020-1 Refinancing Indenture) in October 2035. The CLO 2020-1 Refinancing Secured Notes were privately placed by MUFG Securities Americas Inc. and Scotia Capital (USA) Inc. The proceeds from the CLO 2020-1 Refinancing were used to redeem in full the classes of notes issued on the CLO 2020-1 Closing Date and to pay expenses incurred in connection with the CLO 2020-1 Refinancing. On the CLO 2020-1 Refinancing Date, the CLO 2020-1 Issuer was merged with and into the CLO 2020-1 Refinancing Issuer, with the CLO 2020-1 Refinancing Issuer surviving the merger. The CLO 2020-1 Refinancing Issuer assumed by all operation of law all of the rights and obligations of the CLO 2020-1 Issuer, including the subordinated securities issued by the CLO 2020-1 Issuer on the CLO 2020-1 Closing Date.
On the CLO 2020-1 Closing Date, the CLO 2020-1 Issuer entered into a loan sale agreement with the Company, which provided for the sale and contribution of approximately $243.4 million par amount of middle-market loans from the Company to the CLO 2020-1 Issuer on the CLO 2020-1 Refinancing Date and for future sales from the Company to the CLO 2020-1 Issuer on an ongoing basis. No gain or loss was recognized as a result of these sales and contributions. As part of the CLO 2020-1 Refinancing, the CLO 2020-1 Refinancing Issuer, as the successor to the CLO 2020-1 Issuer, entered into an amended and restated loan sale agreement with the Company dated as of the CLO 2020-1 Refinancing Date, pursuant to which the CLO 2020-1 Refinancing Issuer assumed all ongoing obligations of the CLO 2020-1 Issuer under the original agreement and the Company sold and contributed approximately $83.93 million par amount middle-market loans to the CLO 2020-1 Refinancing Issuer on the CLO 2020-1 Refinancing Date and provides for future sales from the Company to the CLO 2020-1 Refinancing Issuer on an ongoing basis. Such loans constituted part of the portfolio of assets securing the CLO 2020-1 Refinancing Secured Notes. The Company made customary representations, warranties, and covenants to the CLO 2020-1 Refinancing Issuer under the loan sale agreement.
Through October 15, 2027, a portion of the proceeds received by the CLO 2020-1 Refinancing Issuer may be used by the CLO 2020-1 Refinancing Issuer to purchase additional middle-market loans under the direction of the Adviser, in its capacity as collateral
F-70
Blue Owl Technology Finance Corp.
Notes to Consolidated Financial Statements - Continued
manager for the CLO 2020-1 Refinancing Issuer and in accordance with the Company’s investing strategy and ability to originate eligible middle-market loans.
The CLO 2020-1 Refinancing Secured Notes were the secured obligation of the CLO 2020-1 Refinancing Issuer, and the CLO 2020-1 Refinancing Indenture includes customary covenants and events of default.
On October 15, 2025, we redeemed in full all $204.0 million in aggregate principal amount of CLO 2020-1 at 100.0 % of their principal amount, plus the accrued interest thereon through, but excluding, October 15, 2025.
Debt Securitization Transactions Assumed in the Mergers
Athena CLO II
On December 13, 2023 (the “Athena CLO II Closing Date”), OTF II completed a $475.3 million term debt securitization transaction (the “Athena CLO II Transaction”). The secured notes and preferred shares issued in the Athena CLO II Transaction and the secured loan borrowed in the Athena CLO II Transaction were issued and incurred, as applicable, by the Company’s consolidated subsidiary Athena CLO II, LLC, a limited liability company organized under the laws of the State of Delaware (the “Athena CLO II Issuer”). On March 24, 2025, as a result of the consummation of the Mergers, the Company became party to the relevant agreements with respect to and assumed all of OTF II’s obligations under the Athena CLO II Transaction.
The Athena CLO II Transaction was executed by (A) the issuance of the following classes of notes and preferred shares pursuant to an indenture and security agreement dated as of the Athena CLO II Closing Date (the “Athena CLO II Indenture”), by and among the Athena CLO II Issuer and State Street Bank and Trust Company: (i) $40.0 million of AAA(sf) Class A Notes, which bear interest at three-month term SOFR plus 2.85 %, (ii) $16.5 million of AA(sf) Class B-1 Notes, which bore interest at three-month term SOFR plus 3.95 %, (iii) $7.5 million of AA(sf) Class B-2 Notes, which bore interest at 7.25 % and (iv) $24.0 million of A(sf) Class C Notes, which bore interest at three-month term SOFR plus 4.95 % (together, the “Athena CLO II Secured Notes”) and (B) the borrowing by the Athena CLO II Issuer of $200.0 million under floating rate Class A-L loans (the “Athena CLO II Class A-L Loans” and together with the Athena CLO II Secured Notes, the “Athena CLO II Debt”). The Athena CLO II Class A-L Loans bore interest at three-month term SOFR plus 2.85 %. The Athena CLO II Class A-L Loans were borrowed under a credit agreement (the “Athena CLO II Class A-L Credit Agreement”), dated as of the Athena CLO II Closing Date, by and among the Athena CLO II Issuer, as borrower, a financial institution, as lender, and State Street Bank and Trust Company, as collateral trustee and loan agent. The Athena CLO II Debt is secured by middle-market loans, participation interests in middle-market loans and other assets of the Athena CLO II Issuer. The Athena CLO II Debt is scheduled to mature on the Payment Date (as defined in the Athena CLO II Indenture) in January 2036. The Athena CLO II Secured Notes were privately placed by SG Americas Securities, LLC as Initial Purchaser.
The Athena CLO II Secured Notes were redeemed in the Athena CLO II Refinancing, described below.
Concurrently with the issuance of the Athena CLO II Secured Notes and the borrowing under the Athena CLO II Class A-L Loans, the Athena CLO II Issuer issued approximately $187.3 million of subordinated securities in the form of 187,300 preferred shares at an issue price of $1,000 per share (the “Athena CLO II Preferred Shares”).
As part of the Athena CLO II Transaction, OTF II entered into a loan sale agreement with the Athena CLO II Issuer dated as of the Athena CLO II Closing Date, which provided for the contribution of approximately $83.9 million funded par amount of middle-market loans from OTF II to the Athena CLO II Issuer on the Athena CLO II Closing Date and for future sales from OTF II to the Athena CLO II Issuer on an ongoing basis. Such loans constituted part of the initial portfolio of assets securing the Athena CLO II Debt. The remainder of the initial portfolio assets securing the Athena CLO II Debt consisted of approximately $380.6 million funded par amount of middle-market loans purchased by the Athena CLO II Issuer from Athena Funding I LLC, a wholly-owned subsidiary of OTF II, under an additional loan sale agreement executed on the Athena CLO II Closing Date between the Athena CLO II Issuer and Athena Funding I LLC. No gain or loss was recognized as a result of these sales and contributions. OTF II and Athena Funding I each made customary representations, warranties, and covenants to the Athena CLO II Issuer under the applicable loan sale agreement.
Through January 20, 2028, a portion of the proceeds received by the Athena CLO II Issuer from the loans securing the Athena CLO II Secured Notes were able to be used by the Athena CLO II Issuer to purchase additional middle-market loans under the direction of the Adviser, in its capacity as collateral manager for the Athena CLO II Issuer and in accordance with the Company’s investing strategy and ability to originate eligible middle-market loans.
The Athena CLO II Debt was the secured obligation of the Athena CLO II Issuer, and the Athena CLO II Indenture and Athena CLO II Class A-L Credit Agreement each included customary covenants and events of default.
Athena CLO II Refinancing
On December 16, 2025 (the “Athena CLO II Refinancing Date”), the Company completed a $615.1 million term debt securitization refinancing (the “Athena CLO II Refinancing”). The secured notes and preferred shares issued in the Athena CLO II Refinancing and the secured loan borrowed in the Athena CLO II Refinancing were issued and incurred, as applicable, by the
F-71
Blue Owl Technology Finance Corp.
Notes to Consolidated Financial Statements - Continued
Company’s consolidated subsidiary Athena CLO II, LLC, a limited liability organized under the laws of the State of Delaware (the “Athena CLO II Refinancing Issuer”).
The Athena CLO II Refinancing was executed by (A) the issuance of the following classes of notes and preferred shares pursuant to an indenture and security agreement dated as of December 13, 2023 (the “Athena CLO II Original Closing Date”), as amended and supplemented by the first supplemental indenture dated as of the Athena CLO II Refinancing Date (the “Athena CLO II Refinancing Indenture”), by and among the Athena CLO II Refinancing Issuer and State Street Bank and Trust Company: (i) $75 million of AAA(sf) Class A-R Notes, which bear interest at Benchmark plus 1.70 %, (ii) $31.25 million of AA(sf) Class B-R Notes, which bear interest at Benchmark plus 2.00 % and (iii) $18.75 million of A(sf) Class C-R Notes, which bear interest at Benchmark plus 2.40 % (together, the “Athena CLO II Refinancing Secured Notes”) and (B) the borrowing by the Athena CLO II Refinancing Issuer of $250 million under floating rate Class A-LR loans (the “Athena CLO II Refinancing Class A-LR Loans” and together with the Athena CLO II Refinancing Secured Notes, the “Athena CLO II Refinancing Debt”). The Athena CLO II Refinancing Class A-LR Loans bear interest at Benchmark plus 1.70 %. The Athena CLO II Refinancing Class A-LR Loans were borrowed under a credit agreement (the “Athena CLO II Refinancing Class A-LR Credit Agreement”), dated as of the Athena CLO II Refinancing Date, by and among the Athena CLO II Refinancing Issuer, as borrower, a financial institution, as lender, and State Street Bank and Trust Company, as collateral trustee and loan agent. The Athena CLO II Refinancing Debt is secured by middle market loans, participation interests in middle market loans and other assets of the Issuer. The Debt is scheduled to mature on January 18, 2039. The Athena CLO II Refinancing Secured Notes were privately placed by SG Americas Securities, LLC as Initial Purchaser.
Concurrently with the issuance of the Athena CLO II Refinancing Secured Notes and the borrowing under the Athena CLO II Refinancing Class A-LR Loans, the Athena CLO II Refinancing Issuer issued approximately $52.8 million of additional subordinated securities in the form of 52,800 preferred shares at an issue price of U.S.$1,000 per share (the “Athena CLO II Refinancing Additional Preferred Shares”). The total amount of outstanding preferred shares as of the Athena CLO II Refinancing Date is 240,100 .
On the Athena CLO II Original Closing Date, the Company entered into a loan sale agreement with the Athena CLO II Refinancing Issuer dated as of the Athena CLO II Original Closing Date, which provided for the contribution of approximately $83.945 million funded par amount of middle market loans from the Company to the Athena CLO II Refinancing Issuer on the Athena CLO II Original Closing Date and for future sales from the Company to the Athena CLO II Refinancing Issuer on an ongoing basis. Such loans constituted part of the initial portfolio of assets securing the Debt. As part of the Athena CLO II Refinancing, the Company and the Athena CLO II Refinancing Issuer entered into an amended and restated loan sale agreement dated as of the Athena CLO II Refinancing Date (the “OTF Loan Sale Agreement”), which provides for the sale and contribution of approximately $217.963 million funded par amount of middle market loans from the Company to the Athena CLO II Refinancing Issuer on the Athena CLO II Refinancing Date and for future sales from the Company to the Athena CLO II Refinancing Issuer on an ongoing basis. Such loans constituted part of the portfolio of assets securing the Athena CLO II Refinancing Debt. The Company made customary representations, warranties, and covenants to the Athena CLO II Refinancing Issuer under the applicable loan sale agreement.
Through January 18, 2039, a portion of the proceeds received by the Issuer from the loans securing the Athena CLO II Refinancing Debt may be used by the Athena CLO II Refinancing Issuer to purchase additional middle market loans under the direction of the Adviser, in its capacity as collateral manager for the Athena CLO II Refinancing Issuer and in accordance with the Company’s investing strategy and ability to originate eligible middle market loans.
The Athena CLO II Refinancing Debt is the secured obligation of the Athena CLO II Refinancing Issuer, and the Athena CLO II Refinancing Indenture and Athena CLO II Refinancing Class A-LR Credit Agreement each include customary covenants and events of default.
Athena CLO IV
On August 15, 2024 (the “Athena CLO IV Closing Date”), OTF II completed a $399.7 million term debt securitization transaction (the “Athena CLO IV Transaction”). The secured notes and preferred shares issued in the Athena CLO IV Transaction were issued by the Company’s consolidated subsidiary Athena CLO IV, LLC, a limited liability organized under the laws of the State of Delaware (the “Athena CLO IV Issuer”). On March 24, 2025, as a result of the consummation of the Mergers, the Company became party to the relevant agreements with respect to and assumed all of OTF II’s obligations under the Athena CLO IV Transaction.
The Athena CLO IV Transaction was executed by the issuance of the following classes of notes and preferred shares pursuant to an indenture and security agreement dated as of the Athena CLO IV Closing Date (the “Athena CLO IV Indenture”), by and among the Athena CLO IV Issuer and State Street Bank and Trust Company: (i) $208 million of AAA(sf) Class A Notes, which bear interest at three-month term SOFR plus 2.00 %, (ii) $7.0 million of AA(sf) Class B-1 Notes, which bear interest at three-month term SOFR plus 2.50 %, (iii) $13.0 million of AA(sf) Class B-2 Notes, which bear interest at 6.254 % and (iv) $12 million of A(sf) Class C Notes, which bear interest at three-month term SOFR plus 2.64 % (together, the “Athena CLO IV Secured Notes”). The Athena CLO IV Secured Notes are secured by middle-market loans, participation interests in middle-market loans and other assets of the Athena CLO IV Issuer. The Athena CLO IV Secured Notes are scheduled to mature on the Payment Date (as defined in the Athena CLO IV Indenture) in July 2037. The Athena CLO IV Secured Notes were privately placed by MUFG Securities Americas Inc. as Initial
F-72
Blue Owl Technology Finance Corp.
Notes to Consolidated Financial Statements - Continued
Purchaser with respect to the Athena CLO IV Secured Notes and NatWest Markets Securities Inc. as Co-Placement Agent solely with respect to the Athena CLO IV Class A Secured Notes.
Concurrently with the issuance of the Athena CLO IV Secured Notes, the Athena CLO IV Issuer issued approximately $159.7 million of subordinated securities in the form of 159,700 preferred shares at an issue price of $1,000 per share (the “Athena CLO IV Preferred Shares”).
As part of the Athena CLO IV Transaction, OTF II entered into a loan sale agreement with the Athena CLO IV Issuer dated as of the Athena CLO IV Closing Date, which provided for the contribution of approximately $215.5 million funded par amount of middle-market loans from OTF II to the Athena CLO IV Issuer on the Athena CLO IV Closing Date and for future sales from OTF II to the Athena CLO IV Issuer on an ongoing basis. Such loans constituted part of the initial portfolio of assets securing the Athena CLO IV Secured Notes. The remainder of the initial portfolio assets securing the Athena CLO IV Secured Notes consisted of approximately $182.4 million funded par amount of middle-market loans purchased by the Athena CLO IV Issuer from Athena Funding II LLC, a wholly-owned subsidiary of the Company, under an additional loan sale agreement executed on the Athena CLO IV Closing Date between the Athena CLO IV Issuer and Athena Funding II LLC. No gain or loss was recognized as a result of these sales and contributions. OTF II and Athena Funding II each made customary representations, warranties, and covenants to the Issuer under the applicable loan sale agreement.
Through the Payment Date in July 2029, a portion of the proceeds received by the Athena CLO IV Issuer from the loans securing the Athena CLO IV Secured Notes may be used by the Athena CLO IV Issuer to purchase additional middle-market loans under the direction of the Adviser, the Company’s investment advisor, in its capacity as collateral manager for the Athena CLO IV Issuer and in accordance with the Company’s investing strategy and ability to originate eligible middle-market loans.
The Athena CLO IV Secured Notes are the secured obligation of the Athena CLO IV Issuer, and the Athena CLO IV Indenture includes customary covenants and events of default.
Athena CLO V
On October 8, 2025 (the “Athena CLO V Closing Date”), the Company completed a $501.3 million term debt securitization transaction (the “Athena CLO V Transaction”). The secured notes and preferred shares issued in the Athena CLO V Transaction were issued by the Company’s consolidated subsidiary Athena CLO V, LLC, a limited liability company organized under the laws of the State of Delaware (the “Athena CLO V Issuer”) and are backed by a portfolio of collateral obligations consisting of middle market loans and participation interests in middle market loans as well as by other assets of the Issuer.
The Athena CLO V Transaction was executed by the issuance of the following classes of notes and preferred shares pursuant to an indenture dated as of the Closing Date (the “Athena CLO V Indenture”), by and among the Athena CLO V Issuer and State Street Bank and Trust Company: (i) $260 million of AAA(sf) Class A Notes, which bear interest at three-month term SOFR plus 1.73 %, (ii) $25 million of AA(sf) Class B Notes, which bear interest at three-month term SOFR plus 2.25 % and (iii) $15 million of A(sf) Class C Notes, which bear interest at three-month term SOFR plus 2.70 % (together, the “Athena CLO V Secured Notes”). The Athena CLO V Notes are secured by middle market loans, participation interests in middle market loans and other assets of the Issuer. The Notes are scheduled to mature on October 15, 2038. The Secured Notes were privately placed by MUFG Securities Americas Inc. as Initial Purchaser and NatWest Markets Securities Inc. as Co-Placement Agent with respect to the Class A Notes. Concurrently with the issuance of the Athena CLO V Secured Notes, the Athena CLO V Issuer issued approximately $201.3 million of subordinated securities in the form of 201,320 preferred shares at an issue price of U.S.$1,000 per share (the “Athena CLO V Preferred Shares”).
As part of the Athena CLO V CLO Transaction, the Company entered into a loan sale agreement with the Athena CLO V Issuer dated as of the Athena CLO V Closing Date (the “Athena CLO V OTF Loan Sale Agreement”), which provided for the contribution of approximately $447.7 million funded par amount of middle market loans from the Company to the Athena CLO V Issuer on the Closing Date and for future sales from the Company to the Athena CLO V Issuer on an ongoing basis. Such loans constituted part of the initial portfolio of assets securing the Athena CLO V Notes. No gain or loss was recognized as a result of these sales and contributions. The Company made customary representations, warranties, and covenants to the Issuer under the loan sale agreement.
Through October 15, 2030, a portion of the proceeds received by the Athena CLO V Issuer from the loans securing the Athena CLO V Secured Notes may be used by the Athena CLO V Issuer to purchase additional middle market loans under the direction of the Adviser, the Company’s investment advisor, in its capacity as collateral manager for the Issuer and in accordance with the Company’s investing strategy and ability to originate eligible middle market loans.
Unsecured Notes
Tripartite Agreement
On August 11, 2025, the Company entered into an agreement of removal, appointment and acceptance (the “Tripartite Agreement”), with Computershare Trust Company, N.A., as successor to Wells Fargo Bank, National Association (the “Retiring Trustee”) and Deutsche Bank Trust Company Americas (the “Successor Trustee”), with respect to the Indenture, dated June 12, 2020
F-73
Blue Owl Technology Finance Corp.
Notes to Consolidated Financial Statements - Continued
between the Company and the Retiring Trustee (the “Base Indenture”), the second supplemental indenture, dated September 23, 2020 (the “Second Supplemental Indenture”) between the Company and the Retiring Trustee, the third supplemental indenture, dated December 17, 2020 (the “Third Supplemental Indenture”) between the Company and the Retiring Trustee, the Fourth Supplemental Indenture, dated June 14, 2021 (the “Fourth Supplemental Indenture”) between the Company and the Retiring Trustee, and the Fifth Supplemental Indenture, dated January 21, 2025 (the “Fifth Supplemental Indenture” and together with the Base Indenture, the Second Supplemental Indenture, the Third Supplemental Indenture, and the Fourth Supplemental Indenture, the “Indenture”) between the Company and the Retiring Trustee.
The Tripartite Agreement provides that, effective as of the date thereof, (1) the Retiring Trustee assigns, transfers, delivers and confirms to the Successor Trustee all of its rights, title and interest under the Indenture and all of the rights, power, trusts and duties as trustee, security registrar, paying agent, authenticating agent and depositary custodian under the Indenture; and (2) the Successor Trustee accepts its appointment as successor trustee, security registrar, paying agent, authenticating agent and depositary custodian under the Indenture, and accepts the rights, indemnities, protections, powers, trust and duties of or afforded to Retiring Trustee as trustee, security registrar, paying agent, authenticating agent and depositary custodian under the Indenture. The Successor Trustee’s appointment became effective on August 25, 2025.
June 2025 Notes
On June 12, 2020, the Company issued $210 million aggregate principal amount of 6.75 % notes that were due on June 30, 2025 (the “June 2025 Notes”) in a private placement in reliance on Section 4(a)(2) of the Securities Act and for initial resale to qualified institutional buyers pursuant to the exemption from registration provided by Rule 144A promulgated under the Securities Act.
On April 28, 2025, the Company caused notice to be issued to the Trustee of the June 2025 Notes regarding the Company’s exercise of the option to redeem in full all $210.0 million in aggregate principal amount of the June 2025 Notes at 100.0 % of their principal amount, plus the accrued interest thereon through, but excluding, the redemption date, May 30, 2025. On May 30, 2025, the Company redeemed in full all $210.0 million in aggregate principal amount of the June 2025 Notes at 100.0 % of their principal amount, plus the accrued interest thereon through, but excluding, May 30, 2025.
The June 2025 Notes bore interest at a rate of 6.75 % per year payable semi-annually on June 30 and December 30 of each year, commencing on December 30, 2020. The June 2025 Notes were the Company’s direct, general unsecured obligations and ranked senior in right of payment to all of the Company’s future indebtedness or other obligations that were expressly subordinated, or junior, in right of payment to the June 2025 Notes.
December 2025 Notes
On September 23, 2020, the Company issued $400 million aggregate principal amount of its 4.75 % notes due 2025 (the “December 2025 Notes”) and on November 23, 2021, the Company issued an additional $250 million aggregate principal amount of the December 2025 Notes in a private placement in reliance on Section 4(a)(2) of the Securities Act, and for initial resale to qualified institutional buyers pursuant to the exemption from registration provided by Rule 144A promulgated under the Securities Act.
On October 15, 2025, the Company caused notice to be issued to the Trustee of the December 2025 Notes regarding the Company’s exercise of the option to redeem in full all $400 million in aggregate principal amount of the December 2025 Notes at 100.0 % of their principal amount, plus the accrued interest thereon through, but excluding, the redemption date, November 15, 2025. On November 15, 2025, the Company redeemed in full all $400 million in aggregate principal amount of the December 2025 Notes at 100.0 % of their principal amount, plus the accrued interest thereon through, but excluding, November 15, 2025.
The December 2025 Notes bore interest at a rate of 4.75 % per year payable semi-annually on June 15 and December 15 of each year, commencing on December 15, 2020. The December 2025 Notes were the Company’s direct, general unsecured obligations and ranked senior in right of payment to all of the Company’s future indebtedness or other obligations that are expressly subordinated, or junior, in right of payment to the December 2025 Notes.
June 2026 Notes
On December 17, 2020, the Company issued $375 million aggregate principal amount of 3.75 % notes due 2026 (the “June 2026 Notes”) in a private placement in reliance on Section 4(a)(2) of the Securities Act, and for initial resale to qualified institutional buyers pursuant to the exemption from registration provided by Rule 144A promulgated under the Securities Act. The June 2026 Notes have not been registered under the Securities Act and may not be offered or sold in the United States absent registration or an applicable exemption from registration.
The June 2026 Notes were issued pursuant to the Base Indenture and the Third Supplemental Indenture (together, the “June 2026 Indenture”). The June 2026 Notes will mature on June 17, 2026 and may be redeemed in whole or in part at the Company’s option at any time or from time to time at the redemption prices set forth in the June 2026 Indenture. The June 2026 Notes bear interest at a rate of 3.75 % per year payable semi-annually on June 17 and December 17 of each year, commencing on June 17, 2021. The June 2026 Notes are the Company’s direct, general unsecured obligations and will rank senior in right of payment to all of the Company's future indebtedness or other obligations that are expressly subordinated, or junior, in right of payment to the June 2026
F-74
Blue Owl Technology Finance Corp.
Notes to Consolidated Financial Statements - Continued
Notes. The June 2026 Notes rank pari passu, or equal, in right of payment with all of the Company’s existing and future indebtedness or other obligations that are not so subordinated, or junior to the June 2026 Notes. The June 2026 Notes rank effectively subordinated, or junior, to any of the Company’s future secured indebtedness or other obligations (including unsecured indebtedness that the Company later secures) to the extent of the value of the assets securing such indebtedness. The June 2026 Notes rank structurally subordinated, or junior, to all existing and future indebtedness and other obligations (including trade payables) incurred by the Company’s subsidiaries, financing vehicles or similar facilities.
The June 2026 Indenture contains certain covenants, including covenants requiring the Company to (i) comply with the asset coverage requirements of the Investment Company Act of 1940, as amended 1940, whether or not it is subject to those requirements, and (ii) provide financial information to the holders of the June 2026 Notes and the Successor Trustee if the Company is no longer subject to the reporting requirements under the Securities Exchange Act of 1934, as amended. These covenants are subject to important limitations and exceptions that are described in the Indenture.
In addition, if a change of control repurchase event, as defined in the June 2026 Indenture, occurs prior to maturity, holders of the June 2026 Notes will have the right, at their option, to require the Company to repurchase for cash some or all of the June 2026 Notes at a repurchase price equal to 100 % of the aggregate principal amount of the June 2026 Notes being repurchased, plus accrued and unpaid interest to, but excluding, the repurchase date.
January 2027 Notes
On June 14, 2021, the Company issued $300 million aggregate principal amount of 2.50 % notes due 2027 (the “January 2027 Notes”). The January 2027 Notes were issued pursuant to the Base Indenture and the Fourth Supplemental Indenture (together, the “January 2027 Indenture”). The January 2027 Notes will mature on January 15, 2027 and may be redeemed in whole or in part at the Company’s option at any time or from time to time at the redemption prices set forth in the January 2027 Indenture. The January 2027 Notes bear interest at a rate of 2.50 % per year, payable semi-annually on January 15 and July 15 of each year, commencing on January 15, 2022. The January 2027 Notes are the Company’s direct, general unsecured obligations and rank senior in right of payment to all of the Company’s future indebtedness or other obligations that are expressly subordinated, or junior, in right of payment to the January 2027 Notes. The January 2027 Notes rank pari passu, or equal, in right of payment with all of the Company’s existing and future indebtedness or other obligations that are not so subordinated, or junior to the January 2027 Notes. The January 2027 Notes rank effectively subordinated, or junior, to any of the Company’s future secured indebtedness or other obligations (including unsecured indebtedness that the Company later secures) to the extent of the value of the assets securing such indebtedness. The January 2027 Notes rank structurally subordinated, or junior, to all existing and future indebtedness and other obligations (including trade payables) incurred by the Company’s subsidiaries, financing vehicles or similar facilities.
The January 2027 Indenture contains certain covenants, including covenants requiring the Company to (i) comply with the asset coverage requirements of the 1940 Act, whether or not it is subject to those requirements, and (ii) provide financial information to the holders of the January 2027 Notes and the Successor Trustee if the Company is no longer subject to the reporting requirements under the Securities Exchange Act of 1934, as amended. These covenants are subject to important limitations and exceptions that are described in the Indenture.
In addition, if a change of control repurchase event, as defined in the January 2027 Indenture, occurs prior to maturity, holders of the January 2027 Notes will have the right, at their option, to require the Company to repurchase for cash some or all of the January 2027 Notes at a repurchase price equal to 100 % of the aggregate principal amount of the January 2027 Notes being repurchased, plus accrued and unpaid interest to, but excluding, the repurchase date.
March 2028 Notes
On January 21, 2025, the Company issued $650.0 million aggregate principal amount of its 6.100 % notes due 2028 (the “March 2028 Notes”) in a private placement in reliance on Section 4(a)(2) of the Securities Act, and for initial resale to qualified institutional buyers pursuant to Rule 144A under the Securities Act and non-U.S. persons outside the United States in compliance with Regulation S under the Securities Act. When initially issued, the March 2028 Notes were not registered under the Securities Act and could not be offered or sold in the United States absent registration or an applicable exemption from registration.
The March 2028 Notes were issued pursuant to the Base Indenture and the Fifth Supplemental Indenture (together , the “March 2028 Indenture”). The March 2028 Notes will mature on March 15, 2028 and may be redeemed in whole or in part at the Company’s option at any time or from time to time at the redemption prices set forth in the March 2028 Indenture. The March 2028 Notes bear interest at a rate of 6.100 % per year payable semi-annually on March 15 and September 15 of each year, commencing on September 15, 2025. Concurrent with the issuance of the March 2028 Notes, the Company entered into a Registration Rights Agreement (the “March 2028 Registration Rights Agreement”) for the benefit of the purchasers of the March 2028 Notes. Pursuant to the terms of the March 2028 Registration Rights Agreement, the Company filed a registration statement with the SEC and, on December 9, 2025, commenced an offer to exchange the notes initially issued on January 21, 2025 for newly issued registered notes with substantially similar terms, which expired on January 9, 2026 and was completed promptly thereafter.
F-75
Blue Owl Technology Finance Corp.
Notes to Consolidated Financial Statements - Continued
The March 2028 Indenture contains certain covenants, including covenants requiring the Company to (i) comply with the 1940 Act, whether or not it is subject to those requirements, and (ii) provide financial information to the holders of the March 2028 Notes and the Successor Trustee if the Company is no longer subject to the reporting requirements under the Securities Exchange Act of 1934, as amended. These covenants are subject to important limitations and exceptions that are described in the March 2028 Indenture.
In addition, if a change of control repurchase event, as defined in the March 2028 Indenture, occurs prior to maturity, holders of the March 2028 Notes will have the right, at their option, to require the Company to repurchase for cash some or all of the Notes at a repurchase price equal to 100 % of the aggregate principal amount of the March 2028 Notes being repurchased, plus accrued and unpaid interest to, but not including, the repurchase date.
In connection with the issuance of the March 2028 Notes, on January 21, 2025, the Company entered into a bilateral interest rate swap. The notional amount of the interest rate swap is $650.0 million. The Company will receive fixed rate interest at 6.100 % and pay variable rate interest based on SOFR plus 1.767 %. The interest rate swap matures on February 15, 2028. For the year ended December 31, 2025, the Company made periodic payments of $35.6 million. The interest expense related to the March 2028 Notes is equally offset by the proceeds received from the interest rate swap. The swap adjusted interest expense is included as a component of interest expense on the Company’s Consolidated Statements of Operations. As of December 31, 2025, the interest rate swap had a fair value of $12.1 million. Depending on the nature of the balance at period end, the fair value of the interest rate swap is either included as a component of accrued expenses and other liabilities or prepaid expenses and other assets on the Company’s Consolidated Statements of Assets and Liabilities. The change in fair value of the interest rate swap is offset by the change in net carrying value of the March 2028 Notes, with the remaining difference included as a component of interest expense on the Consolidated Statements of Operations.
Notes Assumed in the Mergers
On March 24, 2025, in connection with the Mergers, the Company entered into a Second Supplemental Indenture (the “OTF II Supplemental Indenture”) relating to the Company’s assumption of the April 2029 Notes (as defined below). Also on March 24, 2025, in connection with the Mergers, the Company entered into an assumption agreement (the “OTF II Note Assumption Agreement”) relating to the Company’s assumption of the September 2028 Notes (as defined below).
September 2028 Notes
On September 27, 2023, OTF II entered into a Note Purchase Agreement (the “September 2028 Notes Note Purchase Agreement”) governing the issuance of $75.0 million in aggregate principal amount of September 2028 Notes, due September 27, 2028, with a fixed interest rate of 8.50 % per year (the “ September 2028 Notes”), to qualified institutional investors in a private placement. As of September 27, 2023, the September 2028 Notes were guaranteed by OR Tech Lending II LLC, ORTF II FSI LLC and ORTF II BC 2 LLC, subsidiaries of the Company. On March 24, 2025, the Company entered into the OTF II Note Assumption Agreement for the benefit of the Noteholders (as defined in the September 2028 Notes Note Purchase Agreement) pursuant to which the Company unconditionally and expressly assumed, confirmed and agreed to perform and observe each and every one of the covenants, rights, promises, agreements, terms, conditions, obligations, duties and liabilities of OTF II under the September 2028 Notes Note Purchase Agreement, under the September 2028 Notes and under any documents, instruments or agreements executed and delivered or furnished by OTF II in connection therewith, and to be bound by all waivers made by OTF II with respect to any matter set forth therein.
Interest on the September 2028 Notes will be due semiannually on March 27 and September 27 each year. The September 2028 Notes may be redeemed in whole or in part at any time or from time to time at the Company’s option at par plus accrued interest to the prepayment date and, if applicable, a make-whole premium. In addition, the Company is obligated to offer to prepay the September 2028 Notes at par plus accrued and unpaid interest up to, but excluding, the date of prepayment, if certain change in control events occur. The September 2028 Notes are general unsecured obligations of the Company that rank pari passu with all outstanding and future unsecured unsubordinated indebtedness issued by the Company.
The September 2028 Notes Note Purchase Agreement contains customary terms and conditions for senior unsecured notes issued in a private placement, including, without limitation, affirmative and negative covenants such as information reporting, maintenance of the Company’s status as a BDC within the meaning of the 1940 Act, a minimum net worth test, and a minimum asset coverage ratio of 1.50 to 1.00.
In addition, in the event that a Below Investment Grade Event (as defined in the September 2028 Notes Note Purchase Agreement) occurs, the September 2028 Notes will bear interest at a fixed rate per annum which is 1.00 % above the stated rate of the September 2028 Notes from the date of the occurrence of the Below Investment Grade Event to and until the date on which the Below Investment Grade Event is no longer continuing. In the event that a Secured Debt Ratio Event (as defined in the September 2028 Notes Note Purchase Agreement) occurs, the September 2028 Notes will bear interest at a fixed rate per annum which is 1.50 % above the stated rate of the September 2028 Notes from the date of the occurrence of the Secured Debt Ratio Event to and until the date on which the Secured Debt Ratio Event is no longer continuing. In the event that both a Below Investment Grade Event and a Secured Debt Ratio Event have occurred and are continuing, the September 2028 Notes will bear interest at a fixed rate per annum which is
F-76
Blue Owl Technology Finance Corp.
Notes to Consolidated Financial Statements - Continued
The Note Purchase Agreement also contains customary events of default with customary cure and notice periods, including, without limitation, nonpayment, incorrect representation in any material respect, breach of covenant, certain cross-defaults or cross-acceleration under other indebtedness of the Company, certain judgments and orders and certain events of bankruptcy.
April 2029 Notes
On April 4, 2024, OTF II issued $700.0 million aggregate principal amount of its 6.750 % notes due 2029 (the “April 2029 Notes”) in a private placement in reliance on Section 4(a)(2) of the Securities Act, and for initial resale to qualified institutional buyers pursuant to the exemption from registration provided by Rule 144A promulgated under the Securities Act. The April 2029 Notes have not been registered under the Securities Act and may not be offered or sold in the United States absent registration or an applicable exemption from registration. On March 24, 2025, the Company entered into the OTF II Second Supplemental Indenture by and between the Successor Trustee, effective as of the closing of the Mergers. Pursuant to the Second Supplemental Indenture, the Company expressly assumed the obligations of OTF II for the due and punctual payment of the principal of, and premium, if any, and interest on all the April 2029 Notes outstanding, and the due and punctual performance and observance of all of the covenants and conditions of the April 2029 Indenture (as defined below).
The April 2029 Notes were issued pursuant to an Indenture (the “OTF II Base Indenture”) and a First Supplemental Indenture, dated as of April 4, 2024 (the “April 2029 First Supplemental Indenture” and together with the OTF II Base Indenture, the “April 2029 Indenture”), between OTF II and the Trustee. The April 2029 Notes will mature on April 4, 2029, unless repurchased or redeemed in accordance with their terms prior to such date. The April 2029 Notes bear interest at a rate of 6.750 % per year payable semi-annually on April 4 and October 4 of each year, commencing on October 4, 2024. Concurrent with the issuance of the April 2029 Notes, OTF II entered into a Registration Rights Agreement (the “April 2029 Notes Registration Rights Agreement”) for the benefit of the purchasers of the April 2029 Notes. Pursuant to the April 2029 Notes Registration Rights Agreement, OTF II filed a registration statement with the SEC and, on December 23, 2024, commenced an offer to exchange the notes initially issued on April 4, 2024 for newly issued registered notes with substantially similar terms, which expired on January 24, 2025 and was completed promptly thereafter.
The April 2029 Notes are the Company’s direct, general unsecured obligations and rank senior in right of payment to all of the Company’s future indebtedness or other obligations that are expressly subordinated, or junior, in right of payment to the April 2029 Notes. The April 2029 Notes rank pari passu, or equal, in right of payment with all of the Company’s existing and future indebtedness or other obligations that are not so subordinated, or junior to the April 2029 Notes. The April 2029 Notes rank effectively subordinated, or junior, to any of the Company’s future secured indebtedness or other obligations (including unsecured indebtedness that the Company later secures) to the extent of the value of the assets securing such indebtedness. The April 2029 Notes are structurally subordinated, or junior, to all existing and future indebtedness and other obligations (including trade payables) incurred by the Company’s subsidiaries, financing vehicles or similar facilities.
The April 2029 Indenture contains certain covenants, including covenants requiring the Company to (i) comply with Section 18(a)(1)(A) of the 1940 Act, as modified by Section 61(a) of the 1940 Act, for the period of time during which the April 2029 Notes are outstanding, whether or not it is subject to those requirements, and (ii) provide financial information to the holders of the April 2029 Notes and the Successor Trustee if the Company is no longer subject to the reporting requirements under the Exchange Act. These covenants are subject to important limitations and exceptions that are described in the OTF II Indenture.
In addition, if a change of control repurchase event, as defined in the OTF II Indenture, occurs prior to maturity, holders of the April 2029 Notes will have the right, at their option, to require the Company to repurchase for cash some or all of the April 2029 Notes at a repurchase price equal to 100 % of the aggregate principal amount of the April 2029 Notes being repurchased, plus accrued and unpaid interest to, but excluding, the repurchase date.
In connection with the issuance of the April 2029 Notes, on April 4, 2024 OTF II entered into a bilateral interest rate swap. The notional amount of the interest rate swap is $700.0 million. The Company will receive fixed rate interest at 6.750 % and pay variable rate interest based on SOFR plus 2.565 %. The interest rate swap matures on March 4, 2029. For the year ended December 31, 2025, the Company made periodic payments of $3.0 million. The interest expense related to the April 2029 Notes is equally offset by the proceeds received from the interest rate swap. The swap adjusted interest expense is included as a component of interest expense on the Company’s Consolidated Statements of Operations. As of December 31, 2025, the interest rate swap had a fair value of $14.6 million. Depending on the nature of the balance at period end, the fair value of the interest rate swap is either included as a component of accrued expenses and other liabilities or prepaid expenses and other assets on the Company’s Consolidated Statements of Assets and Liabilities. The change in fair value of the interest rate swap is offset by the change in net carrying value of the April 2029 Notes, with the remaining difference included as a component of interest expense on the Consolidated Statements of Operations.
F-77
Blue Owl Technology Finance Corp.
Notes to Consolidated Financial Statements - Continued
Maturity of Debt Obligations
The table below presents a summary of the Company’s contractual payment obligations under credit facilities and notes as of December 31, 2025:
| Payments Due by Period | |||||||||||||||||||||||||||||
| ($ in thousands) | Total | Less than 1 year | 1-3 years | 3-5 years | After 5 years | ||||||||||||||||||||||||
| Revolving Credit Facility | $ | $ | $ | $ | $ | ||||||||||||||||||||||||
| SPV Asset Facility I | |||||||||||||||||||||||||||||
| SPV Asset Facility II | |||||||||||||||||||||||||||||
| SPV Asset Facility III | |||||||||||||||||||||||||||||
| SPV Asset Facility IV | |||||||||||||||||||||||||||||
| Athena CLO II | |||||||||||||||||||||||||||||
| Athena CLO IV | |||||||||||||||||||||||||||||
| Athena CLO V | |||||||||||||||||||||||||||||
| June 2026 Notes | |||||||||||||||||||||||||||||
| January 2027 Notes | |||||||||||||||||||||||||||||
| March 2028 Notes | |||||||||||||||||||||||||||||
| September 2028 Notes | |||||||||||||||||||||||||||||
| April 2029 Notes | |||||||||||||||||||||||||||||
| Total Contractual Obligations | $ | $ | $ | $ | $ | ||||||||||||||||||||||||
Note 6. Fair Value of Financial Instruments
Investments
The tables below present the fair value hierarchy of investments as of the following periods:
Fair Value Hierarchy as of December 31, 2025 | |||||||||||||||||||||||
| ($ in thousands) | Level 1 | Level 2 | Level 3 | Total | |||||||||||||||||||
| Cash (including restricted and foreign cash) | $ | $ | — | $ | — | $ | |||||||||||||||||
| Investments: | |||||||||||||||||||||||
First-lien senior secured debt investments | $ | $ | $ | $ | |||||||||||||||||||
| Second-lien senior secured debt investments | |||||||||||||||||||||||
| Unsecured debt investments | |||||||||||||||||||||||
| Specialty finance debt investments | |||||||||||||||||||||||
Preferred equity investments | |||||||||||||||||||||||
Common equity investments | |||||||||||||||||||||||
| Specialty finance equity investments | |||||||||||||||||||||||
| Subtotal | $ | $ | $ | $ | |||||||||||||||||||
Investments measured at Net Asset Value(1) | — | — | — | ||||||||||||||||||||
| Total Investments at fair value | $ | $ | $ | $ | |||||||||||||||||||
| Derivatives: | |||||||||||||||||||||||
| Foreign currency forward contracts | $ | $ | ( | $ | $ | ( | |||||||||||||||||
| Interest rate swaps | $ | $ | $ | $ | |||||||||||||||||||
(1)Includes equity investments in Credit SLF, LSI Financing LLC, BOCSO, Blue Owl Leasing and Stripe Blue Owl, which are measured at fair value using the net asset value per share (or its equivalent) practical expedient and have not been categorized in the fair value hierarchy. The fair value amounts presented in this table are intended to permit reconciliation of the fair value hierarchy to the amounts presented in the Consolidated Statements of Assets and Liabilities.
F-78
Blue Owl Technology Finance Corp.
Notes to Consolidated Financial Statements - Continued
Fair Value Hierarchy as of December 31, 2024 | |||||||||||||||||||||||
| ($ in thousands) | Level 1 | Level 2 | Level 3 | Total | |||||||||||||||||||
| Cash (including restricted and foreign cash) | $ | $ | — | $ | — | $ | |||||||||||||||||
| Investments: | |||||||||||||||||||||||
| First-lien senior secured debt investments | $ | $ | $ | $ | |||||||||||||||||||
| Second-lien senior secured debt investments | |||||||||||||||||||||||
| Unsecured debt investments | |||||||||||||||||||||||
| Specialty finance debt investments | |||||||||||||||||||||||
Preferred equity investments | |||||||||||||||||||||||
Common equity investments | |||||||||||||||||||||||
| Specialty finance equity investments | |||||||||||||||||||||||
| Subtotal | $ | $ | $ | $ | |||||||||||||||||||
Investments measured at Net Asset Value(1) | — | — | — | ||||||||||||||||||||
| Total Investments at fair value | $ | $ | $ | $ | |||||||||||||||||||
(1)Includes equity investments in Credit SLF and LSI Financing LLC, which are measured at fair value using the net asset value per share (or its equivalent) practical expedient and have not been categorized in the fair value hierarchy. The fair value amounts presented in this table are intended to permit reconciliation of the fair value hierarchy to the amounts presented in the Consolidated Statements of Assets and Liabilities.
The tables below present changes in the fair value of investments for which Level 3 inputs were used to determine the fair value as of and for the following periods:
As of and for the Year Ended December 31, 2025 | ||||||||||||||||||||||||||||||||||||||||||||||||||
| ($ in thousands) | First-lien senior secured debt investments | Second-lien senior secured debt investments | Unsecured debt investments | Specialty finance debt investments | Preferred equity investments | Common equity investments | Specialty finance equity investments | Total | ||||||||||||||||||||||||||||||||||||||||||
| Fair value, beginning of period | $ | $ | $ | $ | $ | $ | $ | $ | ||||||||||||||||||||||||||||||||||||||||||
| Purchases of investments, net | ||||||||||||||||||||||||||||||||||||||||||||||||||
| Payment-in-kind | ||||||||||||||||||||||||||||||||||||||||||||||||||
| Proceeds from investments, net | ( | ( | ( | ( | ( | ( | ( | |||||||||||||||||||||||||||||||||||||||||||
| Net change in unrealized gain (loss) | ( | |||||||||||||||||||||||||||||||||||||||||||||||||
| Net realized gains (losses) | ( | ( | ||||||||||||||||||||||||||||||||||||||||||||||||
| Net amortization/accretion of premium/discount on investments | ( | |||||||||||||||||||||||||||||||||||||||||||||||||
| Transfers between investment types | ( | |||||||||||||||||||||||||||||||||||||||||||||||||
Transfers into (out of) Level 3(1) | ( | ( | ||||||||||||||||||||||||||||||||||||||||||||||||
Transfers in from the Mergers | ||||||||||||||||||||||||||||||||||||||||||||||||||
| Fair value, end of period | $ | $ | $ | $ | $ | $ | $ | $ | ||||||||||||||||||||||||||||||||||||||||||
(1)Transfers between levels, if any, are recognized at the beginning of the period noted. For the year ended December 31, 2025, transfers between Level 2 and Level 3 were as a result of changes in the observability of significant inputs for certain portfolio companies.
F-79
Blue Owl Technology Finance Corp.
Notes to Consolidated Financial Statements - Continued
As of and for the Year Ended December 31, 2024 | ||||||||||||||||||||||||||||||||||||||||||||||||||
| ($ in thousands) | First-lien senior secured debt investments | Second-lien senior secured debt investments | Unsecured debt investments | Specialty finance debt investments | Preferred equity investments | Common equity investments | Specialty finance equity investments | Total | ||||||||||||||||||||||||||||||||||||||||||
| Fair value, beginning of period | $ | $ | $ | $ | $ | $ | $ | $ | ||||||||||||||||||||||||||||||||||||||||||
| Purchases of investments, net | ||||||||||||||||||||||||||||||||||||||||||||||||||
| Payment-in-kind | ||||||||||||||||||||||||||||||||||||||||||||||||||
| Proceeds from investments, net | ( | ( | ( | ( | ( | ( | ( | ( | ||||||||||||||||||||||||||||||||||||||||||
| Net change in unrealized gain (loss) | ( | ( | ( | |||||||||||||||||||||||||||||||||||||||||||||||
| Net realized gains (losses) | ( | ( | ( | ( | ( | |||||||||||||||||||||||||||||||||||||||||||||
| Net amortization of discount on investments | ||||||||||||||||||||||||||||||||||||||||||||||||||
| Transfers between investment types | ( | ( | ( | |||||||||||||||||||||||||||||||||||||||||||||||
Transfers into (out of) Level 3(1) | ||||||||||||||||||||||||||||||||||||||||||||||||||
| Fair value, end of period | $ | $ | $ | $ | $ | $ | $ | $ | ||||||||||||||||||||||||||||||||||||||||||
(1)Transfers between levels, if any, are recognized at the beginning of the period noted. For the year ended December 31, 2024, transfers into (out of) Level 3 were as a result of changes in the observability of significant inputs for certain portfolio companies.
F-80
Blue Owl Technology Finance Corp.
Notes to Consolidated Financial Statements - Continued
As of and for the Year Ended December 31, 2023 | ||||||||||||||||||||||||||||||||||||||||||||||||||
| ($ in thousands) | First-lien senior secured debt investments | Second-lien senior secured debt investments | Unsecured debt investments | Specialty finance debt investments | Preferred equity investments | Common equity investments | Specialty finance equity investments | Total | ||||||||||||||||||||||||||||||||||||||||||
| Fair value, beginning of period | $ | $ | $ | $ | $ | $ | $ | $ | ||||||||||||||||||||||||||||||||||||||||||
| Purchases of investments, net | ||||||||||||||||||||||||||||||||||||||||||||||||||
| Payment-in-kind | ||||||||||||||||||||||||||||||||||||||||||||||||||
| Proceeds from investments, net | ( | ( | ( | ( | ( | ( | ||||||||||||||||||||||||||||||||||||||||||||
| Net change in unrealized gain (loss) | ( | ( | ||||||||||||||||||||||||||||||||||||||||||||||||
| Net realized gains (losses) | ( | ( | ( | |||||||||||||||||||||||||||||||||||||||||||||||
| Net amortization of discount on investments | ||||||||||||||||||||||||||||||||||||||||||||||||||
| Transfers between investment types | ( | ( | ||||||||||||||||||||||||||||||||||||||||||||||||
| Transfers into (out of) Level 3(1) | ( | ( | ( | ( | ||||||||||||||||||||||||||||||||||||||||||||||
| Fair value, end of period | $ | $ | $ | $ | $ | $ | $ | $ | ||||||||||||||||||||||||||||||||||||||||||
(1)Transfers between levels, if any, are recognized at the beginning of the period noted. For the year ended December 31, 2023, transfers into (out of) Level 3 were as a result of changes in the observability of significant inputs for certain portfolio companies.
The table below presents information with respect to net change in unrealized gains (losses) on investments for which Level 3 inputs were used in determining the fair value that are still held by the Company for the following periods:
| ($ in thousands) | for the Year Ended December 31, 2025 on Investments Held at December 31, 2025 | Net change in unrealized gain (loss) for the Year Ended December 31, 2024 on Investments Held at December 31, 2024 | |||||||||
| First-lien senior secured debt investments | $ | $ | ( | ||||||||
| Second-lien senior secured debt investments | ( | ( | |||||||||
| Unsecured debt investments | |||||||||||
| Specialty finance debt investments | ( | ||||||||||
| Preferred equity investments | ( | ||||||||||
| Common equity investments | |||||||||||
| Specialty finance equity investments | |||||||||||
| Total Investments | $ | $ | |||||||||
F-81
Blue Owl Technology Finance Corp.
Notes to Consolidated Financial Statements - Continued
The tables below present quantitative information about the significant unobservable inputs of the Company’s Level 3 investments as of the following periods. The weighted average range of unobservable inputs is based on fair value of investments. The tables are not intended to be all-inclusive but instead capture the significant unobservable inputs relevant to the Company’s determination of fair value.
| December 31, 2025 | |||||||||||||||||||||||||||||
| ($ in thousands) | Fair Value | Valuation Technique | Unobservable Input | Range (Weighted Average) | Impact to Valuation from an Increase in Input | ||||||||||||||||||||||||
First-lien senior secured debt investments | $ | Recent Transaction | Transaction Price | Increase | |||||||||||||||||||||||||
| Yield Analysis | Market Yield | Decrease | |||||||||||||||||||||||||||
| Collateral Analysis | Recovery Rate | Increase | |||||||||||||||||||||||||||
| Second-lien senior secured debt investments | $ | Yield Analysis | Market Yield | Decrease | |||||||||||||||||||||||||
| Unsecured debt investments | $ | Yield Analysis | Market Yield | Decrease | |||||||||||||||||||||||||
| Market Approach | Revenue Multiple | Increase | |||||||||||||||||||||||||||
| Specialty finance debt investments | $ | Yield Analysis | Market Yield | Decrease | |||||||||||||||||||||||||
| Preferred equity investments | $ | Recent Transaction | Transaction Price | Increase | |||||||||||||||||||||||||
| Yield Analysis | Market Yield | Decrease | |||||||||||||||||||||||||||
| Market Approach | Revenue Multiple | Increase | |||||||||||||||||||||||||||
| Common equity investments | $ | Recent Transaction | Transaction Price | Increase | |||||||||||||||||||||||||
| Yield Analysis | Market Yield | Decrease | |||||||||||||||||||||||||||
| Market Approach | EBITDA Multiple | Increase | |||||||||||||||||||||||||||
| Market Approach | Market Adjustment Factor | Decrease | |||||||||||||||||||||||||||
| Market Approach | Gross Profit Multiple | Increase | |||||||||||||||||||||||||||
| Market Approach | Revenue Multiple | Increase | |||||||||||||||||||||||||||
| Option Pricing Model | Volatility | Increase | |||||||||||||||||||||||||||
| Specialty finance equity investments | $ | Market Approach | AUM Multiple | Increase | |||||||||||||||||||||||||
| Market Approach | N/A(1) | N/A | N/A | ||||||||||||||||||||||||||
| Yield Analysis | Market Yield | Decrease | |||||||||||||||||||||||||||
| Discounted Cash Flow Analysis | Discounted Factor | Decrease | |||||||||||||||||||||||||||
(1)Fair value based on a weighting of the appraised value of the portfolio company’s underlying assets and their cost.
F-82
Blue Owl Technology Finance Corp.
Notes to Consolidated Financial Statements - Continued
| December 31, 2024 | |||||||||||||||||||||||||||||
| ($ in thousands) | Fair Value | Valuation Technique | Unobservable Input | Range (Weighted Average) | Impact to Valuation from an Increase in Input | ||||||||||||||||||||||||
| First-lien senior secured debt investments | $ | Yield Analysis | Market Yield | Decrease | |||||||||||||||||||||||||
| Recent Transaction | Transaction Price | Increase | |||||||||||||||||||||||||||
| Collateral Analysis | Recovery Rate | Increase | |||||||||||||||||||||||||||
| Second-lien senior secured debt investments | $ | Yield Analysis | Market Yield | Decrease | |||||||||||||||||||||||||
| Unsecured debt investments | $ | Yield Analysis | Market Yield | Decrease | |||||||||||||||||||||||||
| Market Approach | Revenue Multiple | Increase | |||||||||||||||||||||||||||
| Specialty finance debt investments | $ | Yield Analysis | Market Yield | Decrease | |||||||||||||||||||||||||
| Preferred equity investments | $ | Yield Analysis | Market Yield | Decrease | |||||||||||||||||||||||||
| Market Approach | Revenue Multiple | Increase | |||||||||||||||||||||||||||
| Recent Transaction | Transaction Price | Increase | |||||||||||||||||||||||||||
| Common equity investments | $ | Market Approach | Revenue Multiple | Increase | |||||||||||||||||||||||||
| Market Approach | EBITDA Multiple | Increase | |||||||||||||||||||||||||||
| Option Pricing Model | Volatility | Increase | |||||||||||||||||||||||||||
| Market Approach | Gross Profit Multiple | Increase | |||||||||||||||||||||||||||
| Recent Transaction | Transaction Price | Increase | |||||||||||||||||||||||||||
| Yield Analysis | Market Yield | Decrease | |||||||||||||||||||||||||||
| Specialty finance equity investments | $ | Market Approach | AUM Multiple | Increase | |||||||||||||||||||||||||
| Market Approach | N/A(1) | N/A | N/A | ||||||||||||||||||||||||||
| Yield Analysis | Market Yield | Decrease | |||||||||||||||||||||||||||
| Discounted Cash Flow Analysis | Discounted Factor | Decrease | |||||||||||||||||||||||||||
(1)Fair value based on a weighting of the appraised value of the portfolio company’s underlying assets and their cost.
The Adviser, as valuation designee, typically determines the fair value of its performing Level 3 debt investments utilizing a yield analysis. In a yield analysis, a price is ascribed for each investment based upon an assessment of current and expected market yields for similar investments and risk profiles. Additional consideration is given to the expected life, portfolio company performance since close, and other terms and risks associated with an investment. Among other factors, a determinant of risk is the amount of leverage used by the portfolio company relative to its total enterprise value, and the rights and remedies of the Company’s investment within the portfolio company’s capital structure.
When the debtor is not performing or when there is insufficient value to cover the investment, the Company may utilize a net recovery approach to determine the fair value of debt investments in subject companies. A net recovery analysis typically consists of two steps. First, the total enterprise value for the subject company is estimated using standard valuation approaches, most commonly the market approach. Second, the fair value for each investment in the subject company is then estimated by allocating the subject company’s total enterprise value to the outstanding securities in the capital structure based upon various factors, including seniority, preferences, and other features if deemed relevant to each security in the capital structure.
F-83
Blue Owl Technology Finance Corp.
Notes to Consolidated Financial Statements - Continued
Significant unobservable quantitative inputs typically used in the fair value measurement of the Company’s Level 3 debt investments primarily include current market yields, including relevant market indices, but may also include quotes from brokers, dealers, and pricing services as indicated by comparable investments. For the Company’s Level 3 equity investments, a market approach, based on comparable financial performance multiples such as publicly-traded company and comparable market transaction multiples of revenues, earnings before interest, taxes, depreciation and amortization (“EBITDA”) or some combination thereof and comparable market transactions are typically used.
Debt Not Carried at Fair Value
Fair value is estimated by discounting remaining payments using applicable current market rates, which take into account changes in the Company’s marketplace credit ratings, or market quotes, if available. The table below presents the carrying and fair values of the Company’s debt obligations as of the following periods:
| December 31, 2025 | December 31, 2024 | ||||||||||||||||||||||||||||||||||
| ($ in thousands) | Net Carrying Value | Unamortized Debt Issuance Costs (Premium) | Fair Value | Net Carrying Value | Unamortized Debt Issuance Costs (Premium) | Fair Value | |||||||||||||||||||||||||||||
| Revolving Credit Facility | $ | $ | $ | $ | $ | $ | |||||||||||||||||||||||||||||
| SPV Asset Facility I | |||||||||||||||||||||||||||||||||||
| SPV Asset Facility II | |||||||||||||||||||||||||||||||||||
| SPV Asset Facility III | |||||||||||||||||||||||||||||||||||
| SPV Asset Facility IV | |||||||||||||||||||||||||||||||||||
| CLO 2020-1 | |||||||||||||||||||||||||||||||||||
| Athena CLO II | |||||||||||||||||||||||||||||||||||
| Athena CLO IV | |||||||||||||||||||||||||||||||||||
| Athena CLO V | |||||||||||||||||||||||||||||||||||
| June 2025 Notes | |||||||||||||||||||||||||||||||||||
| December 2025 Notes | ( | ||||||||||||||||||||||||||||||||||
| June 2026 Notes | |||||||||||||||||||||||||||||||||||
| January 2027 Notes | |||||||||||||||||||||||||||||||||||
| March 2028 Notes | |||||||||||||||||||||||||||||||||||
| September 2028 Notes | |||||||||||||||||||||||||||||||||||
| April 2029 Notes | |||||||||||||||||||||||||||||||||||
| Total Debt | $ | $ | $ | $ | $ | $ | |||||||||||||||||||||||||||||
The table below presents fair value measurements of the Company’s debt obligations as of the following periods:
| ($ in thousands) | December 31, 2025 | December 31, 2024 | |||||||||
| Level 1 | $ | $ | |||||||||
| Level 2 | |||||||||||
| Level 3 | |||||||||||
| Total Debt | $ | $ | |||||||||
Financial Instruments Not Carried at Fair Value
As of December 31, 2025 and December 31, 2024, the carrying amounts of the Company’s other assets and liabilities approximate fair value due to their short maturities. These financial instruments would be categorized as Level 3 within the hierarchy.
F-84
Blue Owl Technology Finance Corp.
Notes to Consolidated Financial Statements - Continued
Note 7. Derivative Instruments
The Company enters into derivative instruments from time to time to help mitigate its foreign currency and interest rate risk exposures. See “Note 6 — Fair Value of Investments” for additional disclosures related to the fair value hierarchy for derivative instruments.
The table below presents the fair value and notional value of the derivative assets and liabilities for the following period:
| As of December 31, 2025 | ||||||||||||||||||||
| Notional Amount | Assets | Liabilities | ||||||||||||||||||
| Derivatives designated as hedges | ||||||||||||||||||||
| Interest rate swaps April 2029 Notes | $ | $ | $ | |||||||||||||||||
| Interest rate swaps March 2028 Notes | $ | |||||||||||||||||||
Total derivatives designated as hedges(1)(2) | $ | $ | ||||||||||||||||||
| Derivatives not designated as hedges | ||||||||||||||||||||
| Foreign currency forward contract GBP | £ | $ | $ | ( | ||||||||||||||||
| Foreign currency forward contract EUR | € | ( | ||||||||||||||||||
| Foreign currency forward contract AUD | A$ | ( | ||||||||||||||||||
| Total derivatives not designated as hedges | $ | $ | ( | |||||||||||||||||
(1)The net fair value of the derivatives designated as hedges is recorded as an asset or liability in the Consolidated Statements of Assets and Liabilities.
The Company did not hold interest rate swaps or foreign currency forward contracts as of December 31, 2024.
The tables below present net unrealized gains and losses on effective interest rate swaps and hedged items included in interest expense for the following periods:
| For the Year Ended December 31, 2025 | ||||||||||||||||||||
| Change in Unrealized Gain (Loss) on: | ||||||||||||||||||||
| Interest Rate Swaps | Hedged Items | Net | ||||||||||||||||||
| Derivatives designated as hedges | ||||||||||||||||||||
Interest rate swaps April 2029 Notes | $ | $ | ( | $ | ( | |||||||||||||||
| Interest rate swaps March 2028 Notes | ( | ( | ||||||||||||||||||
Net change in unrealized gain (loss) on interest rate swaps and hedged items(1) | $ | ( | ||||||||||||||||||
The Company did not hold any interest rate swaps for the year ended December 31, 2024.
F-85
Blue Owl Technology Finance Corp.
Notes to Consolidated Financial Statements - Continued
The table below presents net realized and unrealized gains and losses on derivative instruments not designated as a qualifying hedge accounting relationship recognized by the Company for the following periods:
| For the Year Ended December 31, 2025 | |||||||||||||||||||||||
| Net Change in Unrealized Gain (Loss) | Net Realized Gain (Loss) | Net | |||||||||||||||||||||
| Derivatives not designated as hedges | |||||||||||||||||||||||
| Foreign currency forward contract GBP | $ | ( | $ | $ | ( | ||||||||||||||||||
| Foreign currency forward contract EUR | ( | ( | ( | ||||||||||||||||||||
| Foreign currency forward contract AUD | ( | ( | |||||||||||||||||||||
Total net unrealized and realized gain (loss)(1) | $ | ( | |||||||||||||||||||||
The Company did not hold any foreign currency forward contracts for the year ended December 31, 2024.
Note 8. Commitments and Contingencies
Portfolio Company Commitments
From time to time, the Company may enter into commitments to fund investments in the form of revolving credit, delayed draw, or equity commitments, which require the Company to provide funding when requested by portfolio companies in accordance with underlying loan agreements. The Company had the following outstanding commitments as of the following periods:
As of | ||||||||||||||
| ($ in thousands) | December 31, 2025 | December 31, 2024 | ||||||||||||
| Total unfunded revolving loan commitments | $ | $ | ||||||||||||
| Total unfunded delayed draw loan commitments | $ | $ | ||||||||||||
| Total unfunded debt commitments | $ | $ | ||||||||||||
| Total unfunded specialty finance equity commitments | $ | $ | ||||||||||||
| Total unfunded common equity commitments | $ | $ | ||||||||||||
| Total unfunded equity commitments | $ | $ | ||||||||||||
| Total unfunded commitments | $ | $ | ||||||||||||
As of December 31, 2025, the Company believed they had adequate financial resources to cover outstanding unfunded portfolio company commitments.
Other Commitments and Contingencies
On May 27, 2025, the Board approved the 2025 Stock Repurchase Program (the “2025 Stock Repurchase Program”) under which we may repurchase up to $200 million of our outstanding common stock. Under the 2025 Stock Repurchase Program, purchases were made at management's discretion from time to time in open-market transactions, in accordance with applicable securities laws and regulations. Unless extended by the Board, the 2025 Stock Repurchase Program will terminate 18-months from the date of the Exchange Listing. As of December 31, 2025, 5,192,408 shares of the Company’s common stock have been repurchased pursuant to the 2025 Stock Repurchase Program for approximately $73.4 million since the 2025 Stock Repurchase Program’s inception. All shares purchased by us pursuant to 2025 Stock Repurchase Program have been retired and are authorized and unissued shares.
From time to time, the Company may become a party to certain legal proceedings incidental to the normal course of its business. As of December 31, 2025, management was not aware of any pending or threatened litigation.
F-86
Blue Owl Technology Finance Corp.
Notes to Consolidated Financial Statements - Continued
Note 9. Net Assets
Equity Issuances
The Company has the authority to issue 1,000,000,000 common shares at $0.01 per share par value.
Distributions
The table below reflects the distributions declared on shares of the Company’s common stock during the following periods:
For the Year Ended December 31, 2025 | ||||||||||||||||||||
| Date Declared | Record Date | Payment Date | Distribution per Share | |||||||||||||||||
| November 5, 2025 | December 31, 2025 | January 15, 2026 | $ | |||||||||||||||||
| August 5, 2025 | September 30, 2025 | October 15, 2025 | $ | |||||||||||||||||
| June 2, 2025 (supplemental dividend) | September 21, 2026 | October 6, 2026 | $ | |||||||||||||||||
| June 2, 2025 (supplemental dividend) | June 22, 2026 | July 7, 2026 | $ | |||||||||||||||||
| June 2, 2025 (supplemental dividend) | March 23, 2026 | April 7, 2026 | $ | |||||||||||||||||
| June 2, 2025 (supplemental dividend) | December 23, 2025 | January 7, 2026 | $ | |||||||||||||||||
| June 2, 2025 (supplemental dividend) | September 22, 2025 | October 7, 2025 | $ | |||||||||||||||||
| June 2, 2025 | June 30, 2025 | July 15, 2025 | $ | |||||||||||||||||
| March 14, 2025 | March 17, 2025 | March 18, 2025 | $ | |||||||||||||||||
For the Year Ended December 31, 2024 | ||||||||||||||||||||
| Date Declared | Record Date | Payment Date | Distribution per Share | |||||||||||||||||
| October 1, 2024 | December 31, 2024 | January 31, 2025 | $ | |||||||||||||||||
| August 6, 2024 | September 30, 2024 | November 15, 2024 | $ | |||||||||||||||||
| May 7, 2024 | June 28, 2024 | August 15, 2024 | $ | |||||||||||||||||
February 21, 2024(1) | March 29, 2024 | May 15, 2024 | $ | |||||||||||||||||
(1)Expected to be paid or was partially paid from sources other than ordinary income, including long-term capital gains.
For the Year Ended December 31, 2023 | ||||||||||||||||||||
| Date Declared | Record Date | Payment Date | Distribution per Share | |||||||||||||||||
| November 7, 2023 | December 29, 2023 | January 31, 2024 | $ | |||||||||||||||||
| August 8, 2023 | September 29, 2023 | November 15, 2023 | $ | |||||||||||||||||
| May 9, 2023 | June 30, 2023 | August 15, 2023 | $ | |||||||||||||||||
February 21, 2023(1) | March 31, 2023 | May 15, 2023 | $ | |||||||||||||||||
(1)Expected to be paid or was partially paid from sources other than ordinary income, including long-term capital gains.
Dividend Reinvestment
With respect to distributions, the Company has adopted an “opt out” dividend reinvestment plan for common shareholders. As a result, in the event of a declared distribution, each shareholder that has not “opted out” of the dividend reinvestment plan will have their dividends or distributions automatically reinvested in additional shares of the Company’s common stock rather than receiving cash distributions. Prior to the Exchange Listing, the number of shares to be issued to a shareholder under the dividend reinvestment plan was determined by dividing the total dollar amount of the distribution payable to such shareholder by the net asset value per share of the Company's common stock, as of the last day of the Company's calendar quarter immediately preceding the date such distribution was declared. In connection with the Exchange Listing, the Company entered into an amended and restated dividend reinvestment plan, pursuant to which, if newly issued shares are used to implement the dividend reinvestment plan, the number of shares to be issued to a shareholder will be determined by dividing the total dollar amount of the cash dividend or distribution payable to a shareholder by the market price per share of the Company's common stock at the close of regular trading on the NYSE on the payment date of a distribution, or if no sale is reported for such day, the average of the reported bid and ask prices. However, if the market price per share on the payment date of a cash dividend or distribution exceeds the most recently computed net asset value per share, the Company will issue shares at the greater of (i) the most recently computed net asset value per share and (ii) 95% of the current market price per share (or such lesser discount to the current market price per share that still exceeded the most recently
F-87
Blue Owl Technology Finance Corp.
Notes to Consolidated Financial Statements - Continued
computed net asset value per share). If shares are purchased in the open market to implement the dividend reinvestment plan, the number of shares to be issued to a shareholder shall be determined by dividing the dollar amount of the cash dividend payable to such shareholder by the weighted average price per share for all shares purchased by the plan administrator in the open market in connection with the dividend. Shareholders who receive distributions in the form of shares of common stock will be subject to the same U.S. federal, state and local tax consequences as if they received cash distributions.
The table below reflects the common stock issued pursuant to the dividend reinvestment plan during the following periods:
For the Year Ended December 31, 2025 | ||||||||||||||||||||
| Date Declared | Record Date | Payment Date | Shares | |||||||||||||||||
| August 5, 2025 | September 30, 2025 | October 15, 2025 | ||||||||||||||||||
| June 2, 2025 (supplemental dividend) | September 22, 2025 | October 7, 2025 | ||||||||||||||||||
| June 2, 2025 | June 30, 2025 | July 15, 2025 | ||||||||||||||||||
| March 14, 2025 | March 17, 2025 | March 18, 2025 | ||||||||||||||||||
| October 1, 2024 | December 31, 2024 | January 31, 2025 | ||||||||||||||||||
For the Year Ended December 31, 2024 | ||||||||||||||||||||
| Date Declared | Record Date | Payment Date | Shares | |||||||||||||||||
| August 6, 2024 | September 30, 2024 | November 15, 2024 | ||||||||||||||||||
| May 7, 2024 | June 28, 2024 | August 15, 2024 | ||||||||||||||||||
| February 21, 2024 | March 29, 2024 | May 15, 2024 | ||||||||||||||||||
| November 7, 2023 | December 29, 2023 | January 31, 2024 | ||||||||||||||||||
For the Year Ended December 31, 2023 | ||||||||||||||||||||
| Date Declared | Record Date | Payment Date | Shares | |||||||||||||||||
| August 8, 2023 | September 29, 2023 | November 15, 2023 | ||||||||||||||||||
| May 9, 2023 | June 30, 2023 | August 15, 2023 | ||||||||||||||||||
| February 21, 2023 | March 31, 2023 | May 15, 2023 | ||||||||||||||||||
| November 1, 2022 | December 31, 2022 | January 31, 2023 | ||||||||||||||||||
2025 Stock Repurchase Program
On May 27, 2025, the Board approved the 2025 Stock Repurchase Program under which the Company may repurchase up to $200 million of its outstanding common stock. Under the 2025 Stock Repurchase Program, purchases were made at management's discretion from time to time in open-market transactions, in accordance with applicable securities laws and regulations. Unless extended by the Board, the 2025 Stock Repurchase Program will terminate 18 -months from the date of the Exchange Listing. For the year ended December 31, 2025, repurchases under the 2025 Stock Repurchase Program were as follows:
| Period ($ in thousands, except share and per share amounts) | Total Number of Shares Repurchased | Average Price Paid per Share | Approximate Dollar Value of Shares that have been Purchased Under the Plans | Approximate Dollar Value of Shares that May Yet Be Purchased Under the Plan | ||||||||||||||||||||||
| September 1, 2025 - September 30, 2025 | $ | $ | $ | |||||||||||||||||||||||
| October 1, 2025 - October 31, 2025 | $ | $ | $ | |||||||||||||||||||||||
| November 1, 2025 - November 30, 2025 | $ | $ | $ | |||||||||||||||||||||||
| December 1, 2025 - December 31, 2025 | $ | $ | $ | |||||||||||||||||||||||
| Total | $ | |||||||||||||||||||||||||
F-88
Blue Owl Technology Finance Corp.
Notes to Consolidated Financial Statements - Continued
Note 10. Earnings Per Share
The table below sets forth the computation of basic and diluted earnings (loss) per common share for the following periods:
| For the Years Ended December 31, | |||||||||||||||||
| ($ in thousands, except per share amounts) | 2025 | 2024 | 2023(1) | ||||||||||||||
| Increase (decrease) in net assets resulting from operations | $ | $ | $ | ||||||||||||||
| Weighted average shares of common stock outstanding—basic and diluted | |||||||||||||||||
| Earnings (loss) per common share-basic and diluted | $ | $ | $ | ||||||||||||||
Note 11. Income Taxes
Taxable income generally differs from increase in net assets resulting from operations due to temporary and permanent differences in the recognition of income and expenses, and generally excludes net unrealized gains or losses, as unrealized gains or losses are generally not included in taxable income until they are realized.
The Company makes certain adjustments to the classification of net assets as a result of permanent book-to-tax differences, which include differences in the book and tax basis of certain assets and liabilities and nondeductible federal taxes or losses among other items. To the extent these differences are permanent, they are charged or credited to additional paid in capital, or total distributable earnings (losses), as appropriate.
Depending on the level of taxable income earned in a tax year, the Company can be expected to carry forward taxable income (including net capital gains, if any) in excess of current year dividend distributions from the current tax year into the next tax year and pay a nondeductible 4% U.S. federal excise tax on such taxable income, as required. To the extent that the Company determines that its estimated current year annual taxable income will be in excess of estimated current year dividend distributions from such income, the Company will accrue excise tax on estimated excess taxable income.
The following reconciles the increase (decrease) in net assets resulting from operations for the years ended December 31, 2025, 2024, and 2023:
For the Year Ended December 31, | |||||||||||||||||
| ($ in thousands) | 2025(1) | 2024 | 2023 | ||||||||||||||
| Increase (decrease) in net assets resulting from operations | $ | $ | $ | ||||||||||||||
| Adjustments: | |||||||||||||||||
| Net unrealized (gain) loss | ( | ( | |||||||||||||||
| Deferred organization costs | ( | ||||||||||||||||
| Federal and state income tax | |||||||||||||||||
| Other book-tax differences | ( | ( | |||||||||||||||
| Taxable Income | $ | $ | $ | ||||||||||||||
For the year ended December 31, 2025
Total distributions declared of $607.7 million resulted in a taxable dividend amount of $607.7 million that consisted of $607.7 million of ordinary income for the year ending December 31, 2025. For the calendar year ended December 31, 2025, the Company had $306.6 million net unrealized gains on investments and assets and liabilities in foreign currencies, and $(34.2 ) million of other temporary differences. For the calendar year ended December 31, 2025, the Company had $159.4 million of undistributed ordinary income and $31.4 million of undistributed long term capital gains. For the year ended December 31, 2025, 85.8 % of distributed ordinary income qualified as interest related dividend which is exempt from U.S. withholding tax applicable to non-U.S. shareholders.
For the year ended December 31, 2025, the Company increased the total distributable earnings (losses) and decreased additional paid in capital. These permanent differences of $79.7 million were principally related to temporary differences acquired from the Merger of $73.8 million as well as $7.5 million attributable to U.S. federal excise taxes.
As of December 31, 2025, the net estimated unrealized gain on investments for U.S. federal income tax purposes was $335.5 million based on a tax cost basis of $14.0 billion. As of December 31, 2025, the estimated aggregate gross unrealized loss for U.S. federal income tax purposes was $101.7 million and the estimated aggregate gross unrealized gain for U.S. federal income tax purposes was $437.2 million.
F-89
Blue Owl Technology Finance Corp.
Notes to Consolidated Financial Statements - Continued
For the year ended December 31, 2024
Total distributions declared during the year ended December 31, 2024 of $307.0 million consisted of approximately $282.1 million of ordinary income and $24.9 million of long-term capital gains, as determined on a tax basis. For the calendar year ended December 31, 2024, the Company had $293.9 million of undistributed ordinary income, $18.3 million of capital loss carryforwards, as well as $(6.4 ) million net unrealized gains on investments and assets and liabilities in foreign currencies, and $1.6 million of other temporary differences. For the year ended December 31, 2024, 83.2 % of distributed ordinary income qualified as interest related dividend which is exempt from U.S. withholding tax applicable to non-U.S. shareholders.
For the year ended December 31, 2024, the Company increased the total distributable earnings (losses) and decreased additional paid in capital. These permanent differences were principally related to $11.5 million of U.S. federal excise taxes.
As of December 31, 2024, the net estimated unrealized loss on investments for U.S. federal income tax purposes was $15.8 million based on a tax cost basis of $6.4 million. As of December 31, 2024, the estimated aggregate gross unrealized loss for U.S. federal income tax purposes was $203.8 million and the estimated aggregate gross unrealized gain for U.S. federal income tax purposes was $188.0 million.
For the year ended December 31, 2023
Total distributions declared during the year ended December 31, 2023 of $300.3 million were consisted of approximately $252.7 million ordinary income and $47.6 million of long-term capital gains, as determined on a tax basis. For the calendar year ended December 31, 2023, the Company had $236.2 million of undistributed ordinary income, $47.6 million of undistributed capital gains, as well as $(10.1 ) million net unrealized gains on investments and assets and liabilities in foreign currencies, and $(3.8 ) million of other temporary differences. For the year ended December 31, 2023, 82.5 % of distributed ordinary income qualified as interest related dividend which is exempt from U.S. withholding tax applicable to non-U.S. shareholders.
During the year ended December 31, 2023, the Company increased the total distributable earnings (losses) and decreased additional paid in capital. These permanent differences were principally related to $9.1 million of U.S. federal excise taxes.
As of December 31, 2023, the net estimated unrealized loss on investments for U.S. federal income tax purposes was $25.4 million based on a tax cost basis of $6.2 million. As of December 31, 2023, the estimated aggregate gross unrealized loss for U.S. federal income tax purposes was $160.4 million and the estimated aggregate gross unrealized gain for U.S. federal income tax purposes was $135.0 million.
Taxable Subsidiaries
Certain of the Company’s consolidated subsidiaries are subject to U.S. federal and state corporate-level income taxes. For the year ended December 31, 2025 and 2024 the Company recorded U.S. federal and state income tax expense/(benefit) of $(51 ) thousand and (6 ) thousand, respectively.
F-90
Blue Owl Technology Finance Corp.
Notes to Consolidated Financial Statements - Continued
Note 12. Financial Highlights
The table below presents the financial highlights for a common share outstanding during the following periods. The financial highlights for the years ended December 31, 2020, December 31, 2019, and December 31, 2018 were derived from the Company's consolidated financial statements that were audited by the Company's former independent registered public accounting firm.
| For the Years Ended December 31, | |||||||||||||||||||||||||||||||||||||||||||||||
| ($ in thousands, except share and per share amounts) | 2025 | 2024 | 2023 | 2022 | 2021 | 2020 | 2019 | 2018 | |||||||||||||||||||||||||||||||||||||||
| Per share data: | |||||||||||||||||||||||||||||||||||||||||||||||
| Net asset value, beginning of period | $ | $ | $ | $ | $ | $ | $ | $ | |||||||||||||||||||||||||||||||||||||||
Net investment income (loss)(1) | ( | ||||||||||||||||||||||||||||||||||||||||||||||
Net realized and unrealized gain (loss)(1) | ( | ( | ( | ( | ( | ||||||||||||||||||||||||||||||||||||||||||
| Total from operations | ( | ||||||||||||||||||||||||||||||||||||||||||||||
Repurchase of common shares(7) | |||||||||||||||||||||||||||||||||||||||||||||||
Issuance of common shares in connection with the Mergers(2) | ( | ||||||||||||||||||||||||||||||||||||||||||||||
Distributions declared from earnings(7) | ( | ( | ( | ( | ( | ( | ( | ||||||||||||||||||||||||||||||||||||||||
| Total increase (decrease) in net assets | ( | ||||||||||||||||||||||||||||||||||||||||||||||
| Net asset value, end of period | $ | $ | $ | $ | $ | $ | $ | $ | |||||||||||||||||||||||||||||||||||||||
| Shares outstanding, end of period | |||||||||||||||||||||||||||||||||||||||||||||||
Per share market value at end of period | $ | N/A | N/A | N/A | N/A | N/A | N/A | N/A | |||||||||||||||||||||||||||||||||||||||
Total Return, based on net market value(3) | ( | % | N/A | N/A | N/A | N/A | N/A | N/A | N/A | ||||||||||||||||||||||||||||||||||||||
Total Return, based on net asset value(4) | % | % | % | % | % | % | % | ( | % | ||||||||||||||||||||||||||||||||||||||
| Ratios / Supplemental Data | |||||||||||||||||||||||||||||||||||||||||||||||
Ratio of total expenses to average net assets(5)(6) | % | % | % | % | % | % | % | % | |||||||||||||||||||||||||||||||||||||||
Ratio of net investment income to average net assets(5) | % | % | % | % | % | % | % | ( | % | ||||||||||||||||||||||||||||||||||||||
| Net assets, end of period | $ | $ | $ | $ | $ | $ | $ | $ | |||||||||||||||||||||||||||||||||||||||
| Weighted-average shares outstanding | |||||||||||||||||||||||||||||||||||||||||||||||
| Total capital commitments, end of period | N/A | $ | $ | $ | $ | $ | $ | $ | |||||||||||||||||||||||||||||||||||||||
| Ratio of total contributed capital to total committed capital, end of period | N/A | % | % | % | % | % | % | % | |||||||||||||||||||||||||||||||||||||||
| Portfolio turnover rate | % | % | % | % | % | % | % | % | |||||||||||||||||||||||||||||||||||||||
| Year of formation | 2018 | 2018 | 2018 | 2018 | 2018 | 2018 | 2018 | 2018 | |||||||||||||||||||||||||||||||||||||||
(1)The per share data was derived using the weighted average shares outstanding during the period.
(2)The amount shown at this caption is the balancing amount derived from the other figures in the schedule. The amount shown at this caption for a share outstanding throughout the period may not agree with the issuance of common stock because of the timing of sales of the Company’s shares.
(3)Total return based on market value is calculated as the change in market value per share during the respective periods, taking into account dividends and distributions, if any, reinvested in accordance with the Company’s dividend reinvestment plan. The beginning market value per share is based on the listing price of $17.15 per share on the listing date of June 12, 2025. Total return is not annualized.
(4)Total return is calculated as the change in net asset value (“NAV”) per share during the period, plus distributions per share (assuming dividends and distributions, if any, are reinvested in accordance with the Company’s dividend reinvestment plan), if any, divided by the beginning NAV per share. Total return is not annualized.
(5)The ratio reflects an annualized amount, except in the case of non-recurring expenses (e.g. initial organization expenses).
(6)Prior to any management fee waivers, the annualized total expenses to average net assets for the period ended December 31, 2025 was 8.9 %.
(7)The per share data was derived using actual shares outstanding at the date of the relevant transaction.
Note 13. Merger with Blue Owl Technology Finance Corp. II
On March 24, 2025, the Company completed its previously announced acquisition of OTF II. In accordance with the Merger Agreement, at the effective time of the Mergers, each outstanding share of OTF II common stock was converted into the right to receive 0.9113 shares of common stock, par value $0.01 per share of the Company (with OTF II stockholders receiving cash in lieu of fractional shares of the Company’s common stock). As a result of the Mergers, the Company issued an aggregate of approximately 250,738,523 shares of its common stock to former OTF II stockholders prior to any adjustment for OTF II stockholders receiving cash in lieu of fractional shares.
The Mergers were accounted for as an asset acquisition in accordance with ASC 805-50, Business Combinations — Related Issues. The consideration paid to OTF II’s shareholders was more than the aggregate fair values of the assets acquired and liabilities assumed, which resulted in a purchase premium (the “purchase premium”). The purchase premium was allocated to the cost of OTF II investments acquired by the Company on a pro-rata basis based on their relative fair values as of the closing date. Immediately following the Mergers, the investments were marked to their respective fair values and, as a result, the purchase premium allocated to the cost basis of the investments acquired was immediately recognized as unrealized depreciation on the Consolidated Statement of
F-91
Blue Owl Technology Finance Corp.
Notes to Consolidated Financial Statements - Continued
Operations. The purchase premium allocated to the loan investments acquired will amortize over the life of each respective loan through interest expense with a corresponding adjustment recorded as unrealized appreciation on such loans acquired through their ultimate disposition. The purchase premium allocated to equity investments acquired will not amortize over the life of such investments through interest expense and, assuming no subsequent change to the fair value of the equity investments acquired and disposition of such equity investments at fair value, the Company will recognize a realized loss with a corresponding reversal of the unrealized depreciation on disposition of such equity investments acquired.
The Mergers were considered a tax-free reorganization and the Company has elected to carry forward the historical cost basis of the OTF II investments for tax purposes.
Pursuant to the Merger Agreement, the Adviser agreed to reimburse each of the Company and OTF II 50 % of all fees and expenses incurred and payable by OTF II or on its behalf, on the one hand, or the Company or on its behalf, on the other hand, in connection with or related to the Mergers or the Merger Agreement up to an aggregate amount equal to $4.75 million. Net of merger transaction costs borne by the Adviser, the Company capitalized $4.5 million of merger transaction costs as part of the total consideration paid to acquire the assets and liabilities of OTF II.
The following table summarizes the allocation of the purchase price to the assets acquired and liabilities assumed as a result of the Mergers:
($ in thousands) | ||||||||
Common stock issued by the Company(1) | $ | |||||||
Transaction costs, net(2) | ||||||||
| Total purchase price | $ | |||||||
| Assets acquired: | ||||||||
Investments, at fair value (amortized cost of $ | $ | |||||||
| Cash and cash equivalents | ||||||||
| Interest receivable | ||||||||
| Other assets | ||||||||
| Total assets acquired | $ | |||||||
| Liabilities assumed: | ||||||||
Debt (net of deferred financing costs of $ | $ | |||||||
Other liabilities(3) | ||||||||
| Total liabilities assumed | ||||||||
| Net assets acquired | ||||||||
| Total purchase premium/(discount) | $ | |||||||
(1)Based on the NAV per share at closing of $17.06 and the 250,738,523 common shares issued by the Company in conjunction with the Mergers.
(2)Pursuant to the Merger Agreement, the Adviser agreed to reimburse each of the Company and OTF II 50 % of all fees and expenses incurred and payable in connection with or related to the Mergers or the Merger Agreement up to an aggregate amount equal to $4.75 million. Net of merger transaction costs borne by the Adviser, the Company capitalized $4.5 million of merger transaction costs as part of the total consideration paid to acquire the assets and liabilities of OTF II.
(3)Includes $11.8 million of management fees and $10.7 million of incentive fees accrued by OTF II through the closing date of the Mergers pursuant to an investment advisory agreement between OTF II and its investment adviser, which was terminated upon the closing of the Mergers. The payable for these fees was assumed by the Company.
Note 14. Subsequent Events
The Company’s management evaluated subsequent events through the date of issuance of these consolidated financial statements and determined there are no subsequent events to disclose except for the following:
January 2031 Notes
On January 23, 2026, the Company issued $400.0 million aggregate principal amount of 6.125 % notes due 2031. In connection with the issuance of the January 2031 Notes, on January 20, 2026 we entered into a bilateral interest rate swap. The notional amount of
F-92
Blue Owl Technology Finance Corp.
Notes to Consolidated Financial Statements - Continued
the interest rate swap is $400.0 million. We will receive fixed rate interest at 6.125 % and pay variable rate interest based on SOFR plus 2.495 %. The interest rate swap matures on January 23, 2031.
Dividend
On February 18, 2026, the Board approved a first quarter dividend of $0.35 per share for stockholders of record as of March 31, 2026, payable on or before April 15, 2026.
2026 Stock Repurchase Program
On February 17, 2026, the Board approved a repurchase program (the “2026 Stock Repurchase Program”) under which we may repurchase up to $300 million of our common stock. Under the 2026 Repurchase Program, purchases may be made at management’s discretion from time to time in open-market transactions, including pursuant to trading plans with investment banks pursuant to Rule 10b5-1 of the Exchange Act, in accordance with all applicable rules and regulations. Unless extended by the Board, the 2026 Stock Repurchase Program will terminate 18-month s from the date it was approved. Upon entering into the 2026 Stock Repurchase Program, the 2025 Stock Repurchase Program will terminate.
F-93
Item 9. Changes in and Disagreements with Accountants on Accounting and Financial Disclosure
None.
Item 9A. Controls and Procedures.
(a)Evaluation of Disclosure Controls and Procedures
In accordance with Rules 13a-15(b) and 15d-15(b) of the Securities Exchange Act of 1934, as amended (the “Exchange Act”), we, under the supervision and with the participation of our Chief Executive Officer and Chief Financial Officer, carried out an evaluation of the effectiveness of our disclosure controls and procedures (as defined in Rule 13a-15(e) and Rule 15d-15(e) of the Exchange Act) as of the end of the period covered by this Annual Report and determined that our disclosure controls and procedures are effective as of the end of the period covered by the Annual Report.
(b)Management’s Report on Internal Controls Over Financial Reporting
Our management is responsible for establishing and maintaining adequate internal control over financial reporting (as defined in Rules 13a-15(f) and 15d-15(f) of the Exchange Act). Under the supervision and with the participation of management, including the Chief Executive Officer and Chief Financial Officer, we conducted an evaluation of the effectiveness of our internal control over financial reporting based on the criteria established in Internal Control—Integrated Framework (2013) issued by the Committee of Sponsoring Organizations of the Treadway Commission (2013 COSO Framework). Based on our evaluation under the framework in Internal Control—Integrated Framework (2013), management concluded that our internal control over financial reporting was effective as of December 31, 2025.
Because of its inherent limitations, internal control over financial reporting may not prevent or detect misstatements. Also, projections of any evaluation of effectiveness to future periods are subject to the risk that controls may become inadequate because of changes in conditions, or that the degree of compliance with the policies or procedures may deteriorate.
(c) Attestation Report of the Independent Registered Public Accounting Firm
Our independent registered public accounting firm, KPMG LLP, has issued an audit report on the effectiveness of our internal control over financial reporting, which is set forth under the heading “Report of Independent Registered Public Accounting Firm” on page F-2.
(d) Changes in Internal Controls Over Financial Reporting
There have been no changes in our internal control over financial reporting that occurred during the quarter ended December 31, 2025 that have materially affected, or are reasonably likely to materially affect, our internal control over financial reporting.
Item 9B. Other Information.
Rule 10b5-1 Trading Plans
During the fiscal year ended December 31, 2025, none of the Company’s directors or executive officers adopted terminated
Item 9C. Disclosure Regarding Foreign Jurisdictions that Prevent Inspections
Not applicable.
129
PART III
Item 10. Directors, Executive Officers and Corporate Governance.
Our Board of Directors
As of December 31, 2025, our Board consisted of six members. The Board is divided into three classes, with the members of each class serving staggered, three-year terms. The terms of our Class I directors will expire at the 2028 annual meeting of shareholders; the terms of our Class II directors will expire at the 2026 annual meeting of shareholders; and the terms of our Class III directors will expire at the 2027 annual meeting of shareholders.
Biographical Information
Brief biographies of the members of the Board are set forth below. Also included below following each biography is a brief discussion of the specific experience, qualifications, attributes or skills that led our Board to conclude that the applicable director should serve on our Board at this time. In addition, set forth further below is a biography of each of our executive officers who is not a director.
Name, Address, and Age(1) | Position(s) Held with the Company | Principal Occupation(s) During the Past 5 Years | Term of Office and Length of Time Served(2) | Number of Companies in Fund Complex(3) Overseen by Director | Other Directorships Held by Director or Nominee for Director | |||||||||||||||||||||||||||
| Independent Directors | ||||||||||||||||||||||||||||||||
Eric Kaye, 62 | Director | Founder and Chief Executive Officer of Kayezen, LLC (formerly ARQ^EX Fitness Systems) | Class II Director since 2018; Term expires in 2026 | 5 | OBDC OBDC II OCIC OTIC | |||||||||||||||||||||||||||
Victor Woolridge, 69 | Director | Managing Director of Barings Real Estate Advisers LLC | Class II Director since 2021; Term expires in 2026 | 5 | OBDC OBDC II OCIC OTIC | |||||||||||||||||||||||||||
Christopher M. Temple, 58 | Director | President of DelTex Capital LLC | Class III Director since 2018; Term expires in 2027 | 5 | OBDC OBDC II OCIC OTIC | |||||||||||||||||||||||||||
Melissa Weiler, 61 | Director | Private Investor | Class III Director since 2021; Term expires in 2027 | 5 | OBDC OBDC II OCIC OTIC Jefferies Financial Group Inc. | |||||||||||||||||||||||||||
Edward D'Alelio, 73 | Chairman of the Board and Director | Retired | Class I Director since 2018; Term expires in 2028 | 5 | OBDC OBDC II OCIC OTIC | |||||||||||||||||||||||||||
| Interested Directors(4) | ||||||||||||||||||||||||||||||||
Craig W. Packer, 59 | Chief Executive Officer and Director | Co-Founder of Owl Rock Capital Partners Co-President of Blue Owl Co-Chief Investment Officer of each of the Blue Owl Credit Advisers Chief Executive Officer of the Blue Owl BDCs | Class I Director since 2018; Term expires in 2028 | 5 | OBDC OBDC II OCIC OTIC Blue Owl Capital Inc. | |||||||||||||||||||||||||||
130
____________________
(1)The address for each director is c/o Blue Owl Technology Finance Corp., 399 Park Avenue, 37th Floor, New York, New York 10022.
(2)Directors serve for three-year terms until the next annual meeting of shareholders and until their successors are duly elected and qualified.
(3)The term “Fund Complex” refers to the Blue Owl BDCs. Directors and officers who oversee the funds in the Fund Complex are noted.
(4)“Interested person” of the Company as defined in Section 2(a)(19) of the Investment Company Act of 1940 (the “1940 Act”). Mr. Packer is an “interested person” because of his affiliation with the Adviser.
Independent Directors
Mr. Kaye is the Chief Executive Officer and founder of Kayezen, LLC, a physical therapy and fitness equipment design company. Prior to founding Kayezen, LLC, Mr. Kaye served as a Vice Chairman and Managing Director of UBS Investment Bank, and a member of the division’s Global Operating and U.S. Executive Committees, from June 2001 to May 2012. For the majority of Mr. Kaye’s tenure with UBS, he was a Managing Director and led the firm’s Exclusive Sales and Divestitures Group, where he focused on advising middle-market companies. Prior to joining UBS, Mr. Kaye had served as Global Co-Head of Mergers & Acquisitions for Robertson Stephens, an investment banking firm, from February 1998 to June 2001. Mr. Kaye joined Robertson Stephens from PaineWebber where he served as Executive Director and head of the firm’s Technology Mergers & Acquisitions team. Since March 2016 and November 2016 he has served on the boards of directors of OBDC and OBDC II, respectively, since August 2018 he has served on the board of directors of the Company, since September 2020 he has served on the board of directors of OCIC and since August 2021 he has served on the board of directors of OTIC. Mr. Kaye previously served on the board of directors of Blue Owl Capital Corporation III (“OBDE”) from February 2020 until January 2025 and on the board of directors of OTF II from November 2021 until March 2025. Mr. Kaye holds a B.A. from Union College and an M.B.A. from Columbia Business School.
We believe Mr. Kaye’s management positions and experiences in the middle market provide the Board with valuable insight.
Mr. Temple has served as President of DelTex Capital LLC (a private investment firm) since its founding in 2010. Prior to forming DelTex Capital, Mr. Temple served as President of Vulcan Capital, the investment arm of Vulcan Inc., from May 2009 until December 2009 and as Vice President of Vulcan Capital from September 2008 to May 2009. Prior to joining Vulcan in September 2008, Mr. Temple served as a managing director at Tailwind Capital, LLC from May to August 2008. Prior to joining Tailwind, Mr. Temple was a managing director at Friend Skoler & Co., Inc. from May 2005 to May 2008. From April 1996 to December 2004, Mr. Temple was a managing director at Thayer Capital Partners. Mr. Temple started his career in the audit and tax departments of KPMG’s Houston office and was a licensed CPA from 1989 to 1993. Mr. Temple served on the board of directors of Plains GP Holdings, L.P., the general partner of Plains All American Pipeline Company from November 2016 through May 2024 and served as a member of the Plains GP Holdings, L.P. compensation committee from November 2020 through May 2024. Mr. Temple also served as a director of Plains All American Pipeline, L.P.’s (“PAA”) general partner from May 2009 to November 2016. He was a member of the PAA Audit Committee from 2009 to 2016. Prior public board service includes board and audit committee service for Clear Channel Outdoor Holdings from April 2011 to May 2016 and on the board and audit committee of Charter Communications Inc. from November 2009 through January 2011. In addition to public boards, Mr. Temple has served on private boards including Brawler Industries, National HME, Loenbro, Inc and HMT, LLC and as Operating Executive/Senior Advisor for Tailwind Capital, LLC, a New York-based middle-market private equity firm. Since March 2016 and November 2016 he has served on the boards of directors of OBDC and OBDC II, respectively, since August 2018 he has served on the board of directors of the Company, since September 2020 he has served on the board of directors of OCIC and since August 2021 he has served on the board of directors of OTIC. Mr. Temple previously served on the board of directors of OBDE from February 2020 until January 2025 and on the board of directors of OTF II from November 2021 until March 2025. Mr. Temple holds a B.B.A., magna cum laude, from the University of Texas and an M.B.A. from Harvard.
We believe Mr. Temple’s broad investment management background, together with his financial and accounting knowledge, brings important and valuable skills to the Board.
Mr. D’Alelio was formerly a Managing Director and CIO for Fixed Income at Putnam Investments, Boston, where he served from 1989 until he retired in 2002. While at Putnam, he served on the Investment Policy Committee, which was responsible for oversight of all investments. He also sat on various Committees including attribution and portfolio performance. Prior to joining Putnam, he was a portfolio manager at Keystone Investments and prior to that, he was an Investment Analyst at The Hartford Ins. Co. Since 2002, Mr. D'Alelio has served as an Executive in Residence at the University of Mass., Boston—School of Management. He is also President of the UMass Foundation. He serves on the Advisory Committees of Ceres Farms. Since September 2009, Mr. D'Alelio has served as director of Vermont Farmstead Cheese. Mr. D'Alelio served on the board of Blackstone Senior Floating Rate 2027 Term Fund from April 2010 until February 2025, Blackstone Long Short Credit Income Fund from November 2010 until February 2025 and Blackstone Strategic Credit 2027 Term Fund from May 2021 until February 2025. Since March 2016 and November 2016 he has served on the boards of directors of OBDC and OBDC II, respectively, since August 2018 he has served on the board of directors of the Company, since September 2020 he has served on the board of directors of OCIC and since August 2021 he has served on the board of directors of OTIC. Mr. D’Alelio previously served on the board of directors of OBDE from February 2020 until January 2025
131
and on the board of directors of OTF II from November 2021 until March 2025. Mr. D’Alelio’s previous corporate board assignments include Archibald Candy, Doane Pet Care, Trump Entertainment Resorts and UMass Memorial Hospital. Mr. D’Alelio is a graduate of the Univ. of Mass Boston and has an M.B.A. from Boston University.
We believe Mr. D’Alelio’s numerous management positions and broad experiences in the financial services sector provide him with skills and valuable insight in handling complex financial transactions and issues, all of which make him well qualified to serve on the Board.
Ms. Weiler was formerly a Managing Director and a member of the Management Committee of Crescent Capital Group, a Los Angeles-based asset management firm (“Crescent”), where she served from January 2011 until she retired in December 2020. During that time, Ms. Weiler was responsible for the oversight of Crescent’s CLO management business from July 2017 through December 2020, and managed several multi-strategy credit funds from January 2011 through June 2017. During her tenure at Crescent, she also served on the Risk Management and Diversity & Inclusion committees. From October 1995 to December 2010, Ms. Weiler was a Managing Director at Trust Company of the West, a Los Angeles-based asset management firm (“TCW”). At TCW, she managed several multi-strategy credit funds from July 2006 to December 2010, and served as lead portfolio manager for TCW’s high-yield bond strategy from October 1995 to June 2006. Ms. Weiler has served on the board of directors of Jefferies Financial Group Inc. since July 2021. She is a member of the Cedars-Sinai Board of Governors and is actively involved in 100 Women in Finance. Ms. Weiler joined the boards of directors of the Company, OBDC, OBDC II and OCIC in February 2021 and the board of directors of OTIC in August 2021. Ms. Weiler previously served on the board of directors of OBDE from February 2021 until January 2025 and on the board of directors of OTF II from November 2021 until March 2025. Ms. Weiler holds a B.S. in Economics from the Wharton School at the University of Pennsylvania.
We believe Ms. Weiler’s broad investment management background, together with her financial and accounting knowledge, brings important and valuable skills to the Board.
Mr. Woolridge was formerly a Managing Director of Barings Real Estate Advisers, LLC (“Barings”), the real estate investment unit of Barings LLC, a global asset management firm. Mr. Woolridge most recently served as Head of the U.S. Capital Markets for Equity Real Estate Funds at Barings. Mr. Woolridge previously served as Vice President and Managing Director and Head of Debt Capital Markets - Equities of Cornerstone Real Estate Advisers LLC (prior to its rebranding under the Barings name) (“Cornerstone”) from January 2013 to September 2016 and as Vice President Special Servicing from January 2010 to January 2013. Prior to joining Cornerstone, Mr. Woolridge served as a Managing Director of Babson Capital Management LLC (“Babson”) from January 2000 to January 2010. Prior to joining Babson, Mr. Woolridge served as Director of Loan Originations and Assistant Regional Director of MassMutual Financial Group from September 1982 to January 2000. Since 2009, Mr. Woolridge has served on the University of Massachusetts (UMass) Board of Trustees and has previously served as Chairman of the Board and as Chairman of the Board’s Committee on Administration and Finance. Mr. Woolridge has served as trustee for University of Massachusetts Global since 2021. Since 2022, Mr. Woolridge has served as a director of Trumbull Property Income Fund and Fallon Health. Mr. Woolridge has also served on the UMass Foundation’s investment committee since 2021. Mr. Woolridge serves as Board Committee Chair and President of Springfield Riverfront Development Corporation – Basketball Hall of Fame. Mr. Woolridge previously served on the Board of Trustees of Baystate Health from 2005 to 2016, which included service as Chairman of the Board and on the Board’s compensation, finance, governance and strategy committees. Mr. Woolridge joined the boards of directors of the Company, OBDC, OBDC II, OCIC and OTIC in November 2021. Mr. Woolridge previously served on the board of directors of OBDE from February 2021 until January 2025 and on the board of directors of OTF II from November 2021 until March 2025. Mr. Woolridge holds a B.S. from the University of Massachusetts at Amherst and is a Certified Commercial Investment Member.
We believe Mr. Woolridge’s numerous management positions and broad experiences in the asset management and financial
services sectors provide him with skills and valuable insight in handling complex financial transactions and issues, all of which makes
him well qualified to serve on the Board.
Interested Director
Mr. Packer is the Chief Executive Officer of each of the Blue Owl BDCs and is a member of the Diversified Lending Investment Committee and the Technology Lending Investment Committee of the Blue Owl Credit Advisers. Additionally, Mr. Packer is a Co-President and a director of Blue Owl. Mr. Packer is also the Head of the Credit platform and serves as a Co-Chief Investment Officer for each of the Blue Owl Credit Advisers. Previously, Mr. Packer co-founded Owl Rock Capital Partners (“Owl Rock”), the predecessor firm to Blue Owl’s Credit platform. In addition, since March 2016 and November 2016 Mr. Packer has served on the boards of directors of OBDC and OBDC II, respectively, since August 2018 he has served on the board of directors of the Company, since September 2020 he has served on the board of directors of OCIC and since August 2021 he has served on the board of directors of OTIC. Mr. Packer previously served on the board of directors of OBDE from February 2020 until January 2025 and on the board of directors of OTF II from November 2021 until March 2025. Mr. Packer also served as President of OBDE since its inception until January 2024 and as President of the Company, OBDC, OBDC II, OCIC, OTF II and OTIC since each of their inceptions until August 2024. Prior to co-founding Owl Rock, Mr. Packer was a Partner and Co-Head of Leveraged Finance in the Americas at Goldman, Sachs & Co. Mr. Packer joined Goldman, Sachs & Co. as a Managing Director and Head of High Yield Capital Markets in 2006 and
132
was named partner in 2008. Prior to joining Goldman Sachs & Co., Mr. Packer was the Global Head of High Yield Capital Markets at Credit Suisse First Boston, and before that he worked at Donaldson, Lufkin & Jenrette. Mr. Packer serves as Treasurer of the Board of Trustees of Greenwich Academy and Co-Chair of the Honorary Board of Kids in Crisis, a nonprofit organization that serves children in Connecticut. Mr. Packer is also on the Advisory Board for the Mount Sinai Department of Rehabilitation and Human Performance and serves as a Board Member of Wingspire Capital LLC. In addition, Mr. Packer is on the Foundation Board of Trustees for the McIntire School of Commerce, University of Virginia and is a member of the Board of Trustees of the University of Virginia Athletics Foundation. Mr. Packer earned an M.B.A. from Harvard Business School and a B.S. from the University of Virginia.
We believe Mr. Packer’s depth of experience in corporate finance, capital markets and financial services gives the Board valuable industry-specific knowledge and expertise on these and other matters, and his history with us and the Adviser provides an important skill set and knowledge base to the Board.
Meetings and Attendance
The Board met fifteen times during 2025 and acted on various occasions by written consent. All directors then in office attended at least 75% of the aggregate number of meetings of the Board held during the period for which they were a director and of the respective committees on which they served during 2025.
Board Attendance at the Annual Meeting
Our policy is to encourage our directors to attend each annual meeting; however, such attendance is not required at this time. Three members of the Board attended our 2025 annual meeting of shareholders.
Board Leadership Structure and Role in Risk Oversight
Overall responsibility for our oversight rests with the Board. We have entered into the Investment Advisory Agreement pursuant to which the Adviser will manage the Company on a day-to-day basis. The Board is responsible for overseeing the Adviser and our other service providers in accordance with the provisions of the 1940 Act, applicable provisions of state and other laws and our charter. The Board is composed of six members, five of whom are directors who are not “interested persons” of the Company or the Adviser as defined in the 1940 Act. The Board meets in person at regularly scheduled quarterly meetings each year. In addition, the Board may hold special in-person or telephonic meetings or informal conference calls to discuss specific matters that may arise or require action between regular meetings. As described below, the Board has established a Nominating and Corporate Governance Committee, an Audit Committee, a Compensation Committee and a Co-Investment Committee, and may establish ad hoc committees or working groups from time to time, to assist the Board in fulfilling its oversight responsibilities. The Board has appointed Edward D’Alelio, an independent director, to serve in the role of Chairman of the Board. The Chairman’s role is to preside at all meetings of the Board and to act as a liaison with the Adviser, counsel and other directors generally between meetings. The Chairman serves as a key point person for dealings between management and the directors. The Chairman also may perform such other functions as may be delegated by the Board from time to time. The Board reviews matters related to its leadership structure annually. The Board has determined that the Board’s leadership structure is appropriate because it allows the Board to exercise informed and independent judgment over the matters under its purview and it allocates areas of responsibility among committees of directors and the full Board in a manner that enhances effective oversight.
We are subject to a number of risks, including investment, compliance, operational and valuation risks, among others. Risk oversight forms part of the Board’s general oversight of the Company and is addressed as part of various Board and committee activities. Day-to-day risk management functions are subsumed within the responsibilities of the Adviser and other service providers (depending on the nature of the risk), which carry out our investment management and business affairs. The Adviser and other service providers employ a variety of processes, procedures and controls to identify various events or circumstances that give rise to risks, to lessen the probability of their occurrence and to mitigate the effects of such events or circumstances if they do occur. Each of the Adviser and other service providers has their own independent interest in risk management, and their policies and methods of risk management will depend on their functions and business models. The Board recognizes that it is not possible to identify all of the risks that may affect the Company or to develop processes and controls to eliminate or mitigate their occurrence or effects. As part of its regular oversight of the Company, the Board interacts with and reviews reports from, among others, the Adviser, our chief compliance officer, our independent registered public accounting firm and counsel, as appropriate, regarding risks faced by the Company and applicable risk controls. The Board may, at any time and in its discretion, change the manner in which it conducts risk oversight.
Communications with Directors
Shareholders and other interested parties may contact any member (or all members) of the Board by mail. To communicate with the Board, any individual directors or any group or committee of directors, correspondence should be addressed to the Board or any such individual directors or group or committee of directors by either name or title. All such correspondence should be sent to Blue Owl Technology Finance Corp., 399 Park Avenue, 37th Floor, New York, New York 10022, Attention: Secretary.
133
Committees of the Board
The Board has an Audit Committee, a Nominating and Corporate Governance Committee, a Compensation Committee and a Co-Investment Committee, and may form additional committees in the future. A brief description of each committee is included in this Form 10-K and the charters of the Audit, Nominating and Corporate Governance, and Compensation Committees can be accessed on the Company’s website at www.blueowltechnologyfinance.com.
As of December 31, 2025, the members of each of the Board’s committees were as follows (the names of the respective committee chairperson are bolded):
| Audit Committee | Nominating and Corporate Governance Committee | Compensation Committee | Co-Investment Committee | ||||||||
| Edward D'Alelio | Edward D'Alelio | Edward D'Alelio | Edward D'Alelio | ||||||||
| Christopher M. Temple | Christopher M. Temple | Christopher M. Temple | Christopher M. Temple | ||||||||
| Eric Kaye | Eric Kaye | Eric Kaye | Eric Kaye | ||||||||
| Melissa Weiler | Melissa Weiler | Melissa Weiler | Melissa Weiler | ||||||||
| Victor Woolridge | Victor Woolridge | Victor Woolridge | Victor Woolridge | ||||||||
Audit Committee Governance, Responsibilities and Meetings
In accordance with its written charter adopted by the Board, the Audit Committee:
(a)assists the Board’s oversight of the integrity of our financial statements, the independent registered public accounting firm’s qualifications and independence, our compliance with legal and regulatory requirements and the performance of our independent registered public accounting firm;
(b)prepares an Audit Committee report, if required by the SEC, to be included in our annual proxy statement;
(c)oversees the scope of the annual audit of our financial statements, the quality and objectivity of our financial statements, accounting and financial reporting policies and internal controls;
(d)determines the selection, appointment, retention and termination of our independent registered public accounting firm, as well as approving the compensation thereof;
(e)pre-approves all audit and non-audit services provided to us and certain other persons by such independent registered public accounting firm; and
(f)acts as a liaison between our independent registered public accounting firm and the Board.
The Audit Committee had nine formal meetings in 2025.
Our Board has determined that Christopher M. Temple, an independent director, qualifies as an “audit committee financial expert” as defined in Item 407 of Regulation S-K under the Exchange Act, and otherwise satisfies the sophistication requirements of NYSE Rule 303A.07.
Each member of the Audit Committee simultaneously serves on the audit committees of three or more public companies, and the Board has determined that each member’s simultaneous service on the audit committees of other public companies does not impair such member’s ability to effectively serve on the Audit Committee.
Nominating and Corporate Governance Committee Governance, Responsibilities and Meetings
In accordance with its written charter adopted by the Board, the Nominating and Corporate Governance Committee:
(a)recommends to the Board persons to be nominated by the Board for election at the Company’s meetings of our shareholders, special or annual, if any, or to fill any vacancy on the Board that may arise between shareholder meetings;
(b)makes recommendations with regard to the tenure of the directors;
(c)is responsible for overseeing an annual evaluation of the Board and its committee structure to determine whether the structure is operating effectively; and
(d)recommends to the Board the compensation to be paid to the independent directors of the Board.
The Nominating and Corporate Governance Committee will consider for nomination to the Board candidates submitted by our shareholders or from other sources it deems appropriate.
The Nominating and Corporate Governance Committee had two formal meetings in 2025.
134
Director Nominations
Nomination for election as a director may be made by, or at the direction of, the Nominating and Corporate Governance Committee or by shareholders in compliance with the procedures set forth in our bylaws.
Shareholder proposals or director nominations to be presented at the annual meeting of shareholders, other than shareholder proposals submitted pursuant to the SEC’s Rule 14a-8, must be submitted in accordance with the advance notice procedures and other requirements set forth in our bylaws. These requirements are separate from the requirements discussed above to have the shareholder nomination or other proposal included in our proxy statement and form of proxy/voting instruction card pursuant to the SEC’s rules.
Our bylaws require that the proposal or recommendation for nomination must be delivered to, or mailed and received at, the principal executive offices of the Company not earlier than the 150th day prior to the one year anniversary of the date the Company’s proxy statement for the preceding year’s annual meeting, or later than the 120th day prior to the first anniversary of the date of the proxy statement for the preceding year’s annual meeting. If the date of the annual meeting has changed by more than 30 days from the first anniversary of the date of the preceding year’s annual meeting, shareholder proposals or director nominations must be so received not earlier than the 150th day prior to the date of such annual meeting and not later than the 120th day prior to the date of such annual meeting or the tenth day following the day on which public announcement of the date of such meeting is first made.
In evaluating director nominees, the Nominating and Corporate Governance Committee considers, among others, the following factors:
•whether the individual possesses high standards of character and integrity, relevant experience, a willingness to ask hard questions and the ability to work well with others;
•whether the individual is free of conflicts of interest that would violate applicable law or regulation or interfere with the proper performance of the responsibilities of a director;
•whether the individual is willing and able to devote sufficient time to the affairs of the Company and be diligent in fulfilling the responsibilities of a director and Board Committee member;
•whether the individual has the capacity and desire to represent the balanced, best interests of the shareholder as a whole and not a special interest group or constituency; and
•whether the individual possesses the skills, experiences (such as current business experience or other such current involvement in public service, academia or scientific communities), particular areas of expertise, particular backgrounds, and other characteristics that will help ensure the effectiveness of the Board and Board committees.
The Nominating and Corporate Governance Committee’s goal is to assemble a board that brings to the Company a variety of perspectives and skills derived from high-quality business and professional experience.
Other than the foregoing, there are no stated minimum criteria for director nominees, although the Nominating and Corporate Governance Committee may also consider other factors as they may deem are in the best interests of the Company and its shareholders. The Board also believes it appropriate for certain key members of our management to participate as members of the Board.
The Nominating and Corporate Governance Committee identifies nominees by first evaluating the current members of the Board willing to continue in service. Current members of the Board with skills and experience that are relevant to our business and who are willing to continue in service are considered for re-nomination. If any member of the Board does not wish to continue in service or if the Nominating and Corporate Governance Committee decides not to re-nominate a member for re-election, the Nominating and Corporate Governance Committee identify the desired skills and experience of a new nominee in light of the criteria above. The members of the Board are polled for suggestions as to individuals meeting the aforementioned criteria. Research may also be performed to identify qualified individuals. To date, we have not engaged third parties to identify or evaluate or assist in identifying potential nominees, although we reserve the right in the future to retain a third-party search firm, if necessary.
The Board has not adopted a formal policy with regard to the consideration of diversity in identifying director nominees. In determining whether to recommend a director nominee, the Nominating and Corporate Governance Committee considers and discusses diversity, among other factors, with a view toward the needs of the Board as a whole. The Board generally conceptualizes diversity expansively to include, without limitation, concepts such as race, gender, national origin, differences of viewpoint, professional experience, education, skill and other qualities that contribute to the Board, when identifying and recommending director nominees. The Board believes that the inclusion of diversity as one of many factors considered in selecting director nominees is consistent with the Board’s goal of creating a Board that best serves the needs of the Company and the interests of its shareholders.
Compensation Committee Governance, Responsibilities and Meetings
In accordance with its written charter adopted by the Board, the Compensation Committee:
(a)determines, or recommends to the Board for determination, the compensation, if any, of our chief executive officer and all other executive officers;
135
(b)assists the Board with matters related to compensation generally, except with respect to the compensation of the directors; and
(c)may delegate its authority to subcommittees or the Chair of the Compensation Committee when it deems appropriate and in the best interests of the Company.
As none of our executive officers are currently compensated by us, the Compensation Committee will not produce and/or review a report on executive compensation practices. The Compensation Committee was formed in May 2025 and did not meet in 2025.
Co-Investment Committee Governance, Responsibilities and Meetings
The Co-Investment Committee is responsible for reviewing and making certain findings in respect of co-investment transactions pursuant to the exemptive relief that has been granted by the SEC to the Adviser and its affiliates to co-invest with other funds managed by the Adviser or its affiliates in a manner consistent with our investment objective, positions, policies, strategies and restrictions as well as regulatory requirements and other pertinent factors. The Co-Investment Committee was formed on February 18, 2025 and had three formal meetings in 2025.
Compensation Committee Interlocks and Insider Participation
No member of the Compensation Committee is a current or former officer of the Company. No member of the Compensation Committee (i) has had any relationship with the Company requiring disclosure under Item 404 of Regulation S-K under the Exchange Act, or (ii) is an executive officer of another entity, at which one of our executive officers serves on the Board.
Section 16(a) Beneficial Ownership Reporting Compliance
Pursuant to Section 16(a) of the Exchange Act, the Company’s directors and executive officers, and any persons holding more than 10% of its shares, are required to report their beneficial ownership and any changes therein to the SEC and the Company. Specific due dates for those reports have been established, and the Company is required to report herein any failure to file such reports by those due dates. Based on the Company’s review of Forms 3, 4, and 5 filed by such persons and information provided by the Company’s directors and officers, the Company believes that during the fiscal year ended December 31, 2025, all Section 16(a) filing requirements applicable to such persons were timely filed except for one Form 4 filing for Erik Bissonnette that was filed late due to an administrative error.
Code of Business Conduct
We have adopted a Code of Business Conduct which applies to our executive officers, including our principal executive officer and principal financial officer, as well as every officer, director and employee of the Company. Our Code of Business Conduct can be accessed on our website at www.blueowltechnologyfinance.com.
There have been no material changes to our corporate code of ethics or material waivers of the code that apply to our Chief Executive Officer or Chief Financial Officer. If we make any substantive amendment to, or grant a waiver from, a provision of our Code of Business Conduct, we will promptly disclose the nature of the amendment or waiver on our website at www.blueowltechnologyfinance.com or file a Form 8-K with the Securities and Exchange Commission.
We have also adopted an insider trading policy which applies to our executive officers, including our principal executive officer and principal financial officer, as well as every officer, director and employee of the Company. This policy is filed as Exhibit 19.1 to this Annual Report.
Information about Executive Officers Who Are Not Directors
The following sets forth certain information regarding the executive officers of the Company who are not directors of the Company:
| Name | Age | Position | Officer Since | |||||||||||||||||
Erik Bissonnette | 46 | President | 2024 | |||||||||||||||||
| Karen Hager | 53 | Chief Compliance Officer | 2018 | |||||||||||||||||
| Neena Reddy | 48 | Vice President and Secretary | 2019 | |||||||||||||||||
| Jonathan Lamm | 51 | Chief Financial Officer and Chief Operating Officer | 2021 | |||||||||||||||||
| Matthew Swatt | 37 | Co-Chief Accounting Officer, Co-Treasurer, and Co-Controller | 2021 | |||||||||||||||||
| Shari Withem | 43 | Co-Chief Accounting Officer, Co-Treasurer, and Co-Controller | 2021 | |||||||||||||||||
The address for each of our executive officers is c/o Blue Owl Technology Finance Corp., 399 Park Avenue, 37th Floor, New York, New York 10022.
136
Ms. Hager is the Global Chief Compliance Officer and a Senior Managing Director of Blue Owl, a member of Blue Owl’s Management Committee and Operating Committee and serves as the Chief Compliance Officer of each of the Blue Owl Credit Advisers and the Blue Owl BDCs. Prior to joining Owl Rock, the predecessor firm to Blue Owl’s Credit platform, in March 2018, Ms. Hager was Chief Compliance Officer at Abbott Capital Management. Previous to Abbott, Ms. Hager worked as SVP, Director of Global Compliance and Chief Compliance Officer at The Permal Group, and as Director of Compliance at Dominick & Dominick Advisors LLC. Prior to joining Dominick & Dominick Advisors LLC, Ms. Hager was a Senior Securities Compliance Examiner/Staff Accountant at the US Securities and Exchange Commission. Ms. Hager received a B.S. in Accounting from Brooklyn College of the City University of New York.
Mr. Bissonnette is a Senior Managing Director of Blue Owl, a member of the Direct Lending Investment Team, Co-Head of Technology Investing for Blue Owl, and a member of the Adviser’s Technology Lending Investment Committee. Mr. Bissonnette is also President of the Company and OTIC, and Portfolio Manager for certain funds in Blue Owl’s Technology Lending strategy, including the Company and OTIC. Prior to joining Owl Rock, the predecessor firm to Blue Owl’s Credit platform, in 2018, Mr. Bissonnette was a Managing Director and Head of Technology Leveraged Finance at Capital Source from 2009 to 2017. Preceding Capital Source, Mr. Bissonnette was an Associate at ABS Capital Partners from 2007 to 2009. Prior to that, Mr. Bissonnette was an Associate at Wachovia Securities for four years, and Analyst at Bank of America Securities from 2001 to 2003. Mr. Bissonnette received a B.A. in Economics with a double major in English from Wake Forest University.
Ms. Reddy is a Vice President and Secretary of each of the Blue Owl BDCs and Chief Legal Officer of each of the Blue Owl Credit Advisers. Ms. Reddy also serves as the General Counsel, Chief Legal Officer and Secretary of Blue Owl, and as a member of Blue Owl’s Operating Committee. Prior to joining Owl Rock, the predecessor firm to Blue Owl’s Credit platform, Ms. Reddy was associate general counsel at Goldman, Sachs & Co LLC, from June 2010 to April 2019 and was dedicated to Goldman Sachs Asset Management L.P. (“GSAM”), where she was responsible for GSAM managed direct alternative products, including private credit. Prior to GSAM, Ms. Reddy practiced as a corporate attorney at Boies Schiller & Flexner LLP and at Debevoise & Plimpton LLP. Ms. Reddy joined the Board of Directors for Partnership for New York City, representing Blue Owl, in 2024. Prior to becoming an attorney, Ms. Reddy was a financial analyst in the private wealth division at Goldman, Sachs & Co. Ms. Reddy received a J.D. from New York University School of Law and a B.A. in English, magna cum laude, from Georgetown University.
Mr. Lamm is Chief Financial Officer and Chief Operating Officer of each of the Blue Owl BDCs. Mr. Lamm is also a Senior Managing Director of Blue Owl. Prior to joining Owl Rock, the predecessor firm to Blue Owl’s Credit platform, in April 2021, Mr. Lamm served as the Chief Financial Officer and Treasurer of Goldman Sachs BDC, Inc. (“GSBD”), a business development company traded on the New York Stock Exchange. Mr. Lamm was responsible for building and overseeing GSBD’s finance, treasury, accounting and operations functions from April 2013 through March 2021, including during its initial public offering in March 2015. During his time at Goldman Sachs, Mr. Lamm also served as Chief Financial Officer and Treasurer of Goldman Sachs Private Middle Market Credit LLC, Goldman Sachs Private Middle Market Credit II LLC and Goldman Sachs Middle Market Lending Corp. prior to the completion of its merger with GSBD in October 2020. Throughout his twenty-two years at Goldman Sachs, Mr. Lamm held various positions. From 2013 to 2021, Mr. Lamm served as Managing Director, Chief Operating Officer and Chief Financial Officer at GSAM Credit Alternatives. From 2007 to 2013, Mr. Lamm served as Vice President, Chief Operating Officer and Chief Financial Officer at GSAM Credit Alternatives. From 2005 to 2007, Mr. Lamm served as Vice President in the Financial Reporting group and, from 1999 to 2005, he served as a Product Controller. Prior to joining Goldman Sachs, Mr. Lamm worked in public accounting at Deloitte & Touche.
Mr. Swatt is the Co-Chief Accounting Officer, Co-Treasurer and Co-Controller of each of the Blue Owl BDCs. Mr. Swatt is also a Managing Director of Blue Owl. Prior to joining Owl Rock, the predecessor firm to Blue Owl’s Credit platform, in May 2016, Mr. Swatt was an Assistant Controller at Guggenheim Partners in their Private Credit group, where he was responsible for the finance, accounting, and financial reporting functions. Preceding that role, Mr. Swatt worked within the Financial Services -- Alternative Investments practice of PwC where he specialized in financial reporting, fair valuation of illiquid investments and structured products, internal controls and other technical accounting matters pertaining to alternative investment advisors, hedge funds, business development companies and private equity funds. Mr. Swatt received a B.S. in Accounting from the University of Maryland and is a licensed Certified Public Accountant in New York.
Ms. Withem is the Co-Chief Accounting Officer, Co-Treasurer and Co-Controller of each of the Blue Owl BDCs. Ms. Withem is also a Managing Director of Blue Owl. Prior to joining Owl Rock, the predecessor firm to Blue Owl’s Credit platform, in March 2018, Ms. Withem was Vice President of Sixth Street Specialty Lending, Inc., a business development company traded on the NYSE, where she was responsible for accounting, financial reporting, treasury and internal controls functions. Preceding that role, Ms. Withem worked for MCG Capital Corporation, a business development company formerly traded on the Nasdaq and Deloitte in the Audit and Assurance Practice. Ms. Withem received a B.S. in Accounting from James Madison University and is a licensed Certified Public Accountant in Virginia.
137
Portfolio Managers
The management of our investment portfolio is the responsibility of the Adviser and the Technology Lending Investment Committee. The Investment Team is led by Douglas I. Ostrover, Marc S. Lipschultz and Craig W. Packer and is supported by certain members of the Adviser’s senior executive team and Blue Owl’s Credit platform’s direct lending investment committees. Blue Owl’s four direct lending investment committees focus on a specific investment strategy (Diversified Lending, Technology Lending, First Lien Lending and Opportunistic Lending). Douglas I. Ostrover, Marc S. Lipschultz, Craig W. Packer and Alexis Maged sit on each of Blue Owl’s direct lending investment committees. In addition to Messrs. Ostrover, Lipschultz, Packer and Maged, the Technology Lending Investment Committee is comprised of Erik Bissonnette, Pravin Vazirani, Jon ten Oever and Arthur Martini. We consider the individuals on the Technology Lending Investment Committee to be our portfolio managers. The Investment Team, under the Technology Lending Investment Committee’s supervision, sources investment opportunities, conducts research, performs due diligence on potential investments, structures our investments and monitors our portfolio companies on an ongoing basis. The Technology Lending Investment Committee meets regularly to consider our investments, direct our strategic initiatives and supervise the actions taken by the Adviser on our behalf. In addition, the Technology Lending Investment Committee reviews and determines whether to make prospective investments (including approving parameters or guidelines pursuant to which certain investments may be made or sold consistent with our investment objective) and monitors the performance of the investment portfolio. Each investment opportunity requires the approval of a majority of the Technology Lending Investment Committee. Follow-on investments in existing portfolio companies may require the Technology Lending Investment Committee’s approval beyond that obtained when the initial investment in the portfolio company was made. In addition, temporary investments, such as those in cash equivalents, U.S. government securities and other high quality debt investments that mature in one year or less, may require approval by the Technology Lending Investment Committee. The compensation packages of the Technology Lending Investment Committee members from the Adviser include various combinations of discretionary bonuses and variable incentive compensation based primarily on performance for services provided and may include shares of Blue Owl.
None of the Adviser’s investment professionals receive any direct compensation from us in connection with the management of our portfolio. Certain members of the Technology Lending Investment Committee, through their financial interests in the Adviser, are entitled to a portion of the profits earned by the Adviser, which includes any fees payable to the Adviser under the terms of the Investment Advisory Agreement, less expenses incurred by the Adviser in performing its services under the Investment Advisory Agreement.
The members of the Technology Lending Investment Committee perform a similar role for OTIC and certain members of the Technology Lending Investment Committee also perform a similar role for OBDC, OBDC II and OCIC, from which the Adviser and its affiliates may receive incentive fees. See “ITEM 1. BUSINESS – Affiliated Transactions” for a description of the Blue Owl Credit Advisers’ allocation policy governing allocations of investments among us and other investment vehicles with similar or overlapping strategies, as well as a description of certain other relationships between us and the Adviser. See “ITEM 1A. RISK FACTORS – Risks Related to Our Adviser and Its Affiliates – Our Adviser and its affiliates may face conflicts of interest with respect to services performed for their respective other accounts and clients or issuers in which we may invest” for a discussion of potential conflicts of interests.
The members of the Technology Lending Investment Committee function as portfolio managers with the most significant responsibility for the day-to-day management of our portfolio. Information regarding the Technology Lending Investment Committee, is as follows:
| Name | Year of Birth | |||||||
| Douglas I. Ostrover | 1962 | |||||||
| Marc S. Lipschultz | 1969 | |||||||
| Craig W. Packer | 1966 | |||||||
| Alexis Maged | 1965 | |||||||
| Erik Bissonnette | 1979 | |||||||
| Pravin Vazirani | 1973 | |||||||
| Jon ten Oever | 1972 | |||||||
Arthur Martini | 1973 | |||||||
In addition to managing our investments, our portfolio managers also manage other registered investment companies and BDCs, other pooled investment vehicles and other accounts, as indicated below. The following table identifies, as of December 31, 2025: (i) the number of registered investment companies and BDCs (including us), other pooled investment vehicles and other
138
accounts managed by each portfolio manager; (ii) the total assets of such companies, vehicles and accounts; and (iii) the number and total assets of such companies, vehicles and accounts that are subject to an advisory fee based on performance.
Type of Account | Number of Accounts | Assets of Accounts (in millions) | Number of Accounts Subject to a Performance Fee | Assets Subject to a Performance Fee (in millions) | ||||||||||||||||||||||
| Douglas I. Ostrover | ||||||||||||||||||||||||||
Registered investment companies/Business development companies | 5 | $77,056 | 5 | $77,056 | ||||||||||||||||||||||
Other pooled investment vehicles | 40 | $15,115 | 12 | $9,823 | ||||||||||||||||||||||
Other accounts | — | $— | — | $— | ||||||||||||||||||||||
| Type of Account | Number of Accounts | Assets of Accounts (in millions) | Number of Accounts Subject to a Performance Fee | Assets Subject to a Performance Fee (in millions) | ||||||||||||||||||||||
| Marc S. Lipschultz | ||||||||||||||||||||||||||
| Registered investment companies/Business development companies | 5 | $77,056 | 5 | $77,056 | ||||||||||||||||||||||
| Other pooled investment vehicles | 44 | $25,889 | 16 | $20,597 | ||||||||||||||||||||||
| Other accounts | — | $— | — | $— | ||||||||||||||||||||||
| Type of Account | Number of Accounts | Assets of Accounts (in millions) | Number of Accounts Subject to a Performance Fee | Assets Subject to a Performance Fee (in millions) | ||||||||||||||||||||||
| Craig W. Packer | ||||||||||||||||||||||||||
| Registered investment companies/Business development companies | 5 | $77,056 | 5 | $77,056 | ||||||||||||||||||||||
| Other pooled investment vehicles | 37 | $13,750 | 11 | $9,261 | ||||||||||||||||||||||
| Other accounts | — | $— | — | $— | ||||||||||||||||||||||
| Type of Account | Number of Accounts | Assets of Accounts (in millions) | Number of Accounts Subject to a Performance Fee | Assets Subject to a Performance Fee (in millions) | ||||||||||||||||||||||
| Alexis Maged | ||||||||||||||||||||||||||
| Registered investment companies/Business development companies | 5 | $77,056 | 5 | $77,056 | ||||||||||||||||||||||
| Other pooled investment vehicles | 37 | $13,750 | 11 | $9,261 | ||||||||||||||||||||||
| Other accounts | — | $— | — | $— | ||||||||||||||||||||||
| Type of Account | Number of Accounts | Assets of Accounts (in millions) | Number of Accounts Subject to a Performance Fee | Assets Subject to a Performance Fee (in millions) | ||||||||||||||||||||||
| Erik Bissonnette | ||||||||||||||||||||||||||
| Registered investment companies/Business development companies | 2 | $21,210 | 2 | $21,210 | ||||||||||||||||||||||
| Other pooled investment vehicles | 3 | $754 | 1 | $65 | ||||||||||||||||||||||
| Other accounts | — | $— | — | $— | ||||||||||||||||||||||
139
| Type of Account | Number of Accounts | Assets of Accounts (in millions) | Number of Accounts Subject to a Performance Fee | Assets Subject to a Performance Fee (in millions) | ||||||||||||||||||||||
| Pravin Vazirani | ||||||||||||||||||||||||||
| Registered investment companies/Business development companies | 2 | $21,210 | 2 | $21,210 | ||||||||||||||||||||||
| Other pooled investment vehicles | 3 | $754 | 1 | $65 | ||||||||||||||||||||||
| Other accounts | — | $— | — | $— | ||||||||||||||||||||||
| Type of Account | Number of Accounts | Assets of Accounts (in millions) | Number of Accounts Subject to a Performance Fee | Assets Subject to a Performance Fee (in millions) | ||||||||||||||||||||||
| Jon ten Oever | ||||||||||||||||||||||||||
| Registered investment companies/Business development companies | 2 | $21,210 | 2 | $21,210 | ||||||||||||||||||||||
| Other pooled investment vehicles | 3 | $754 | 1 | $65 | ||||||||||||||||||||||
| Other accounts | — | $— | — | $— | ||||||||||||||||||||||
| Type of Account | Number of Accounts | Assets of Accounts (in millions) | Number of Accounts Subject to a Performance Fee | Assets Subject to a Performance Fee (in millions) | ||||||||||||||||||||||
| Arthur Martini | ||||||||||||||||||||||||||
| Registered investment companies/Business development companies | 2 | $21,210 | 2 | $21,210 | ||||||||||||||||||||||
| Other pooled investment vehicles | 3 | $754 | 1 | $65 | ||||||||||||||||||||||
| Other accounts | — | $— | — | $— | ||||||||||||||||||||||
The management and incentive fees payable by the Blue Owl Credit Clients are based on the gross or net assets and performance, respectively, of each Blue Owl Client.
Biographical information regarding the members of the Technology Lending Investment Committee, who are not directors or executive officers of the Company is as follows:
Mr. Ostrover is Co-Chief Executive Officer of Blue Owl and the chairman of Blue Owl’s board of directors. Mr. Ostrover is also the Co-Chief Executive Officer and serves as a Co-Chief Investment Officer of each of the Blue Owl Credit Advisers. Mr. Ostrover is also a member of the Diversified Lending Investment Committee and the Technology Lending Investment Committee of the Blue Owl Credit Advisers. Previously, Mr. Ostrover co-founded Owl Rock, the predecessor firm to Blue Owl’s Credit platform. Mr. Ostrover served on the boards of directors of OBDC and OBDC II from 2016 through 2021, on the board of directors of the Company from 2018 through 2021, and on the boards of directors of OBDE and OCIC from 2020 through 2021. Prior to co-founding Owl Rock, Mr. Ostrover was one of the founders of GSO Capital Partners (GSO), Blackstone’s alternative credit platform, and a Senior Managing Director at Blackstone until June 2015. Prior to co-founding GSO in 2005, Mr. Ostrover was a Managing Director and Chairman of the Leveraged Finance Group of Credit Suisse First Boston (CSFB). Prior to his role as Chairman, Mr. Ostrover was Global Co-Head of CSFB’s Leveraged Finance Group, during which time he was responsible for all of CSFB’s origination, distribution and trading activities relating to high yield securities, leveraged loans, high yield credit derivatives and distressed securities. Mr. Ostrover joined CSFB in November 2000 when CSFB acquired Donaldson, Lufkin & Jenrette (“DLJ”), where he was a Managing Director in charge of High Yield and Distressed Sales, Trading and Research. Mr. Ostrover had been a member of DLJ’s high yield team since he joined the firm in 1992. Mr. Ostrover is actively involved in non-profit organizations including serving on the Board of Directors of the Michael J. Fox Foundation, the Mount Sinai Health System, and the Leadership Council for Memorial Sloan Kettering. Mr. Ostrover also serves on the investment committee of the Brunswick School. Mr. Ostrover received an M.B.A. from New York University Stern School of Business and a B.A. in Economics from the University of Pennsylvania.
Mr. Lipschultz is Co-Chief Executive Officer of Blue Owl and a member of Blue Owl’s board of directors. Mr. Lipschultz also serves as Co-Chief Investment Officer for each of the Blue Owl Credit Advisers. Previously, Mr. Lipschultz co-founded Owl Rock, the predecessor firm to Blue Owl’s Credit platform. Prior to co-founding Owl Rock, Mr. Lipschultz spent more than two decades at KKR serving on the firm’s Management Committee and as the Global Head of Energy and Infrastructure. Mr. Lipschultz
140
has a wide range of experience in alternative investments, including leadership roles in private equity, private credit and real assets. Prior to joining KKR, Mr. Lipschultz was with Goldman, Sachs & Co., where he focused on mergers and acquisitions and principal investment activities. Mr. Lipschultz served on the board of the Hess Corporation until 2025 and is actively involved in a variety of nonprofit organizations, serving as a trustee or board member of the 92nd Street Y, American Enterprise Institute for Public Policy Research, Michael J. Fox Foundation, Mount Sinai Health System, Riverdale Country School and the Stanford University Board of Trustees. Mr. Lipschultz received an M.B.A. with high distinction, Baker Scholar, from Harvard Business School and an A.B. with honors and distinction, Phi Beta Kappa, from Stanford University.
Mr. Maged is Chief Credit Officer of Blue Owl, a member of the Diversified Lending Investment Committee and the Technology Lending Investment Committee of each of the Blue Owl Credit Advisers and Vice President of each of the Blue Owl BDCs. Mr. Maged is also a Senior Managing Director of Blue Owl. Prior to joining Owl Rock, the predecessor firm to Blue Owl’s Credit platform, in January 2016, Mr. Maged was Chief Financial Officer of Barkbox, Inc., a New York-based provider of pet-themed products and technology, from September 2014 to November 2015. Prior to that, Mr. Maged was a Managing Director with Goldman Sachs & Co. from 2007 until 2014. At Goldman Sachs & Co., Mr. Maged held several leadership positions, including Chief Operating Officer of the investment bank’s Global Credit Finance businesses, Co-Chair of the Credit Markets Capital Committee and a member of the Firmwide Capital Committee. Prior to assuming that role in 2011, Mr. Maged served as Chief Underwriting Officer for the Americas and oversaw the U.S. Bank Debt Portfolio Group and US Loan Negotiation Group. From mid-2007 to the end of 2008, Mr. Maged was Head of Bridge Finance Capital Markets in the Americas Financing Group’s Leveraged Finance Group, where he coordinated the firm’s High Yield Bridge Lending and Syndication business. Prior to joining Goldman, Sachs & Co, Mr. Maged was Head of the Bridge Finance Group at Credit Suisse and also worked in the Loan Capital Markets Group at Donaldson, Lufkin and Jenrette (“DLJ”). Upon DLJ’s merger with Credit Suisse in 2000, Mr. Maged joined Credit Suisse’s Syndicated Loan Group and, in 2003, founded its Bridge Finance Group. Earlier in his career, Mr. Maged was a member of the West Coast Sponsor Coverage Group at Citigroup and the Derivatives Group at Republic National Bank, as well as a founding member of the Loan Syndication Group at Swiss Bank Corporation. Mr. Maged received an M.B.A. from New York University Stern School of Business and a B.A. from Vassar College.
Mr. Vazirani is a Managing Director of Blue Owl and is a member of the Adviser’s Technology Lending Investment Committee. Prior to joining Owl Rock, the predecessor firm to Blue Owl’s Credit platform, in 2018, Mr. Vazirani was a partner with Menlo Ventures. While at Menlo Ventures Mr. Vazirani focused on investments in the SaaS, cloud and e-commerce sectors. Mr. Vazirani’s prior investments include Carbonite (IPO: CARB); Centrality Communications (acquired by SiR F Holdings); EdgeCast Networks (acquired by Verizon); Credant Technologies (acquired by Dell); Like.com (acquired by Google); and newScale (acquired by Cisco Systems). Mr. Vazirani started his career as an engineer working at the Jet Propulsion Laboratory. Later, Mr. Vazirani worked for Pacific Communication Sciences and ADC Telecommunications as a product manager. Mr. Vazirani received an M.B.A. from the Harvard University Graduate School of Business and B.S. and M.S. degrees in electrical engineering from MIT.
Mr. ten Oever is a Senior Managing Director of Blue Owl, serves as the Head of Technology Credit for each of the Blue Owl Credit Advisers and serves as a member of the Adviser’s Technology Lending Investment Committee. Prior to joining Owl Rock, the predecessor firm to Blue Owl’s Credit platform, in 2019, Mr. ten Oever was a Managing Director at Goldman Sachs & Co. from 2008 until 2019. At Goldman Sachs & Co., Mr. ten Oever held several positions in the Americas Financing Group’s Leveraged Finance Group, including leadership of the TMT and Healthcare verticals. Prior to working at Goldman Sachs, Mr. ten Oever was a Vice President at Credit Suisse Securities (USA) LLC, in the Media & Telecom Group from 2000 until 2008 and an attorney at Sullivan & Cromwell LLP from 1997 until 2000. Mr. ten Oever received a J.D. from Yale Law School and a B.A. from Huron College at the University of Western Ontario.
Mr. Martini is a Senior Managing Director at Blue Owl, a member of the Direct Lending Investment Team and serves as a member of the Adviser's Technology Lending Investment Committee. In his role, he focuses on originating, structuring, and overseeing execution and portfolio management. Prior to Blue Owl, Mr. Martini was a Managing Director and U.S. Head of Financial Sponsors in the Opportunistic Credit group at Apollo Global Management (“Apollo”). Prior to joining Apollo in 2013, Mr. Martini was a Director with Barclays Private Credit Partners (“BPCP”). Before joining BPCP in 2008, Mr. Martini was an Associate Director with Barclays Capital in the US Leveraged Finance Group. Prior to joining Barclays Capital in 2007, Mr. Martini was a Vice President at Cerberus Capital Management LP (Ableco Finance LLC). Before joining Cerberus in 2002, Mr. Martini spent three years in the Investment Banking Division at JP Morgan Chase & Co. covering the TMT sector. Prior to that, Mr. Martini spent two years as an Analyst in the Special Loan Group at Chase Manhattan Bank. Mr. Martini received his BS in Finance and International Business from New York University Stern School of Business.
Ownership of Securities
The table below shows the dollar range of shares of our common stock to be beneficially owned by the members of the Technology Lending Investment Committee as of February 11, 2026 stated as one of the following dollar ranges: None; $1-$10,000; $10,001- $50,000; $50,001-$100,000; $100,001-$500,000; $500,001-$1,000,000; or Over $1,000,000.
141
| Name | Dollar Range of Equity Securities in Blue Owl Technology Finance Corp.(1)(2) | ||||||||||
| Douglas I. Ostrover | Over $1,000,000(3) | ||||||||||
| Marc S. Lipschultz | None | ||||||||||
| Craig W. Packer | None | ||||||||||
| Alexis Maged | None | ||||||||||
Erik Bissonnette | Over $1,000,000 | ||||||||||
| Pravin Vazirani | Over $1,000,000 | ||||||||||
| Jon ten Oever | $500,001-$1,000,000 | ||||||||||
Arthur Martini | $500,001 - $1,000,000 | ||||||||||
____________________
(1)Beneficial ownership determined in accordance with Rule 16a-1(a)(2) promulgated under the 1934 Act.
(2)The dollar range of equity securities of the Company beneficially owned by members of the Technology Lending Investment Committee, if applicable, is calculated by multiplying the closing price per share of the Company’s common stock as of February 11, 2026 times the number of shares beneficially owned.
(3)Reflects the shares held by Owl Rock FIC Tech BDC LLC. Mr. Ostrover disclaims beneficial ownership of these securities except to the extent of his pecuniary interest therein.
142
Item 11. Executive Compensation.
We do not currently have any employees and do not expect to have any employees. Services necessary for our business are provided by individuals who are employees of the Adviser or its affiliates, pursuant to the terms of the Investment Advisory Agreement and the Administration Agreement, as applicable. Our day-to-day investment and administrative operations are managed by the Adviser. Most of the services necessary for the origination and administration of our investment portfolio will be provided by investment professionals employed by the Adviser or its affiliates.
None of our executive officers will receive direct compensation from us. We will reimburse the Adviser the allocable portion of the compensation paid by the Adviser (or its affiliates) to our chief compliance officer and chief financial officer and their respective staffs (based on the percentage of time such individuals devote, on an estimated basis, to our business and affairs). The members of the Technology Lending Investment Committee, through their financial interests in the Adviser, are entitled to a portion of the profits earned by the Adviser, which includes any fees payable to the Adviser under the terms of the Investment Advisory Agreement, less expenses incurred by the Adviser in performing its services under the Investment Advisory Agreement.
Director Compensation
No compensation is expected to be paid to our director who is an “interested person,” as such term is defined in Section 2(a)(19) of the 1940 Act. Our directors who do not also serve in an executive officer capacity for us or the Adviser are entitled to receive annual cash retainer fees, fees for participating in in-person board and committee meetings and annual fees for serving as a committee chairperson, determined based on our net assets as of the end of each fiscal quarter. As of December 31, 2025, these directors were Edward D’Alelio, Christopher M. Temple, Eric Kaye, Melissa Weiler and Victor Woolridge. We pay each independent director the following amounts for serving as a director:
| Annual Committee Chair Cash Retainer | ||||||||||||||||||||||||||
| Assets Under Management | Annual Cash Retainer | Chair of the Board | Audit | Committee Chair | ||||||||||||||||||||||
| $0 < $2.5 Billion | $ | 150,000 | $ | 15,000 | $ | 10,000 | $ | 5,000 | ||||||||||||||||||
| $2.5 Billion < $5 Billion | $ | 200,000 | $ | 15,000 | $ | 10,000 | $ | 5,000 | ||||||||||||||||||
| $5 Billion < $10 Billion | $ | 250,000 | $ | 15,000 | $ | 10,000 | $ | 5,000 | ||||||||||||||||||
$10 Billion < $15 Billion | $ | 300,000 | $ | 15,000 | $ | 10,000 | $ | 5,000 | ||||||||||||||||||
≥ $15 Billion | $ | 350,000 | $ | 15,000 | $ | 10,000 | $ | 5,000 | ||||||||||||||||||
We also reimburse each of the directors for all reasonable and authorized business expenses in accordance with our policies as in effect from time to time, including reimbursement of reasonable out-of-pocket expenses incurred in connection with attending each board meeting and each committee meeting not held concurrently with a board meeting.
The table below sets forth the compensation received by each director from the Company and the Fund Complex for service during the fiscal year ended December 31, 2025:
Name | Fees Earned and Paid in Cash by the Company | Total Compensation from the Company | Total Compensation from the Fund Complex | |||||||||||||||||
| Edward D'Alelio | $ | 290,000 | $ | 290,000 | $ | 1,442,806 | ||||||||||||||
| Christopher M. Temple | $ | 285,000 | $ | 285,000 | $ | 1,416,500 | ||||||||||||||
| Eric Kaye | $ | 280,000 | $ | 280,000 | $ | 1,390,194 | ||||||||||||||
| Melissa Weiler | $ | 275,000 | $ | 275,000 | $ | 1,363,889 | ||||||||||||||
| Victor Woolridge | $ | 275,000 | $ | 275,000 | $ | 1,363,889 | ||||||||||||||
Item 12. Security Ownership of Certain Beneficial Owners and Management and Related Shareholder Matters
Beneficial ownership is determined in accordance with the rules and regulations of the SEC. These rules generally provide that a person is the beneficial owner of securities if such person has or shares the power to vote or direct the voting thereof, or to dispose or direct the disposition thereof or has the right to acquire such powers within 60 days. The following table sets forth, as of February 11, 2026 the beneficial ownership according to information furnished to us by such persons or publicly available filings. Ownership information for those persons who beneficially own 5% or more of the outstanding shares of our common stock is based upon filings by such persons with the SEC and other information obtained from such persons of each current director, the nominees for director, the Company’s executive officers, the executive officers and directors as a group, and each person known to us to beneficially own 5% or more of the outstanding shares of our common stock.
143
The percentage ownership is based on 465,329,991 shares of our common stock outstanding as of February 11, 2026. To our knowledge, except as indicated in the footnotes to the table, each of the shareholders listed below has sole voting and/or investment power with respect to shares of our common stock beneficially owned by such shareholder.
| Name and Address | Number of Shares Owned | Percentage of Class Outstanding | ||||||||||||
| 5% Owners | ||||||||||||||
The Regents Of The University Of California(3) | 43,624,472 | 9.4 | % | |||||||||||
Mubadala Investment Company PJSC(2) | 29,130,491 | 6.2 | % | |||||||||||
| Interested Directors | ||||||||||||||
Craig W. Packer | — | — | ||||||||||||
| Independent Directors | ||||||||||||||
| Edward D'Alelio | 46,876 | * | ||||||||||||
| Eric Kaye | — | — | ||||||||||||
| Christopher M. Temple | — | — | ||||||||||||
| Melissa Weiler | — | — | ||||||||||||
Victor Woolridge(4) | 10,853 | * | ||||||||||||
| Executive Officers | ||||||||||||||
| Karen Hager | — | — | ||||||||||||
Erik Bissonnette(5) | 166,525 | * | ||||||||||||
| Neena Reddy | — | — | ||||||||||||
| Jonathan Lamm | 5,444 | * | ||||||||||||
| Shari Withem | — | — | ||||||||||||
| Matthew Swatt | — | — | ||||||||||||
All officers and directors as a group (12 persons)(5) | 229,698 | * | ||||||||||||
*Less than 1%
(1)The address of The Regents Of The University of California is 1111 Broadway, 21st Floor, Oakland, CA 94607.
(2)As of December 31, 2025, each of Mubadala Investment Company PJSC and Mamoura Diversified Global Holding PJSC may have been deemed to have beneficially owned 29,130,491 shares of Common Stock, par value $0.01 per share ("Common Stock"), of Blue Owl Technology Finance Corp. (the "Issuer"). Of such shares of Common Stock, 18,449,359 shares of Common Stock were directly held and beneficially owned by MIC Capital Management 93 RSC Ltd ("93 RSC") and 10,681,132 shares of Common Stock were directly held and beneficially owned by Fifteenth Investment Company LLC. 93 RSC is a wholly owned subsidiary of MIC Capital Management 85 RSC Ltd ("85 RSC"). 85 RSC and 15th Investment Company LLC are each wholly owned subsidiaries of Mamoura Diversified Global Holding PJSC, which is a wholly owned subsidiary of Mubadala Investment Company PJSC. Due to their relationship with 93 RSC, each of 85 RSC, Mamoura Diversified Global Holding PJSC and Mubadala Investment Company PJSC may have been deemed to have indirectly beneficially owned the shares of Common Stock of the Issuer that were held directly by 93 RSC. Due to their relationship with Fifteenth Investment Company LLC, each of Mamoura Diversified Global Holding PJSC and Mubadala Investment Company PJSC may have been deemed to have indirectly beneficially owned the shares of Common Stock of the Issuer that were held directly by 15th Investment Company LLC. The address of Mamoura Diversified Global Holding PJSC and Mubadala Investment Company PJSC is Al Mamoura A, Al Muroor Street, Abu Dhabi, United Arab Emirates.
(3)Shares are held by Victor Woolridge 2022 Trust. Mr. Woolridge disclaims beneficial ownership of these securities except to the extent of his pecuniary interest therein.
(4)Shares held jointly by Mr. Bissonnette and his spouse.
(5)The address for each of the directors and officers is c/o Blue Owl Technology Finance Corp., 399 Park Avenue, 37th Floor, New York, New York 10022.
Dollar Range of Equity Securities Beneficially Owned by Directors
The table below shows the dollar range of equity securities of the Company and the aggregate dollar range of equity securities of the Fund Complex that were beneficially owned by each director as of February 11, 2026, stated as one of the following dollar ranges: None; $1-$10,000; $10,001- $50,000; $50,001-$100,000; or Over $100,000. For purposes of this Form 10-K, the term “Fund Complex” is defined to include the Company, OBDC, OBDC II, OCIC and OTIC.
144
| Name of Director | Dollar Range of Equity Securities in Blue Owl Technology Finance Corp.(1)(2) | Aggregate Dollar Range of Equity Securities in the Fund Complex(1)(3) | ||||||||||||
| Interested Directors | ||||||||||||||
| Craig W. Packer | None | Over $100,000 | ||||||||||||
| Independent Directors | ||||||||||||||
| Edward D'Alelio | Over $100,000 | Over $100,000 | ||||||||||||
| Eric Kaye | None | Over $100,000 | ||||||||||||
| Christopher M. Temple | None | Over $100,000 | ||||||||||||
| Melissa Weiler | None | Over $100,000 | ||||||||||||
| Victor Woolridge | Over $100,000 | Over $100,000 | ||||||||||||
(1)Beneficial ownership has been determined in accordance with Rule 16a-1(a)(2) of the 1934 Act.
(2)The dollar range of equity securities of the Company beneficially owned by directors of the Company, if applicable, is calculated by multiplying the closing price per share of the Company’s common stock on February 11, 2026, multiplied by the number of shares of the Company’s common stock beneficially owned.
(3)The dollar range of equity securities in the Fund Complex beneficially owned by directors of the Company, if applicable, is the sum of (1) the closing price per share of OBDC’s common stock on February 11, 2026, multiplied by the number of shares of OBDC’s common stock beneficially owned by the director, (2) the current net asset value per share of OBDC II’s common stock multiplied by the number of shares of OBDC II’s common stock beneficially owned by the director, (3) the closing price per share of the Company’s common stock on February 11, 2026, multiplied by the number of shares of the Company’s common stock beneficially owned by the director, (4) the current net offering price per share of OCIC’s common stock multiplied by the number of shares of OCIC’s common stock beneficially owned by the director, and (5) the current net offering price per share of OTIC’s common stock multiplied by the number of shares of OTIC’s common stock beneficially owned by the director.
Item 13. Certain Relationships and Related Transactions, and Director Independence
Certain Relationships and Related Transactions
We have entered into both the Investment Advisory Agreement and the Administration Agreement with the Adviser. Pursuant to the Investment Advisory Agreement, we will pay the Adviser a base management fee and an incentive fee. See “ITEM 1. BUSINESS —Investment Advisory Agreement” for a description of how the fees payable to the Adviser will be determined. Pursuant to the Administration Agreement, we will reimburse the Adviser for expenses necessary to perform services related to our administration and operations. In addition, the Adviser or its affiliates may engage in certain origination activities and receive attendant arrangement, structuring or similar fees.
Our executive officers, certain of our directors and certain other finance professionals of Blue Owl also serve as executives of the Blue Owl Credit Advisers and officers and directors of the Company and certain professionals of Blue Owl and the Adviser are officers of Blue Owl Securities LLC. In addition, our executive officers and directors and the members of the Adviser and members of its Technology Lending Investment Committee serve or may serve as officers, directors or principals of entities that operate in the same, or a related, line of business as we do (including the Blue Owl Credit Advisers) including serving on their respective investment committees and/or on the investment committees of investments funds, accounts or other investment vehicles managed by our affiliates which may have investment objectives similar to our investment objective. At times we may compete with the Blue Owl Credit Clients and other Blue Owl clients, for capital and investment opportunities. As a result, we may not be given the opportunity to participate in certain investments made by the Blue Owl Credit Clients and other Blue Owl clients. This can create a potential conflict when allocating investment opportunities among us and such other Blue Owl Credit Clients. An investment opportunity that is suitable for multiple clients of the Blue Owl Credit Advisers or other affiliated advisers may not be capable of being shared among some or all of such clients and affiliates due to the limited scale of the opportunity or other factors, including regulatory restrictions imposed by the 1940 Act. However, for the Adviser and its affiliates to fulfill their fiduciary duties to each of their clients, the Blue Owl Credit Advisers have put in place an investment allocation policy that seeks to ensure the fair and equitable allocation of investment opportunities over time and addresses the co-investment restrictions set forth under the 1940 Act. In addition, from time to time, Blue Owl Securities LLC may purchase securities in certain of our offerings.
Allocation of Investment Opportunities
The Blue Owl Credit Advisers intend to allocate investment opportunities in a manner that is fair and equitable over time and is consistent with its allocation policy, so that no client of the Adviser or its affiliates is disadvantaged in relation to any other client of the Adviser or its affiliates, taking into account such factors as the relative amounts of capital available for new investments, cash on hand, existing commitments and reserves, the investment programs and portfolio positions of the participating investment accounts, the clients for which participation is appropriate, targeted leverage level, targeted asset mix and any other factors deemed appropriate. The Blue Owl Credit Advisers intend to allocate common expenses among us and other clients of the Adviser and its affiliates in a manner that is fair and equitable over time or in such other manner as may be required by applicable law or the Investment Advisory
145
Agreement. Fees and expenses generated in connection with potential portfolio investments that are not consummated will be allocated in a manner that is fair and equitable over time and in accordance with policies adopted by the Blue Owl Credit Advisers and the Investment Advisory Agreement.
The Blue Owl Credit Advisers have put in place an investment allocation policy that seeks to ensure the equitable allocation of investment opportunities and addresses the co-investment restrictions set forth under the 1940 Act. When we engage in co-investments as permitted by the exemptive relief described below, we will do so in a manner consistent with the Blue Owl Credit Advisers’ allocation policy. In situations where co-investment with other entities managed by the Adviser or its affiliates is not permitted or appropriate, such as when there is an opportunity to invest in different securities of the same issuer, a committee comprised of certain executive officers of the Blue Owl Credit Advisers (including executive officers of the Adviser) along with other officers and employees, will need to decide whether we or such other entity or entities will proceed with the investment. The allocation committee will make these determinations based on the Blue Owl Credit Advisers’ allocation policy, which generally requires that such opportunities be offered to eligible accounts in a manner that will be fair and equitable over time.
The Blue Owl Credit Advisers’ allocation policy is designed to manage the potential conflicts of interest between the Adviser’s fiduciary obligations to us and its or its affiliates’ similar fiduciary obligations to other Blue Owl clients; however, there can be no assurance that the Blue Owl Credit Advisers’ efforts to allocate any particular investment opportunity fairly among all clients for whom such opportunity is appropriate will result in an allocation of all or part of such opportunity to us. Not all conflicts of interest can be expected to be resolved in our favor.
The allocation of investment opportunities among us and any of the other investment funds sponsored or accounts managed by the Adviser or its affiliates may not always, and often will not, be proportional. In general, pursuant to the Blue Owl Credit Advisers’ allocation policy, the process for making an allocation determination includes an assessment as to whether a particular investment opportunity (including any follow-on investment in, or disposition from, an existing portfolio company held by the Company or another investment fund or account) is suitable for us or another investment fund or account including the Blue Owl Credit Clients. In making this assessment, the Blue Owl Credit Advisers may consider a variety of factors, including, without limitation: the investment objectives, guidelines and strategies applicable to the investment fund or account; the nature of the investment, including its risk-return profile and expected holding period; portfolio diversification and concentration concerns; the liquidity needs of the investment fund or account; the ability of the investment fund or account to accommodate structural, timing and other aspects of the investment process; the life cycle of the investment fund or account; legal, tax and regulatory requirements and restrictions, including, as applicable, compliance with the 1940 Act (including requirements and restrictions pertaining to co-investment opportunities discussed below); compliance with existing agreements of the investment fund or account; the available capital of the investment fund or account; diversification requirements for BDCs or RICs; the gross asset value and net asset value of the investment fund or account; the current and targeted leverage levels for the investment fund or account; and portfolio construction considerations. The relevance of each of these criteria will vary from investment opportunity to investment opportunity. In circumstances where the investment objectives of multiple investment funds or accounts regularly overlap, while the specific facts and circumstances of each allocation decision will be determinative, the Blue Owl Credit Advisers may afford prior decisions precedential value.
Pursuant to the Blue Owl Credit Advisers’ allocation policy, if through the foregoing analysis, it is determined that an investment opportunity is appropriate for multiple investment funds or accounts, the Blue Owl Credit Advisers generally will determine the appropriate size of the opportunity for each such investment fund or account. If an investment opportunity falls within the mandate of two or more investment funds or accounts, and there are no restrictions on such funds or accounts investing with each other, then each investment fund or account will receive the amount of the investment that it is seeking, as determined based on the criteria set forth above.
Certain allocations may be more advantageous to us relative to one or all of the other investment funds, or vice versa. While the Blue Owl Credit Advisers will seek to allocate investment opportunities in a way that it believes in good faith is fair and equitable over time, there can be no assurance that our actual allocation of an investment opportunity, if any, or terms on which the allocation is made, will be as favorable as they would be if the conflicts of interest to which the Adviser may be subject did not exist. In addition, the Adviser and its affiliates are permitted to allocate an investment to a number of products across platforms that it views as appropriate for the particular investment objectives, strategies and characteristics of such products.
Exemptive Relief
We rely on an order for exemptive relief (the “Order”) to co-invest with other funds managed by the Adviser or certain affiliates in a manner consistent with our investment objective, positions, policies, strategies and restrictions as well as regulatory requirements and other pertinent factors. Pursuant to the Order, we generally are permitted to co-invest with certain of our affiliates if such co-investments are done on the same terms and at the same time, as further detailed in the Order. The Order requires that a “required majority” (as defined in Section 57(o) of the 1940 Act) of our Board make certain findings (1) in most instances when we co-invest with our affiliates in an issuer where our affiliate has an existing investment in the issuer, and (2) if we dispose of an asset acquired in a transaction under the Order unless the disposition is done on a pro rata basis. Pursuant to the Order, the Board will oversee our participation in the co-investment program. As required by the Order, we have adopted, and the Board has approved, policies and
146
procedures reasonably designed to ensure compliance with the terms of the Order, and the Adviser and our Chief Compliance Officer will provide reporting to the Board.
Review, Approval or Ratification of Transactions with Related Persons
The Audit Committee is required to review and approve any transactions with related persons (as such term is defined in Item 404 of Regulation S-K).
License Agreement
We have entered into a license agreement (the “License Agreement”), pursuant to which an affiliate of Blue Owl has granted us a non-exclusive license to use the name “Blue Owl.” Under the License Agreement, we have a right to use the Blue Owl name for so long as the Adviser or one of its affiliates remains our investment adviser. Other than with respect to this limited license, we have no legal right to the “Blue Owl” name or logo.
Material Non-Public Information
Our senior management, members of the Adviser’s Technology Lending Investment Committee and other investment professionals from the Adviser may serve as directors of, or in a similar capacity with, companies in which we invest or in which we are considering making an investment. Through these and other relationships with a company, these individuals may obtain material non-public information that might restrict our ability to buy or sell the securities of such company under the policies of the company or applicable law.
Director Independence
Pursuant to our certificate of incorporation, a majority of the Board will at all times consist of directors who are not “interested persons” of us, of the Adviser, or of any of our or its respective affiliates, as defined in the 1940 Act. Under Section 303A.00 of the
NYSE Listed Company Manual, a director of a business development company (“BDC”) is considered to be independent if he or she
is not an “interested person” of ours, as defined in Section 2(a)(19) of the 1940 Act. We refer to these directors as our “Independent Directors.”
Consistent with these considerations, after review of all relevant transactions and relationships between each director, or any of his or her family members, and the Company, the Adviser, or of any of their respective affiliates, the Board has determined that each of Messrs. Woolridge, Kaye, Temple, and D’Alelio and Ms. Weiler is independent, has no material relationship with the Company, and is not an “interested person” (as defined in Section 2 (a)(19) of the 1940 Act) of the Company. Mr. Packer is considered an “interested person” (as defined in the 1940 Act) of the Company since he is employed by the Adviser.
Item 14. Principal Accountant Fees and Services.
KPMG LLP, New York, New York, has been appointed by the Board to serve as the Company’s independent registered public accounting firm for the year ending December 31, 2026. KPMG LLP acted as the Company’s independent registered accounting firm for the fiscal years ended December 31, 2025, 2024, and 2023. The Company knows of no direct financial or material indirect financial interest of KPMG LLP in the Company.
Fees
Set forth in the table below are audit fees, audit-related fees, tax fees and all other fees billed to the Company by KPMG LLP for professional services performed for the fiscal years ended December 31, 2025 and 2024:
| For the Year Ended December 31, | ||||||||||||||
| 2025 | 2024 | |||||||||||||
Audit Fees(1) | $ | 1,612,000 | $ | 1,154,850 | ||||||||||
Audit-Related Fees(2) | — | — | ||||||||||||
Tax Fees(3) | 146,310 | 168,352 | ||||||||||||
All Other Fees(4) | — | — | ||||||||||||
| Total Fees | $ | 1,758,310 | $ | 1,323,202 | ||||||||||
(1)“Audit Fees” are fees billed for professional services rendered for the audit of the Company’s annual financial statements and review of interim financial statements or services that are normally provided by KPMG LLP in connection with statutory and regulatory filings or engagements, including comfort letters and consents.
(2)“Audit-Related Fees” are fees billed for assurance and related services by KPMG LLP that are reasonably related to the performance of the audit or review of the Company’s financial statements that are not reported under ”Audit Fees.”
147
(3)“Tax Fees” are fees billed for services rendered by KPMG LLP for tax compliance, tax advice, and tax planning. These services include assistance regarding federal, state and international tax compliance, customs and duties and international tax planning.
(4)“All Other Fees” are fees billed for services other then those stated above.
Pre-Approval Policies and Procedures
The Audit Committee has established a pre-approval policy that describes the permitted audit, audit-related, tax and other services to be provided by KPMG LLP, the Company’s independent registered public accounting firm. The policy requires that the Audit Committee pre-approve the audit and non-audit services performed by the independent auditor in order to assure that the provision of such service does not impair the auditor’s independence.
Any requests for audit, audit-related, tax and other services that have not received general pre-approval must be submitted to the Audit Committee for specific pre-approval, irrespective of the amount, and cannot commence until such approval has been granted. Normally, pre-approval is provided at regularly scheduled meetings of the Audit Committee. The Audit Committee does not delegate its responsibilities to pre-approve services performed by the independent registered public accounting firm to management.
148
PART IV
Item 15. Exhibits, Financial Statement Schedules.
The following documents are filed as part of this annual report:
(1)Financial Statements – Financial statements are included in Item 8. See the Index to the Consolidated Financial Statements on page F-1 of this Annual Report.
(2)Financial Statement Schedules – None. We have omitted financial statement schedules because they are not required or are not applicable, or the required information is shown in the consolidated statements or notes to the consolidated financial statements included in this Annual Report.
(3)Exhibits – The following is a list of all exhibits filed as a part of this Annual Report, including those incorporated by reference
Please note that the agreements included as exhibits to this Form 10-K are included to provide information regarding their terms and are not intended to provide any other factual or disclosure information about us or the other parties to the agreements. The agreements contain representations and warranties by each of the parties to the applicable agreement that have been made solely for the benefit of the other parties to the applicable agreement and may not describe the actual state of affairs as of the date they were made or at any other time.
The following exhibits are filed as part of this report or hereby incorporated by reference to exhibits previously filed with the SEC:
149
4.9 | ||||||||
4.10* | ||||||||
| 10.1 | ||||||||
| 10.2 | ||||||||
| 10.3 | ||||||||
| 10.4 | ||||||||
| 10.5 | ||||||||
| 10.6 | ||||||||
| 10.7 | ||||||||
| 10.8 | ||||||||
| 10.9 | ||||||||
| 10.10 | ||||||||
| 10.11 | ||||||||
| 10.12 | ||||||||
| 10.13 | ||||||||
| 10.14 | ||||||||
| 10.15 | ||||||||
| 10.16 | ||||||||
150
151
10.32 | ||||||||
10.33 | ||||||||
10.34 | ||||||||
10.35 | ||||||||
10.36 | ||||||||
10.37 | ||||||||
10.38 | ||||||||
10.39 | ||||||||
10.40 | ||||||||
10.41 | ||||||||
10.42 | ||||||||
10.43* | Amended and Restated Credit Agreement, dated as of October 30, 2025, among Athena Funding II LLC as Borrower, the Lenders referred to therein, MUFG Bank, LTD., as Administrative Agent, and State Street Bank and Trust Company, as Collateral Agent, Collateral Administrator, Custodian and Document Custodian. | |||||||
10.44 | ||||||||
10.45 | ||||||||
10.46 | ||||||||
10.47 | ||||||||
10.48 | ||||||||
152
10.49 | ||||||||
19.1* | ||||||||
| 21.1* | ||||||||
23.1* | ||||||||
| 24 | ||||||||
| 31.1* | ||||||||
| 31.2* | ||||||||
| 32.1** | ||||||||
| 32.2** | ||||||||
97* | ||||||||
| 99.1* | ||||||||
99.2* | ||||||||
99.3* | ||||||||
| 101.INS | Inline XBRL Instance Document - the instance document does not appear in the Interactive Data File because XBRL tags are embedded within the Inline XBRL document | |||||||
| 101.SCH | Inline XBRL Taxonomy Extension Schema Document | |||||||
| 101.CAL | Inline XBRL Taxonomy Extension Calculation Linkbase Document | |||||||
| 101.DEF | Inline XBRL Taxonomy Extension Definition Linkbase Document | |||||||
| 101.LAB | Inline XBRL Taxonomy Extension Label Linkbase Document | |||||||
| 101.PRE | Inline XBRL Taxonomy Extension Presentation Linkbase Document | |||||||
| 104 | Cover Page Interactive Data File (embedded within the Inline XBRL document) | |||||||
____________________
*Filed herein
**Furnished herein.
Item 16. Form 10-K Summary
Not applicable.
SIGNATURES
Pursuant to the requirements of Section 13 or 15(d) of the Securities Exchange Act of 1934, as amended, the Registrant has duly caused this Report to be signed on its behalf by the undersigned, thereunto duly authorized.
| Blue Owl Technology Finance Corp. | |||||||||||
Date: February 18, 2026 | By: | /s/ Jonathan Lamm | |||||||||
| Jonathan Lamm | |||||||||||
| Chief Operating Officer and Chief Financial Officer | |||||||||||
Each person whose signature appears below constitutes and appoints Craig W. Packer and Jonathan Lamm, and each of them, such person’s true and lawful attorney-in-fact and agent, with full power of substitution and revocation, for such person and in such person’s name, place and stead, in any and all capacities, to sign one or more Annual Reports on Form 10-K for the fiscal year ended December 31, 2025, and any and all amendments thereto, and to file same with all exhibits thereto, and other documents in connection therewith, with the Securities and Exchange Commission, granting unto said attorneys-in-fact and agents, and each of them, full power and authority to do and perform each and every act and thing requisite and necessary to be done in connection therewith, as fully to all
153
intents and purposes as such person might or could do in person, hereby ratifying and confirming all that said attorneys-in-fact and agents and each of them, or their or his substitute or substitutes, may lawfully do or cause to be done by virtue hereof.
Pursuant to the requirements of the Securities Exchange Act of 1934, this Report has been signed below by the following persons on behalf of the Registrant in the capacities indicated on February 18, 2026.
| Name | Title | |||||||
| /s/ Craig W. Packer | Chief Executive Officer and Director | |||||||
| Craig W. Packer | ||||||||
| /s/ Edward D’Alelio | Director and Chairman of the Board of Directors | |||||||
| Edward D’Alelio | ||||||||
| /s/ Christopher M. Temple | Director and Chairman of the Audit Committee | |||||||
| Christopher M. Temple | ||||||||
| /s/ Eric Kaye | Director and Chairman of the Nominating and Corporate Governance | |||||||
| Eric Kaye | Committee | |||||||
| /s/ Melissa Weiler | Director | |||||||
| Melissa Weiler | ||||||||
| /s/ Victor Woolridge | Director | |||||||
| Victor Woolridge | ||||||||
| /s/ Jonathan Lamm | Chief Operating Officer, Chief Financial Officer | |||||||
Jonathan Lamm | ||||||||
| /s/ Matthew Swatt | Co-Chief Accounting Officer, Co-Controller, and Co-Treasurer | |||||||
| Matthew Swatt | ||||||||
| /s/ Shari Withem | Co-Chief Accounting Officer, Co-Controller, and Co-Treasurer | |||||||
| Shari Withem | ||||||||
154